
Tutorial | Code notebooks and recipes#
Get started#
Dataiku not only has native Jupyter notebooks for experimentation, but also has a way to deploy them as recipes into production workflows.
Objectives#
In this tutorial, you will:
Create, edit, publish, and unload Jupyter notebooks.
Create a code recipe from a notebook.
Sync code back and forth between a notebook and a recipe.
Run a code recipe in the Flow.
Prerequisites#
Dataiku 12.0 or later.
An Advanced Analytics Designer or Full Designer user profile.
Some familiarity with coding in Python and using Jupyter notebooks.
The requested permissions for code execution.
You may also want to review Concept | Code notebooks and Concept | Code recipes.
Create the project#
From the Dataiku Design homepage, click + New Project.
Select Learning projects.
Search for and select Code Notebooks & Recipes.
If needed, change the folder into which the project will be installed, and click Create.
From the project homepage, click Go to Flow (or type
g+f).
From the Dataiku Design homepage, click + New Project.
Select DSS tutorials.
Filter by Developer.
Select Code Notebooks & Recipes.
From the project homepage, click Go to Flow (or type
g+f).
Note
You can also download the starter project from this website and import it as a zip file.
Use a code notebook#
Given their usefulness for data science, Jupyter notebooks are natively embedded in Dataiku and tightly integrated with other components, which makes them easy to use in various ways.
Create a Jupyter notebook#
Depending on your objectives, you can create a Jupyter notebook in Dataiku in a number of different ways. In this exercise, you will create a notebook from a dataset, which simplifies reading in the dataset of interest using the Dataiku API.
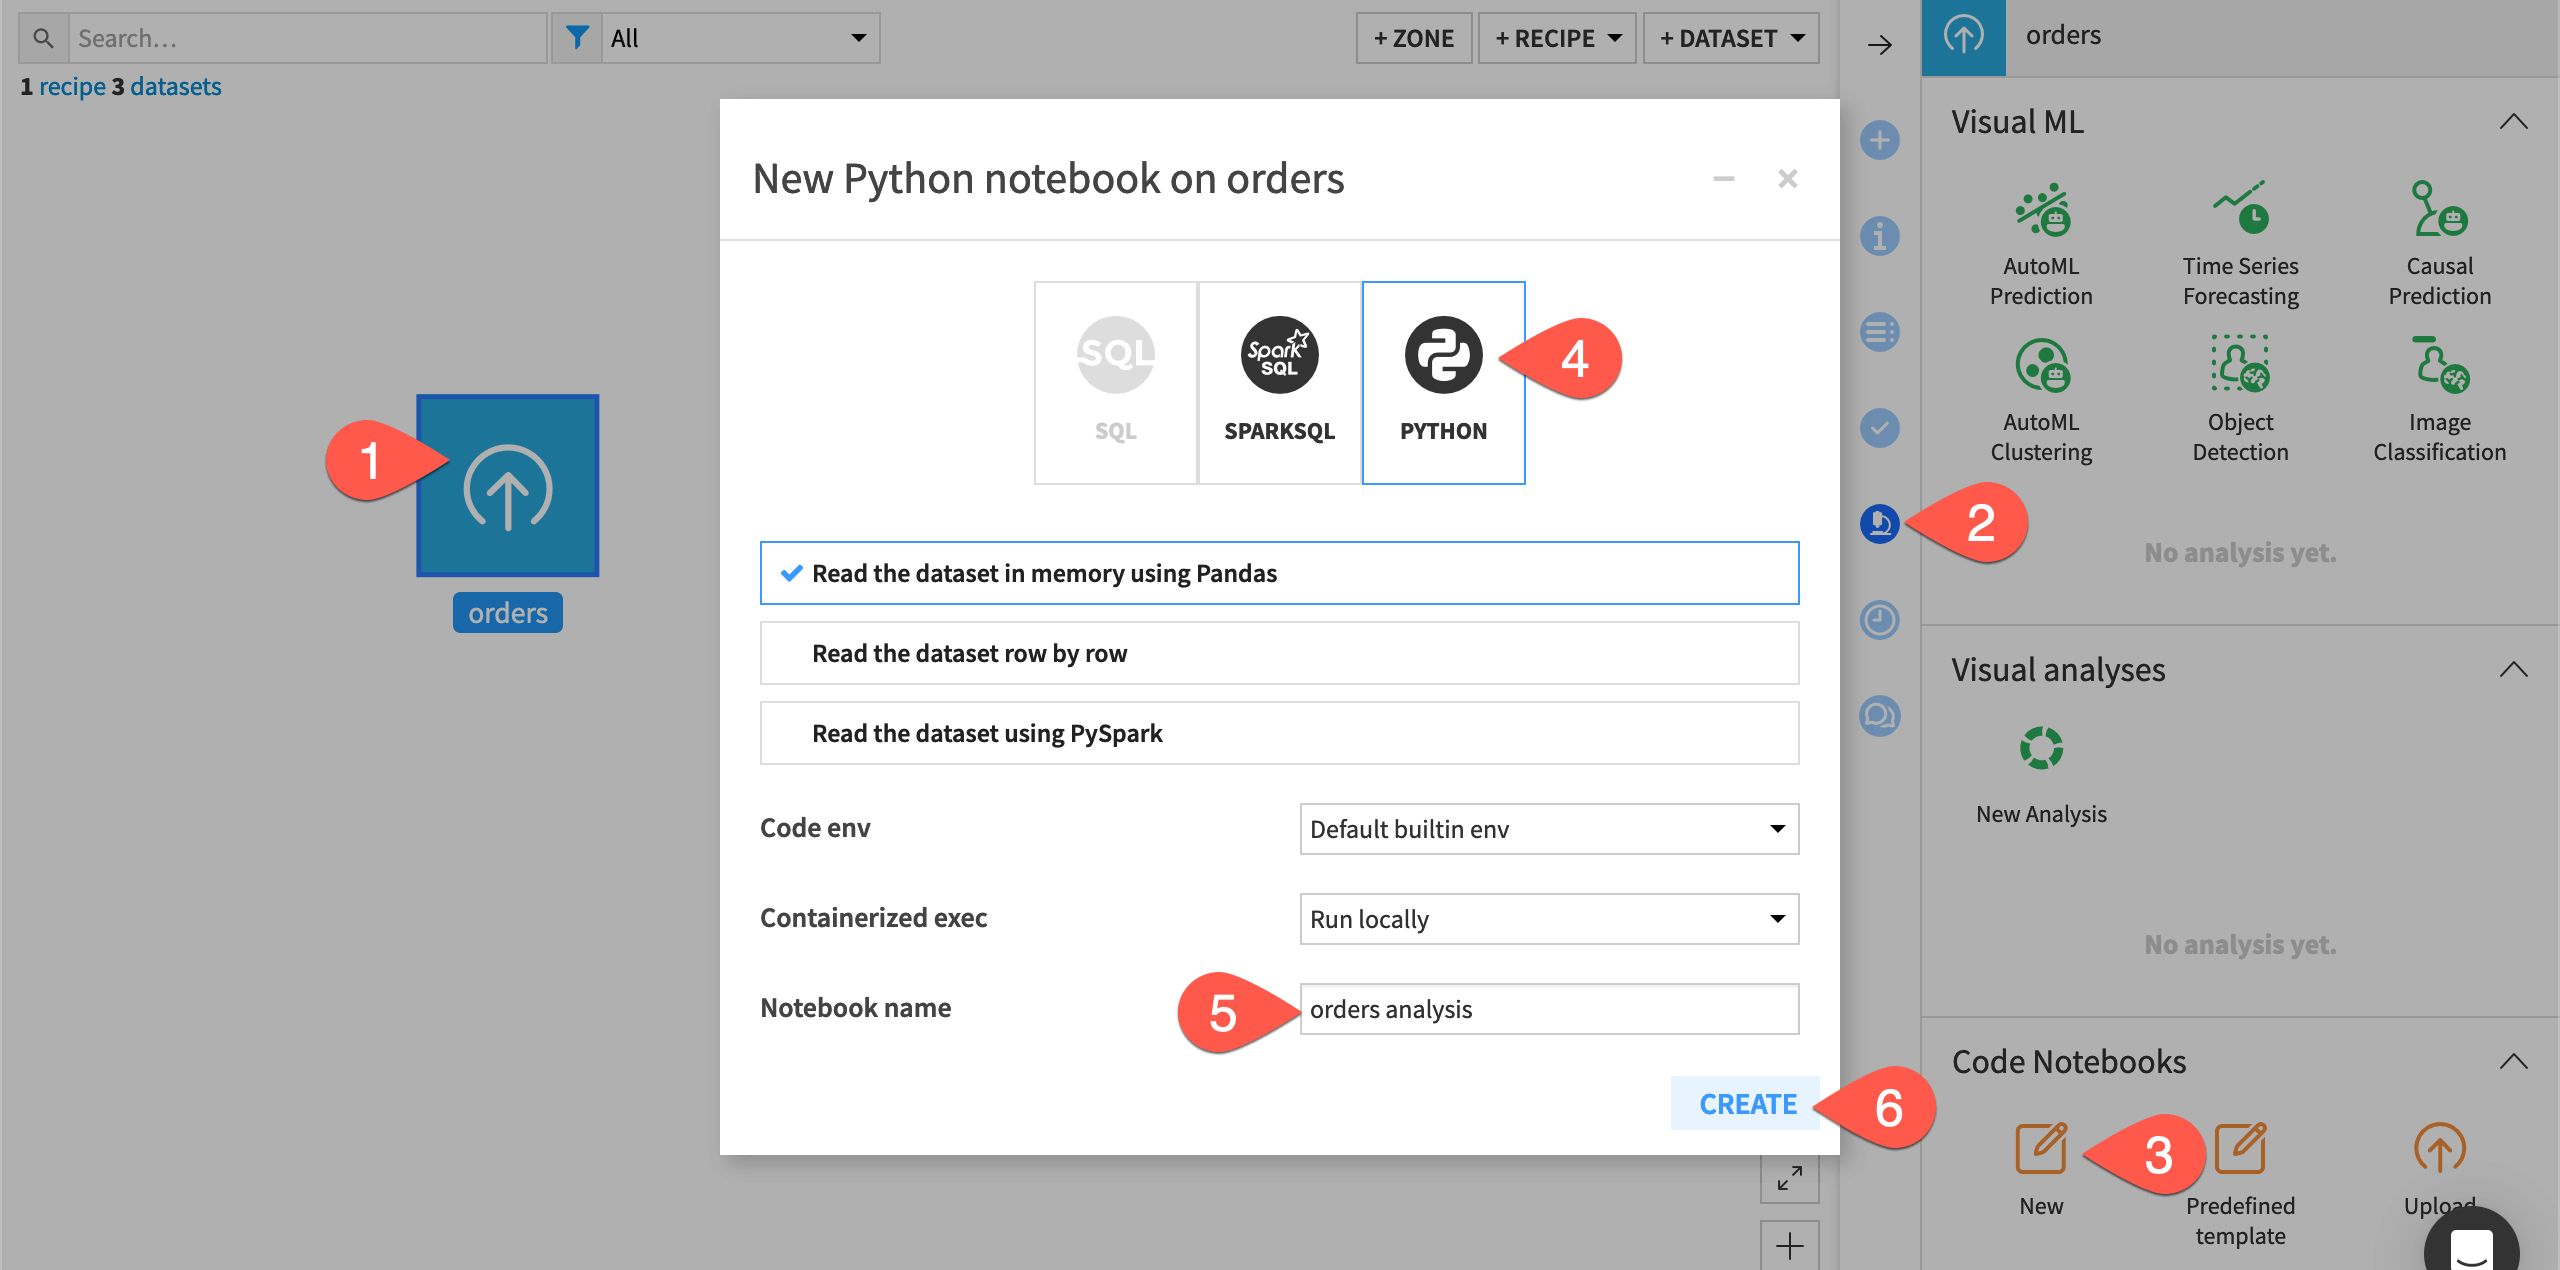
From the Flow, select the orders dataset.
Open the Lab (
 ) tab.
In the Code Notebooks section, click New.
From the notebook options, select Python.
Name the notebook
orders analysis.Click Create, leaving the default option to read the dataset in memory using pandas.
Inspect a notebook’s starter code#
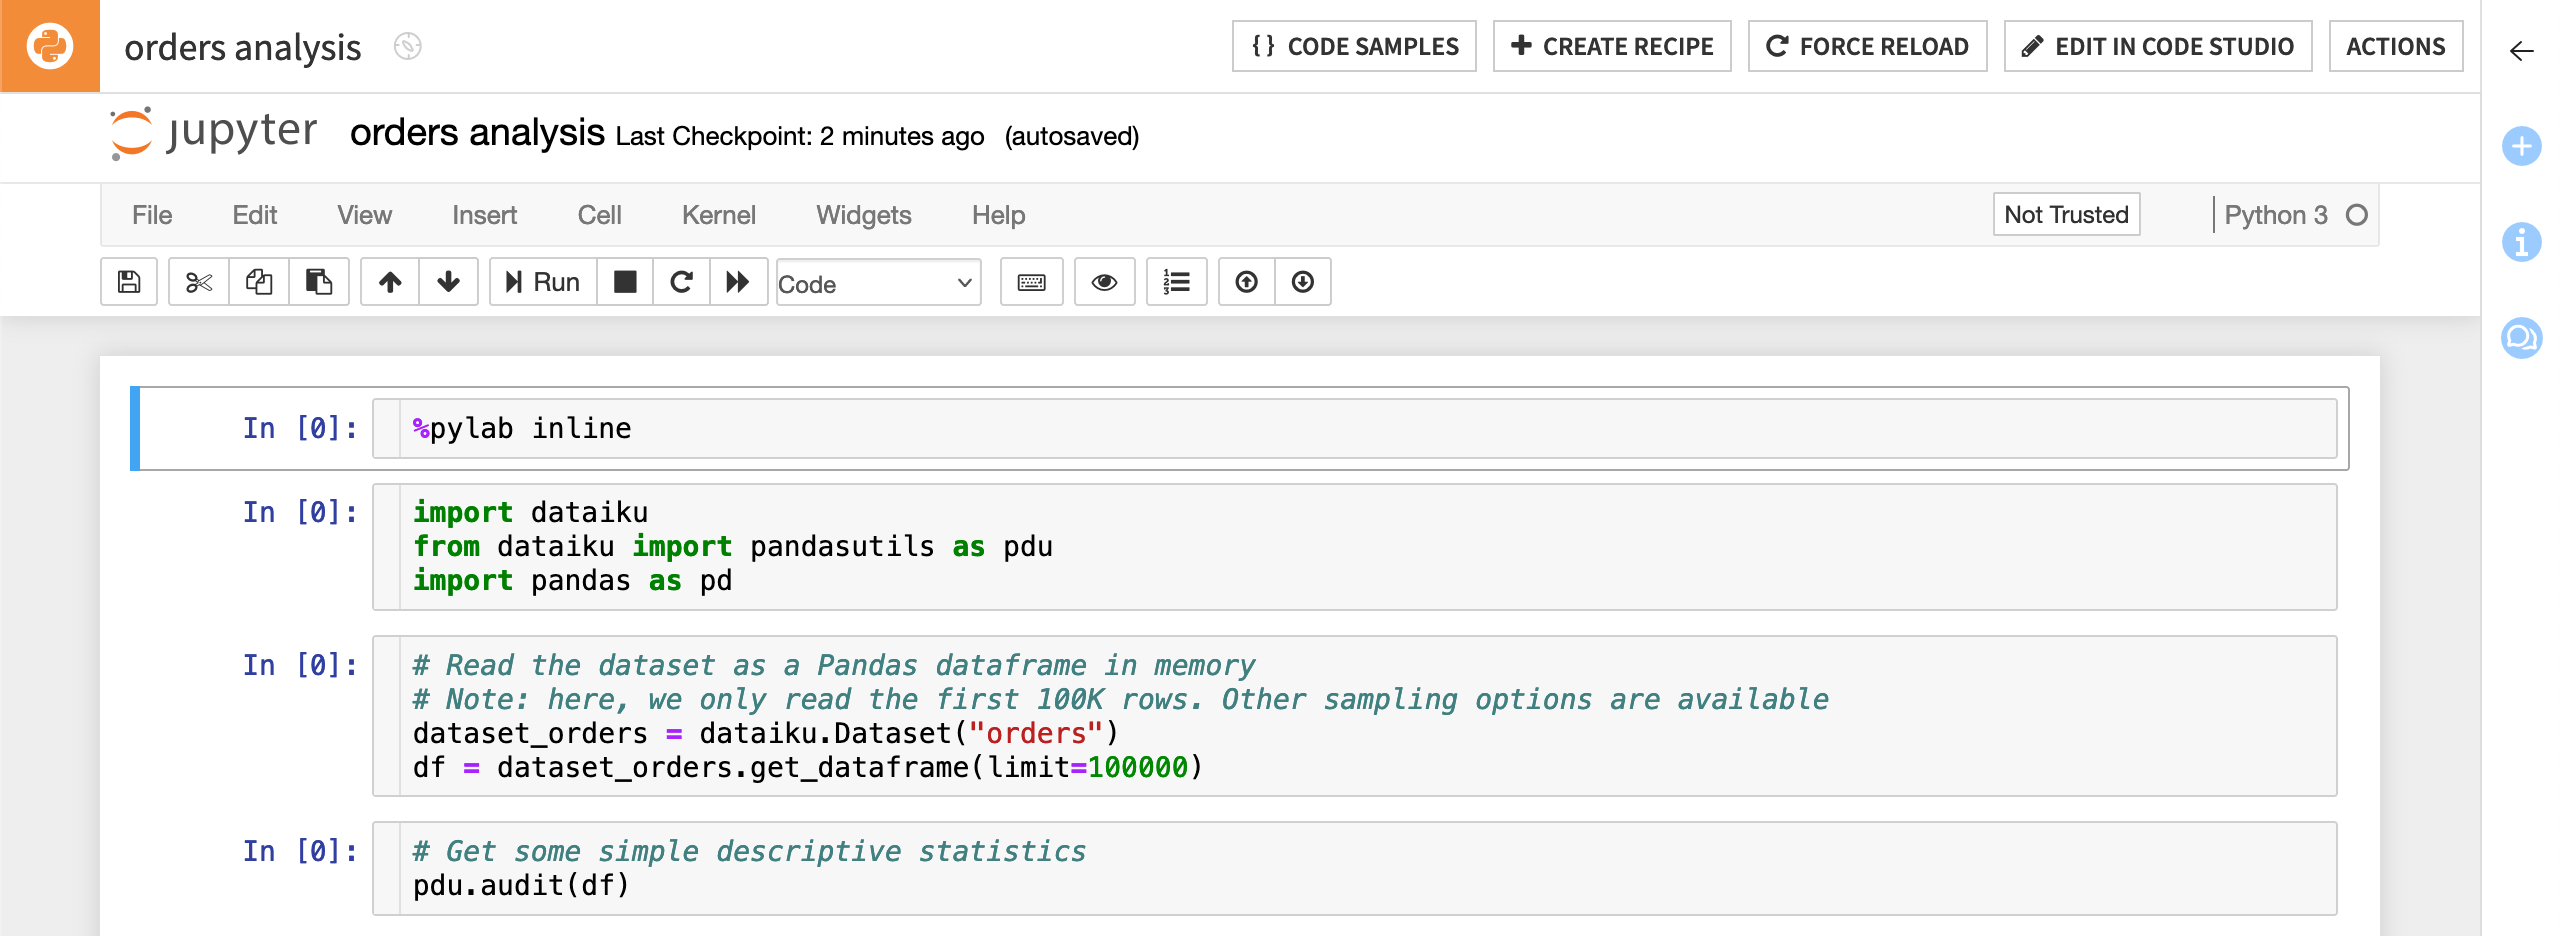
The newly created notebook contains some useful starter code:
The first cell uses the built-in magic commands to import the numpy and matplotlib packages.
The second cell imports other useful packages, including dataiku.
The third cell reads in the orders dataset and converts it to a pandas DataFrame.
The fourth cell contains a function that performs some basic analysis on the columns of the dataset.
Important
The starter code of a notebook created from a dataset will have already read in the chosen dataset to a df variable. This is true whether it may be a pandas, R, or Scala DataFrame.
Edit code in a notebook#
You can edit the starter code as well as write your own code in the same way you would outside of Dataiku.
In this simple exercise, slightly modify the existing starter code:
Delete
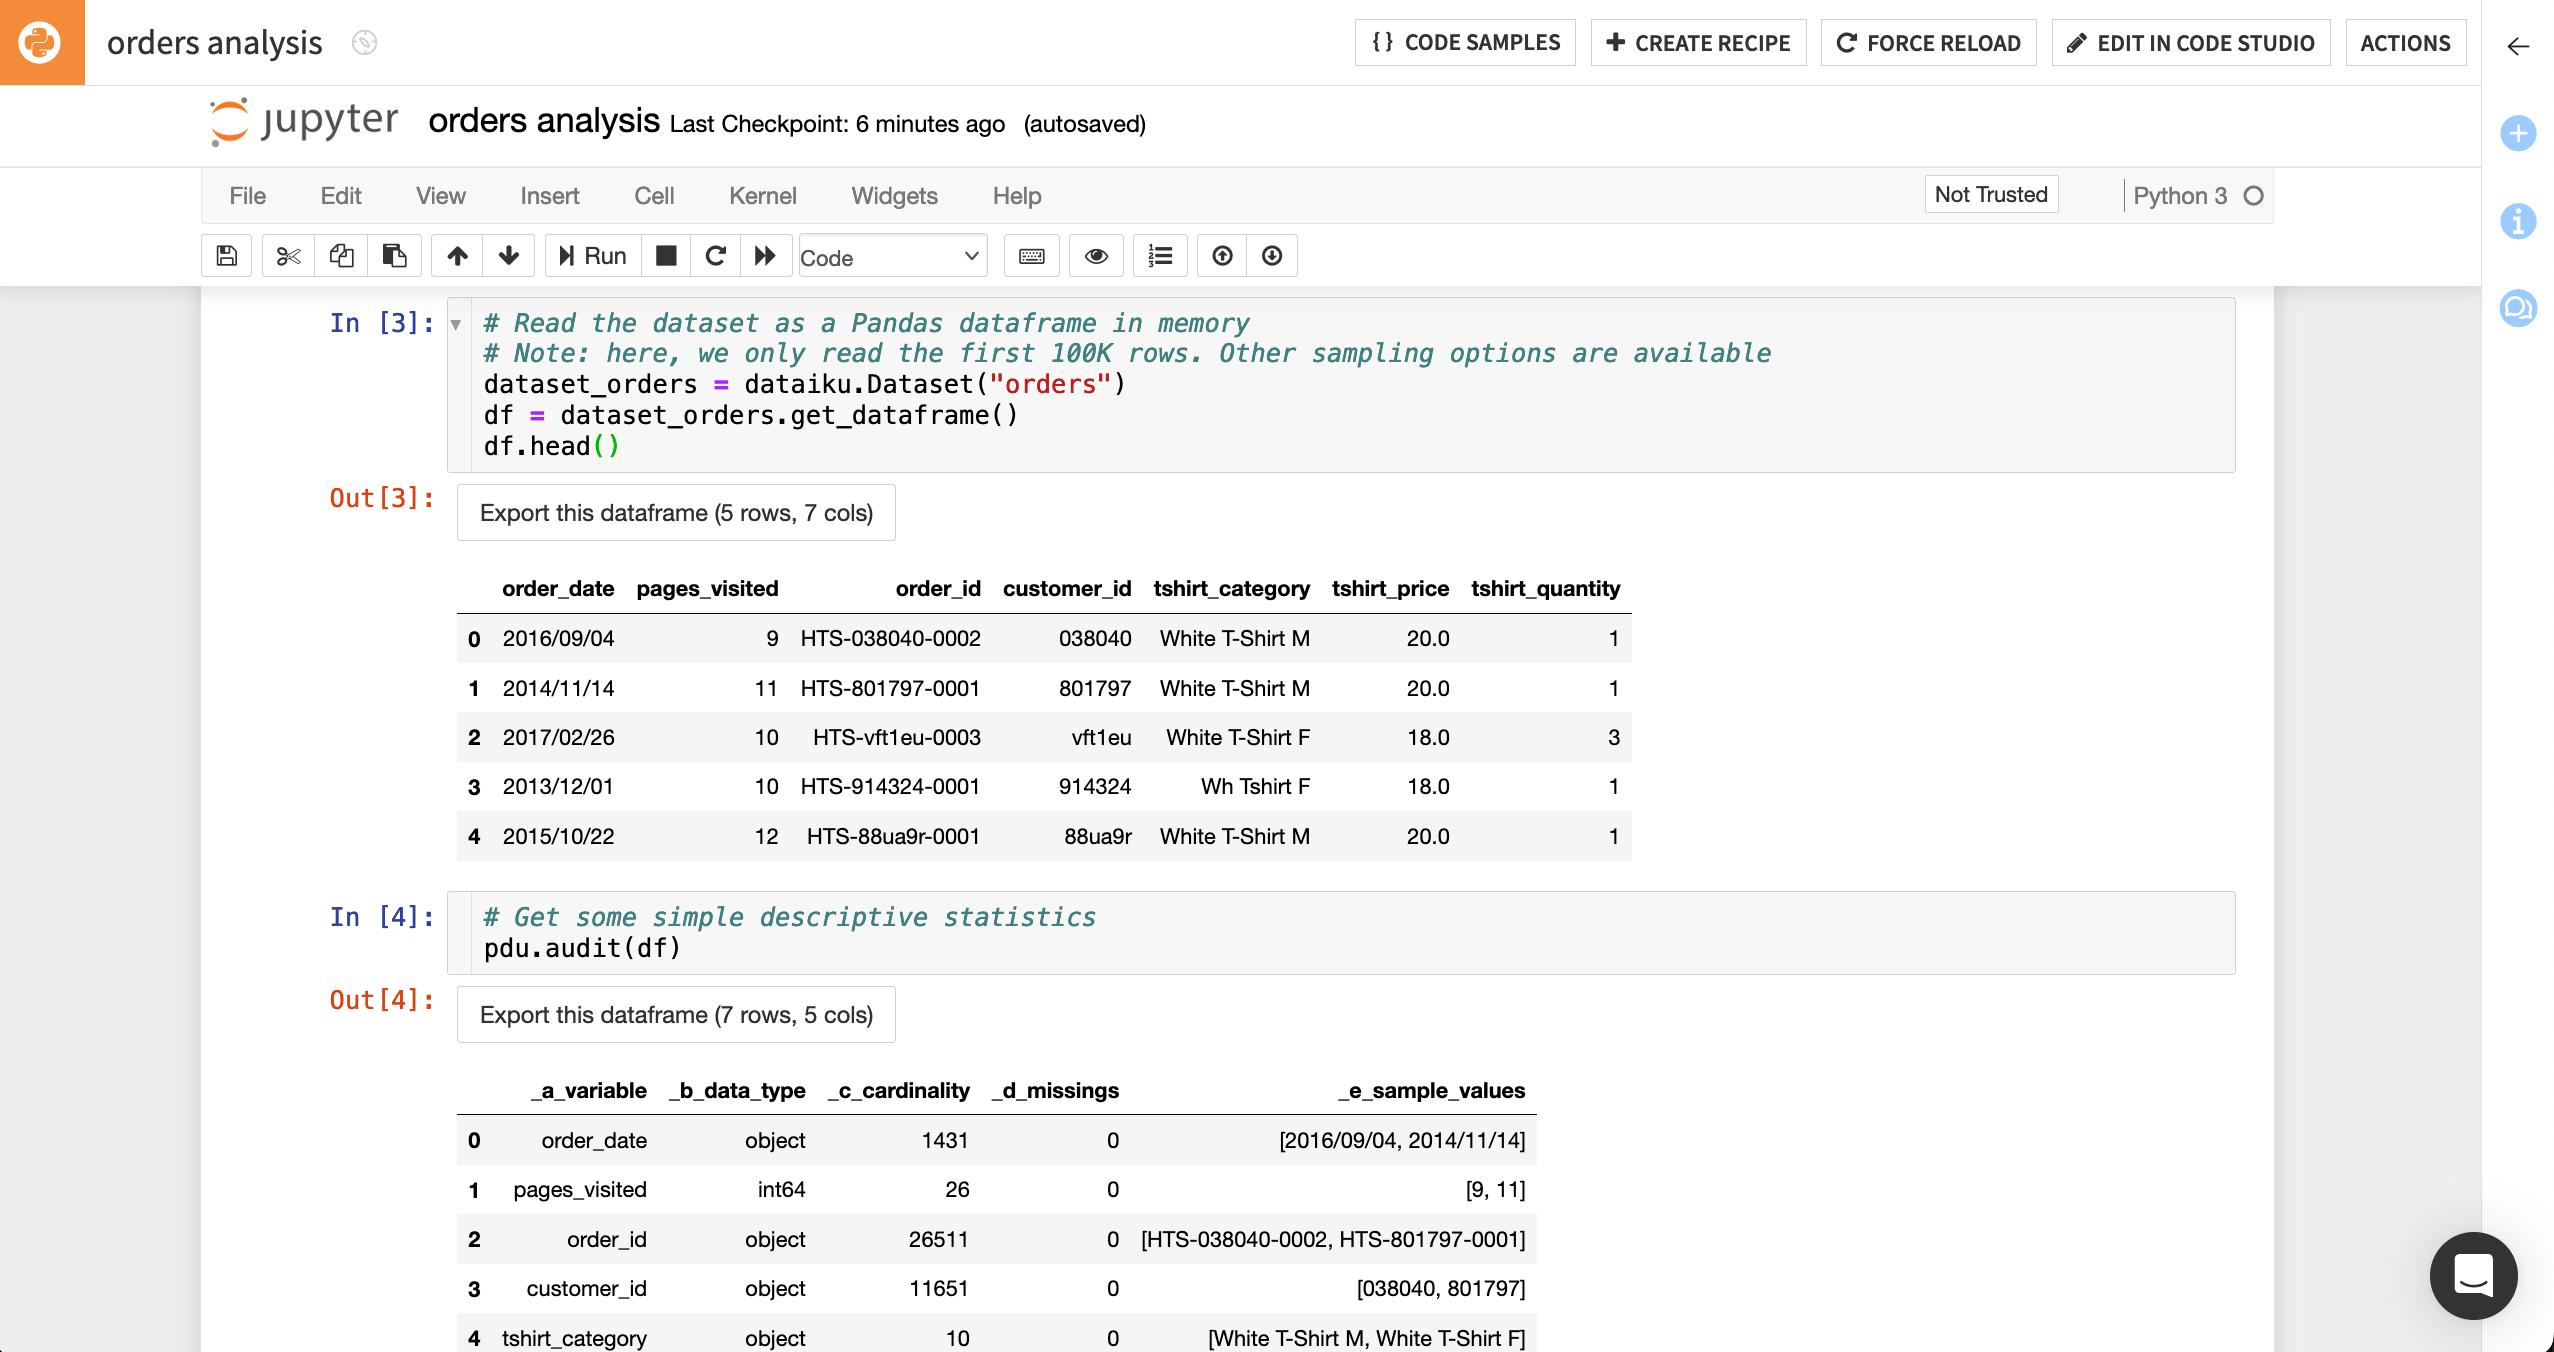
limit=100000from the second line of code in the third cell to remove the default dataset sampling. After removing it, the line of code should look like this:df = dataset_orders.get_dataframe()
Type
df.head()right under the one above. The code in the third cell should now look like this:# Read the dataset as a Pandas DataFrame in memory # Note: here, we only read the first 100K rows. Other sampling options are available dataset_orders = dataiku.Dataset("orders") df = dataset_orders.get_dataframe() df.head()
Run the first three cells to read in the orders dataset and display the first five rows of the dataset.
Run the fourth and last cell (
pdu.audit(df)), which is part of the starter code, to display some basic information about the columns of the orders dataset.Click the Save button (or use the shortcut
Cmd/Ctrl+S) to save your progress.
Note
In addition to datasets, it’s also possible to create Jupyter notebooks from machine learning models. For more information, consult the reference documentation.
Publish a notebook to a dashboard#
For a collaborative platform like Dataiku, the ability to share work and analyses is of high importance. Dataiku allows you to save static exports (non-interactive snapshots) of Jupyter notebooks in an HTML format, which you can share on dashboards.
To share the notebook on a dashboard:
Open the Actions tab of the notebook.
Click Publish > Dashboard.
Click Create to create the notebook as an insight and publish that insight to the first page of the project’s default dashboard.
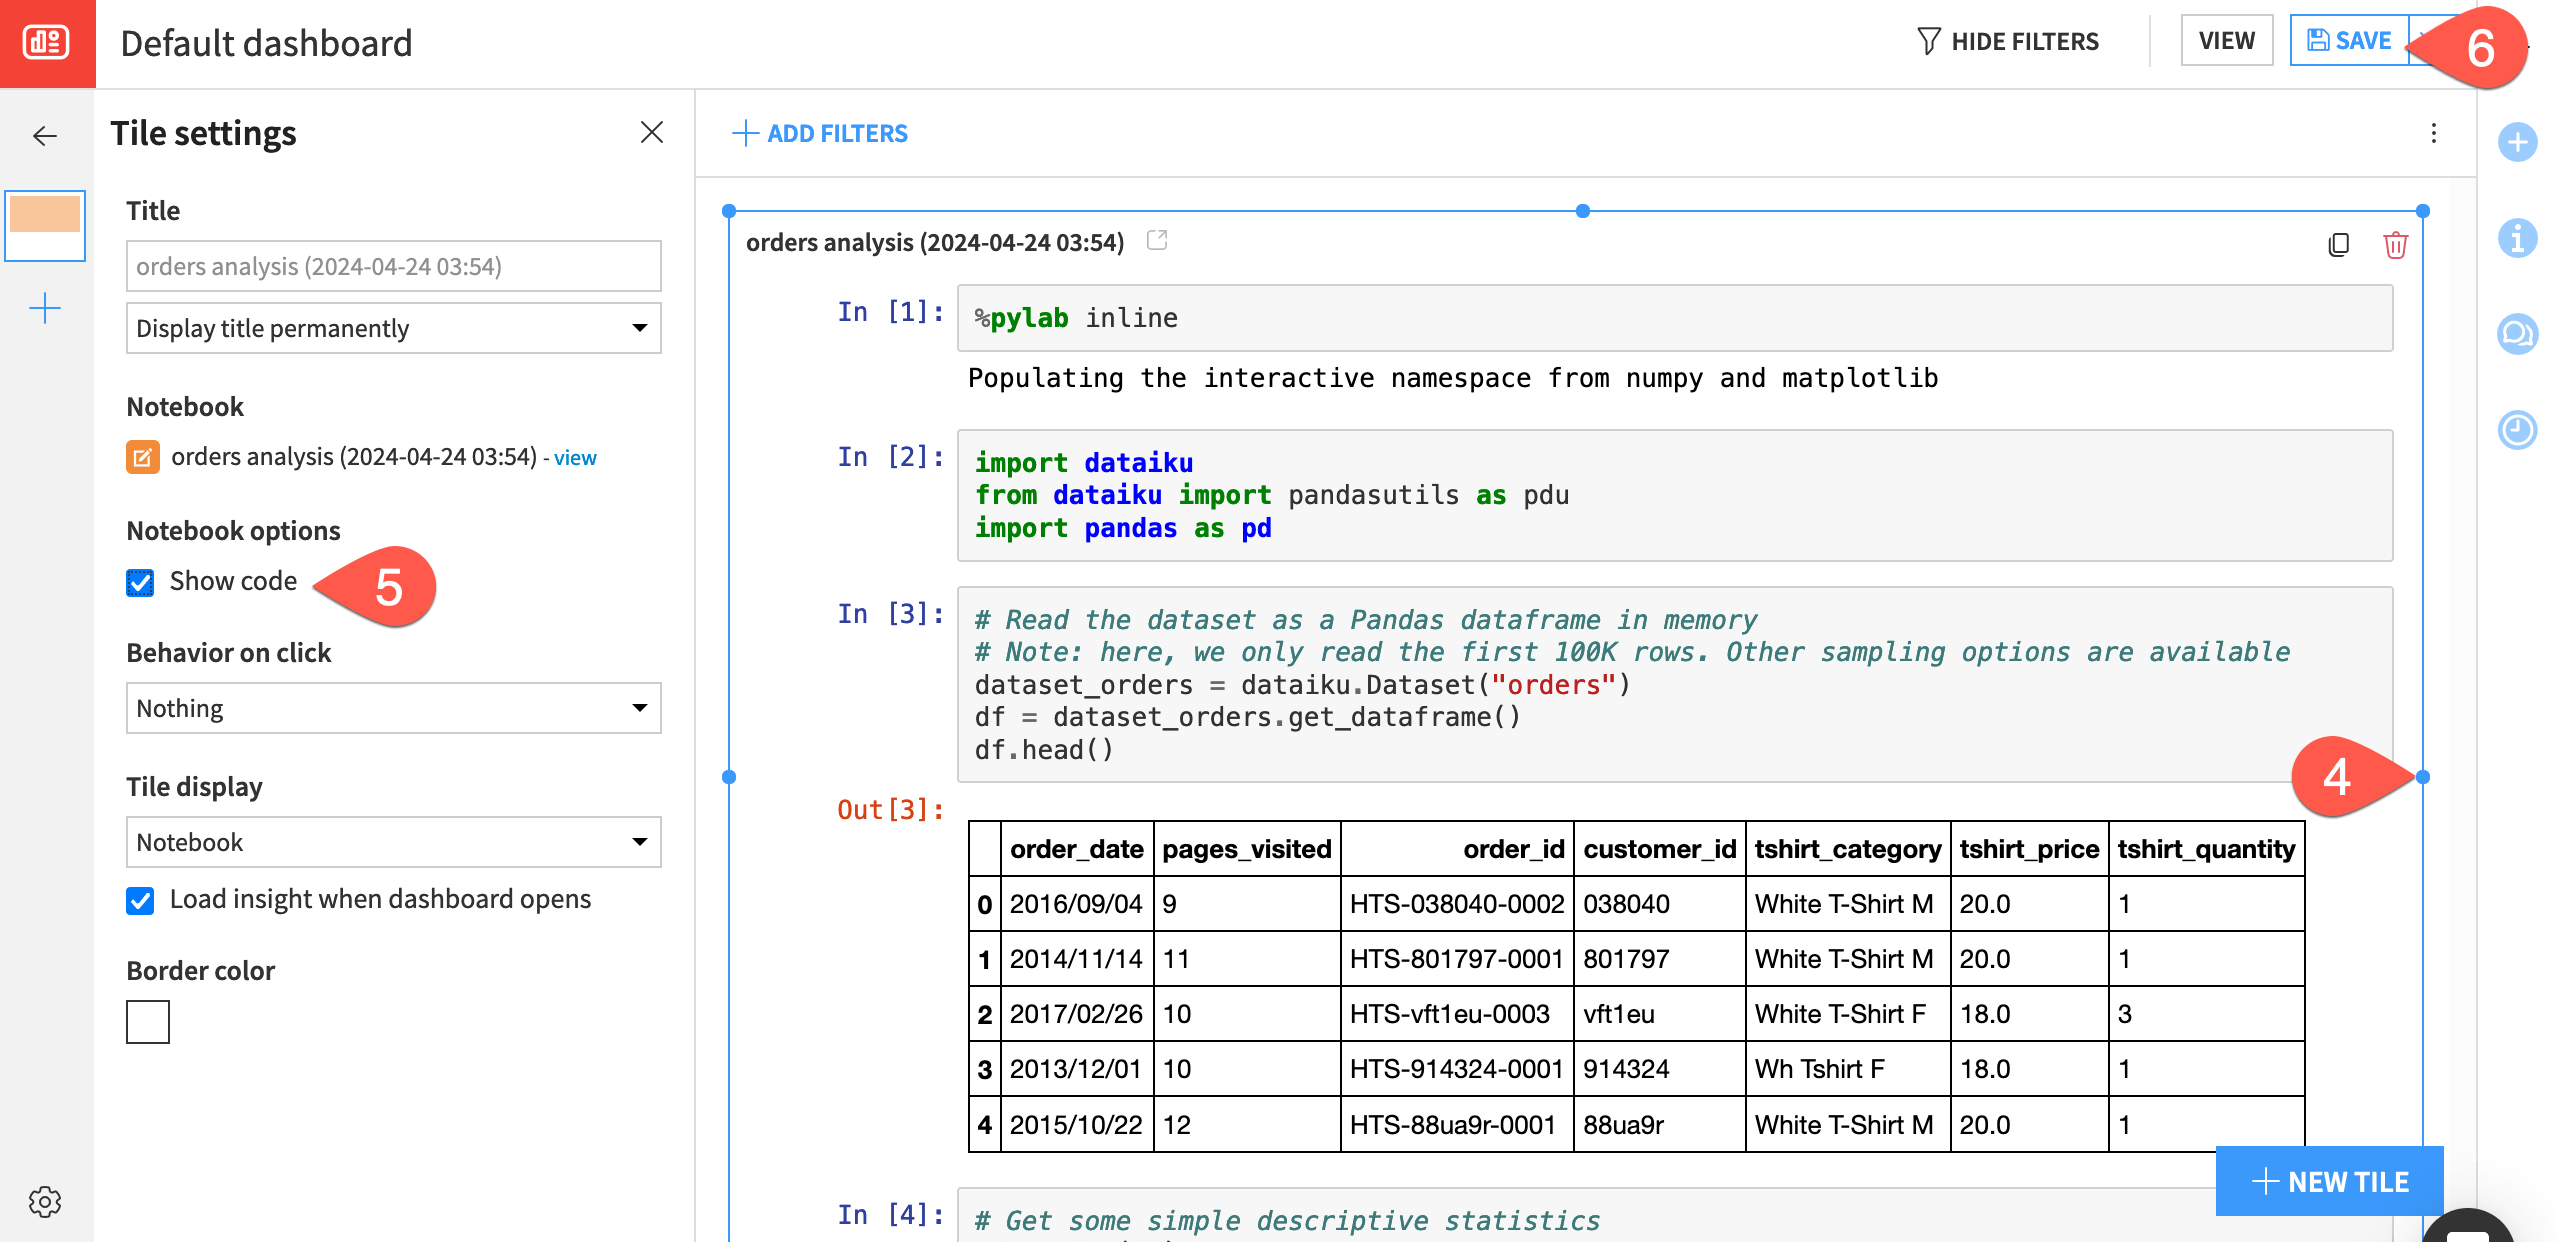
In the dashboard, expand the notebook tile by dragging the corners of the insight.
In the Tile settings, click Show code to include the code and not just the printed output.
Click Save and then View to see how the notebook insight appears on the dashboard.
Note
Publishing a static snapshot of a notebook to a dashboard also adds it to the list of saved insights. To learn more about sharing Jupyter notebooks as insights, see the reference documentation.
Unload a notebook#
Finally, once you’re done working in a Jupyter notebook for the time being, you can optimize its computational efficiency by killing the kernel. To do this:
From the Code (
 ) menu, navigate to the Notebooks page (
g+n).Check the box to select the orders analysis notebook.
In the Actions (
 ) tab, click Unload to kill the kernel.
Use a code recipe#
Code notebooks allow for free experimentation, but you’ll need code recipes to build outputs in your Flow.
Create a recipe from a notebook#
You can create Code recipes from scratch directly from the Flow. However, you can also create them from existing notebooks. This can be particularly useful for deploying exploratory work from notebooks to the Flow.
Let’s create a Python code recipe from the Jupyter notebook.
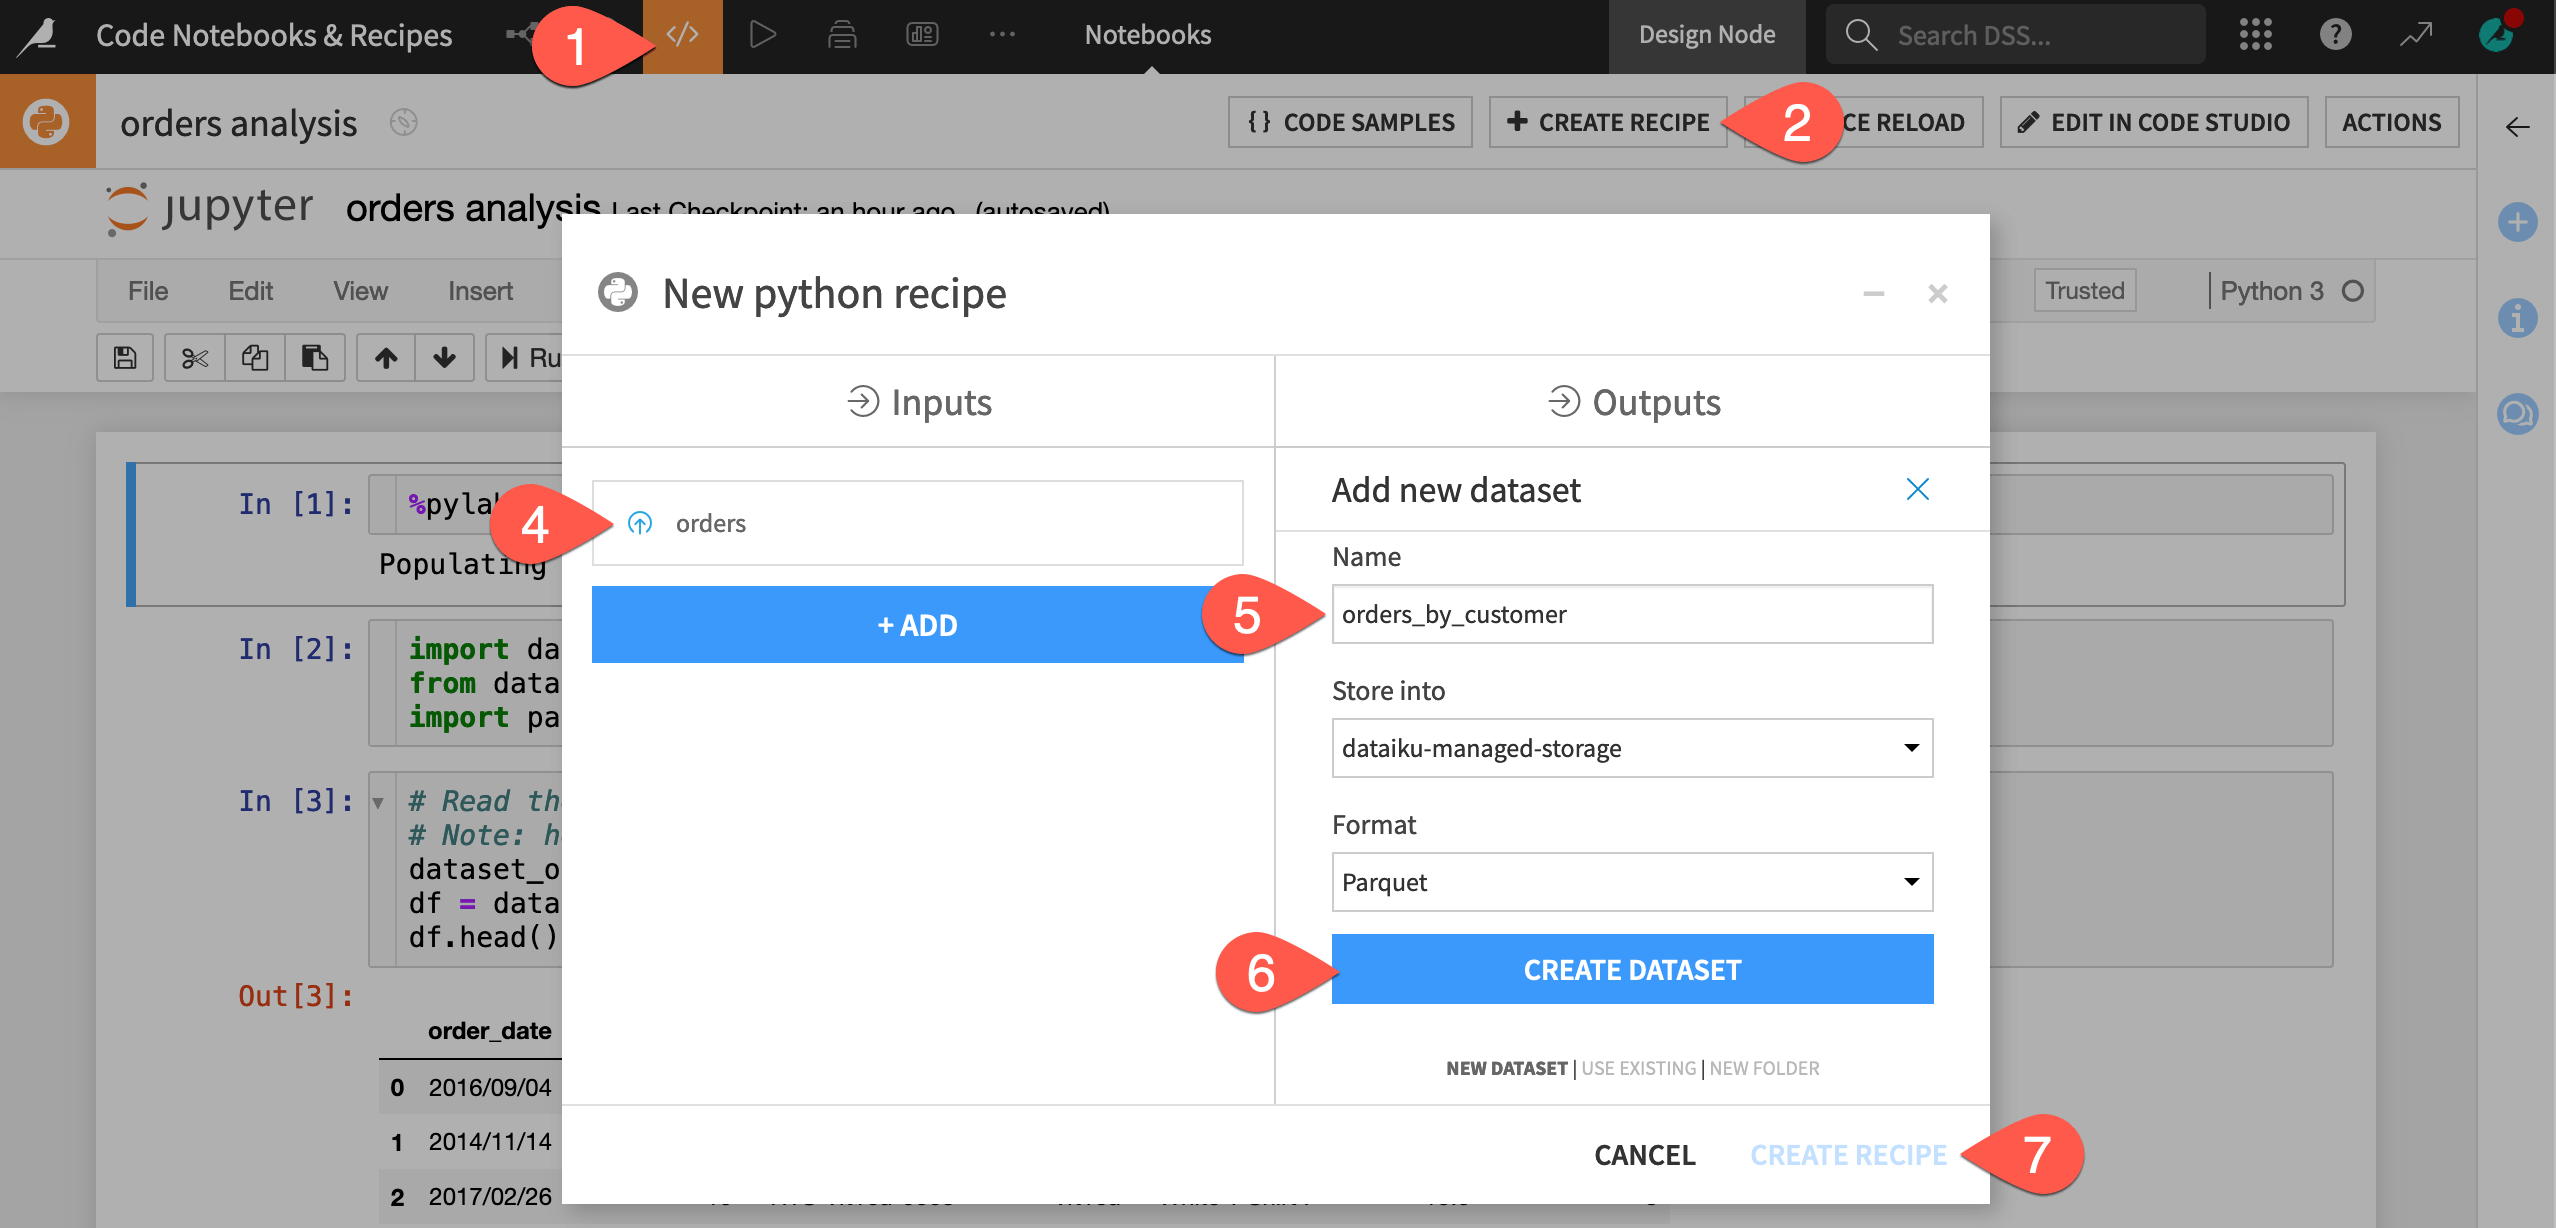
Navigate to the Notebooks page (
g+n), and open the orders analysis Python notebook.Within the notebook’s header, click + Create Recipe.
Verify Python recipe is selected, and click OK to confirm.
Verify the orders dataset is selected as the input (since that’s the dataset used in the notebook).
Under Outputs, click + Add. Name it
orders_by_customer.Click Create Dataset.
Click Create Recipe.
Edit code in a recipe#
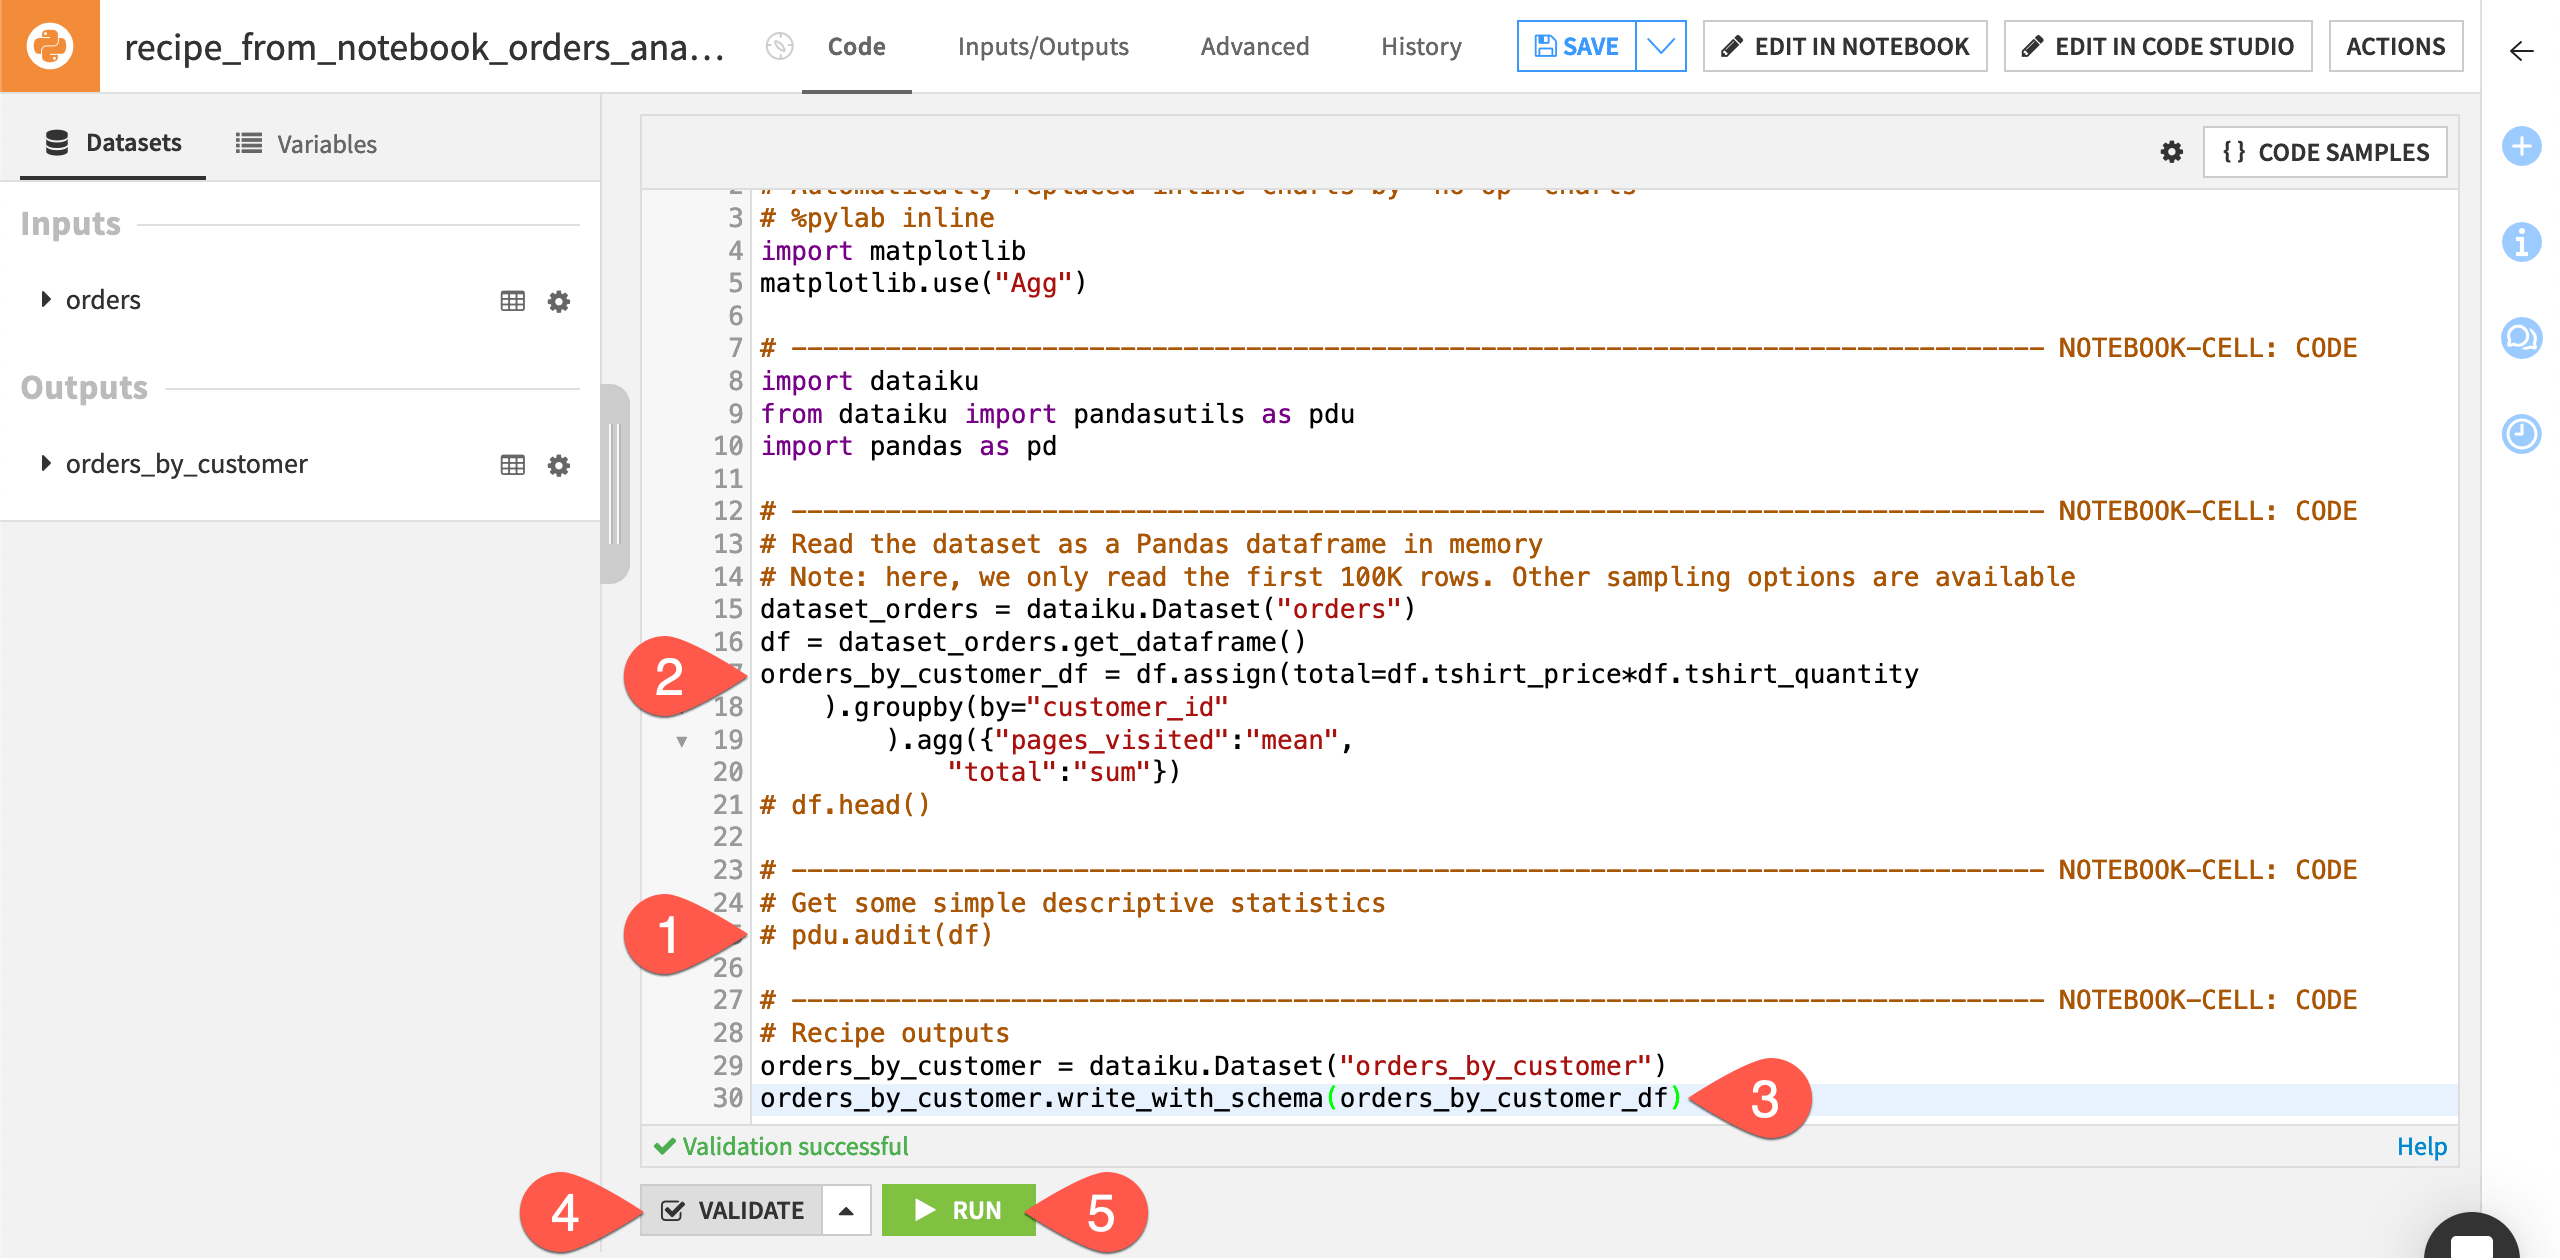
In the resulting recipe, all the code from the Jupyter notebook has been transferred to the recipe code editor. Notice that Dataiku has added a number of commented out lines, each of which shows the beginning of a notebook cell. This way, if you need to edit the recipe in a notebook again, you existing cells remain.
The editor has also added two lines for the recipe output based on the name of the output dataset created in the recipe dialog. We’ll discuss this below.
Now let’s group the orders data by unique customers. Although you could accomplish this with a visual Group recipe, you can also use code.
Comment out the following lines of code:
df.head()pdu.audit(df)
In a new line below
df = dataset_orders.get_dataframe(), copy-paste the following code:orders_by_customer_df = df.assign(total=df.tshirt_price*df.tshirt_quantity ).groupby(by="customer_id" ).agg({"pages_visited":"mean", "total":"sum"})
Tip
This code block creates a new DataFrame with rows grouped by customer_id. For each customer, the code has computed:
The average number of pages on the Haiku T-shirt website visited by the customer during orders, and
The sum total of the value of orders made by the customer, where the value of each order is the price of each t-shirt multiplied by the number of t-shirts purchased.
Finally, Dataiku has added lines for the recipe output. However, it can’t know which DataFrame (df or orders_by_customer_df) we want to output as the orders_by_customer dataset. Accordingly:
In the last line of code, change pandas_dataframe to
orders_by_customer_df.Click Validate to check the validity of the code. It should display Validation successful.
Click Run (or type
@+r+u+n) to execute the recipe, and then explore the output dataset.
Iterate between a recipe and a notebook#
Notice that the output dataset orders_by_customer doesn’t contain the customer_id column, even though this was the group by key. Imagine you’d like to have it for reference.
Let’s prototype the revised code in the notebook attached to the recipe.
Reopen the Python recipe (clicking Parent Recipe is one option).
In the header, click Edit in Notebook.
Click Override Notebook Content.
Important
Previously, you edited the recipe without saving the changes back to the recipe, creating this mismatch. Overriding the notebook content re-syncs the recipe and notebook.
Now, you can interactively test the recipe code in a notebook.
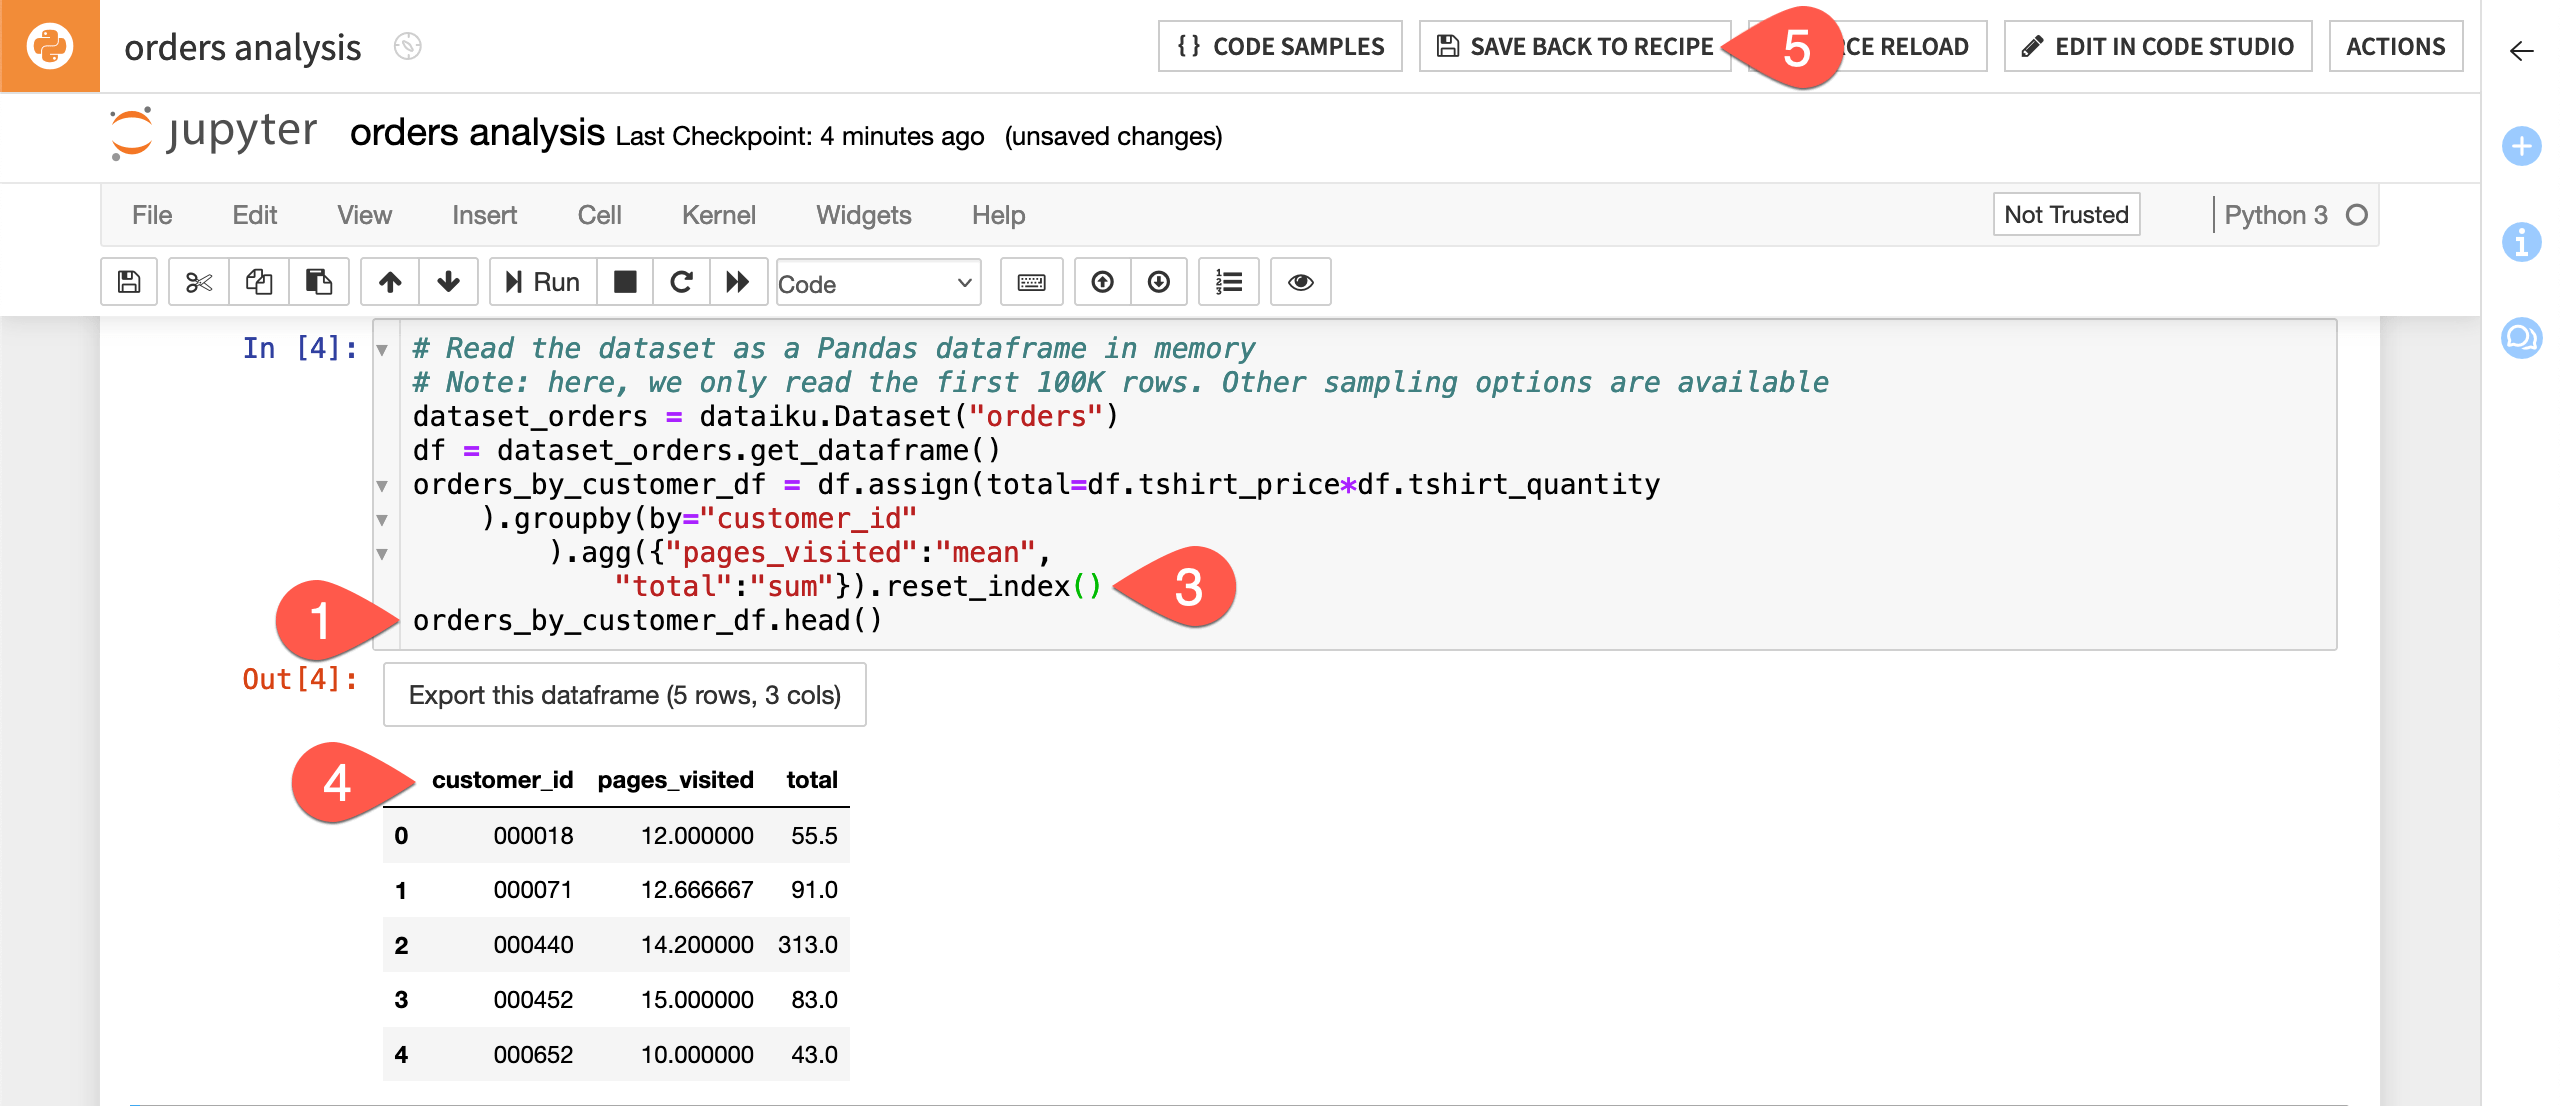
Uncomment the
df.head()line and changedftoorders_by_customer_df, so that the new line is as follows:orders_by_customer_df.head()
Run the first three cells. The output shows that the orders_by_customer_df DataFrame has the customer_id information; however, the DataFrame has a hierarchical index.
To flatten the index, add
.reset_index()to the code that defines the DataFrame so that it looks like the following:orders_by_customer_df = df.assign(total=df.tshirt_price*df.tshirt_quantity ).groupby(by="customer_id" ).agg({"pages_visited":"mean", "total":"sum"}).reset_index()
Re-run the third cell to see how the DataFrame has changed.
In the header, click Save Back to Recipe.
Comment out
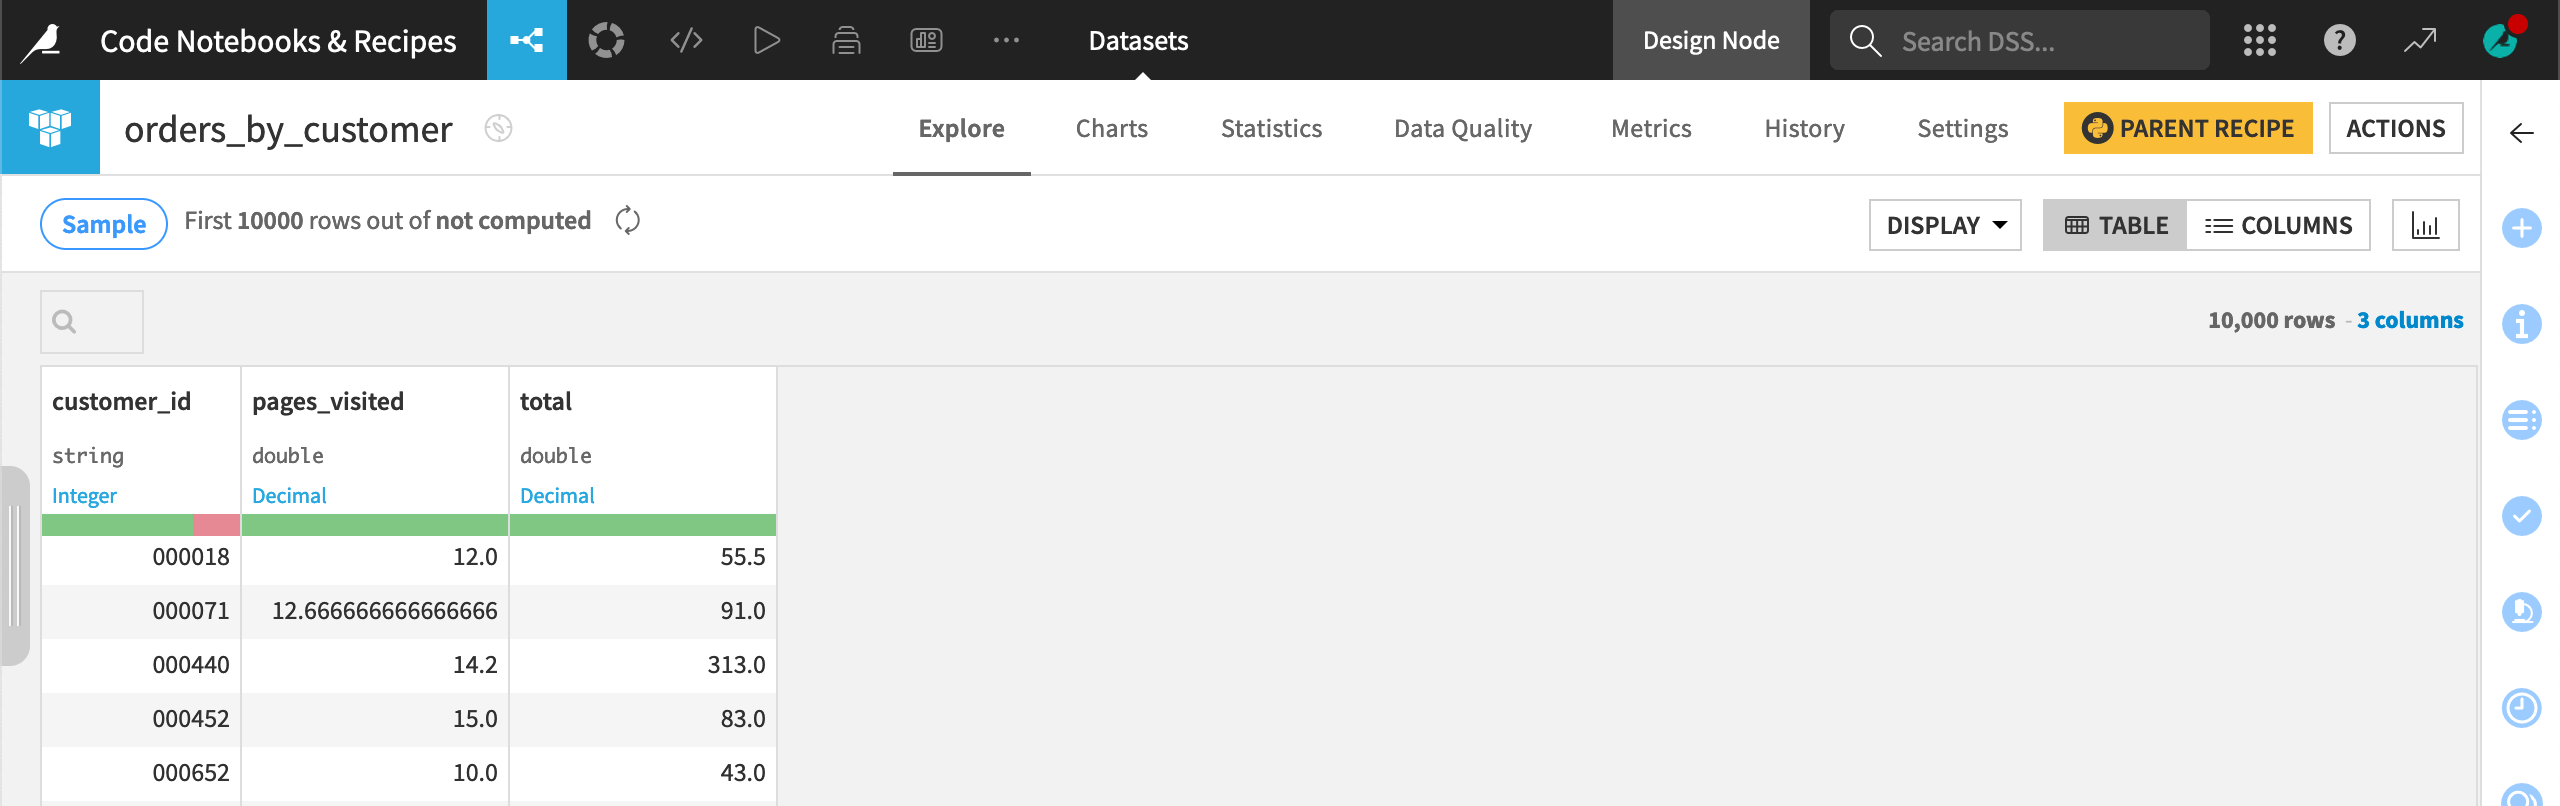
orders_by_customer_df.head(), Validate, and Run the recipe again.
Now the output dataset contains a customer_id column.
Next steps#
This tutorial used the built-in code environment, but often you’ll want to use your own. Learn about code environments in How-to | Create a code environment!
See also
To learn more, see the reference documentation on Code notebooks and Code recipes.
To start using Dataiku features as a coder, you can reach Tutorials in the Developer Guide.