
Tutorial | Data quality#
Get started#
Data quality rules allow you to ensure that your data meets quality standards, and to view data quality information at the dataset, project, and instance levels. Metrics are a quick way to check metadata on your dataset.
Let’s see how these work!
Objectives#
In this tutorial you will:
Create metrics on a dataset.
Set up data quality rules on a dataset.
Monitor data quality at the dataset, project, and instance levels.
Prerequisites#
To reproduce the steps in this tutorial, you’ll need:
Dataiku 13.5 or later.
Basic knowledge of Dataiku (Core Designer level or equivalent).
Create the project#
From the Dataiku Design homepage, click + New Project.
Select Learning projects.
Search for and select Data Quality.
If needed, change the folder into which the project will be installed, and click Create.
From the project homepage, click Go to Flow (or type
g+f).
Note
You can also download the starter project from this website and import it as a ZIP file.
You’ll next want to build the Flow.
Click Flow Actions at the bottom right of the Flow.
Click Build all.
Keep the default settings and click Build.
Use case summary#
The project has three data sources:
Dataset |
Description |
|---|---|
tx |
Each row is a unique credit card transaction with information such as the card that was used and the merchant where the transaction was made. It also indicates whether the transaction has either been:
|
merchants |
Each row is a unique merchant with information such as the merchant’s location and category. |
cards |
Each row is a unique credit card ID with information such as the card’s activation month or the cardholder’s FICO score (a common measure of creditworthiness in the US). |
Compute and view metrics#
Start by computing the default metrics already available for the tx_prepared dataset.
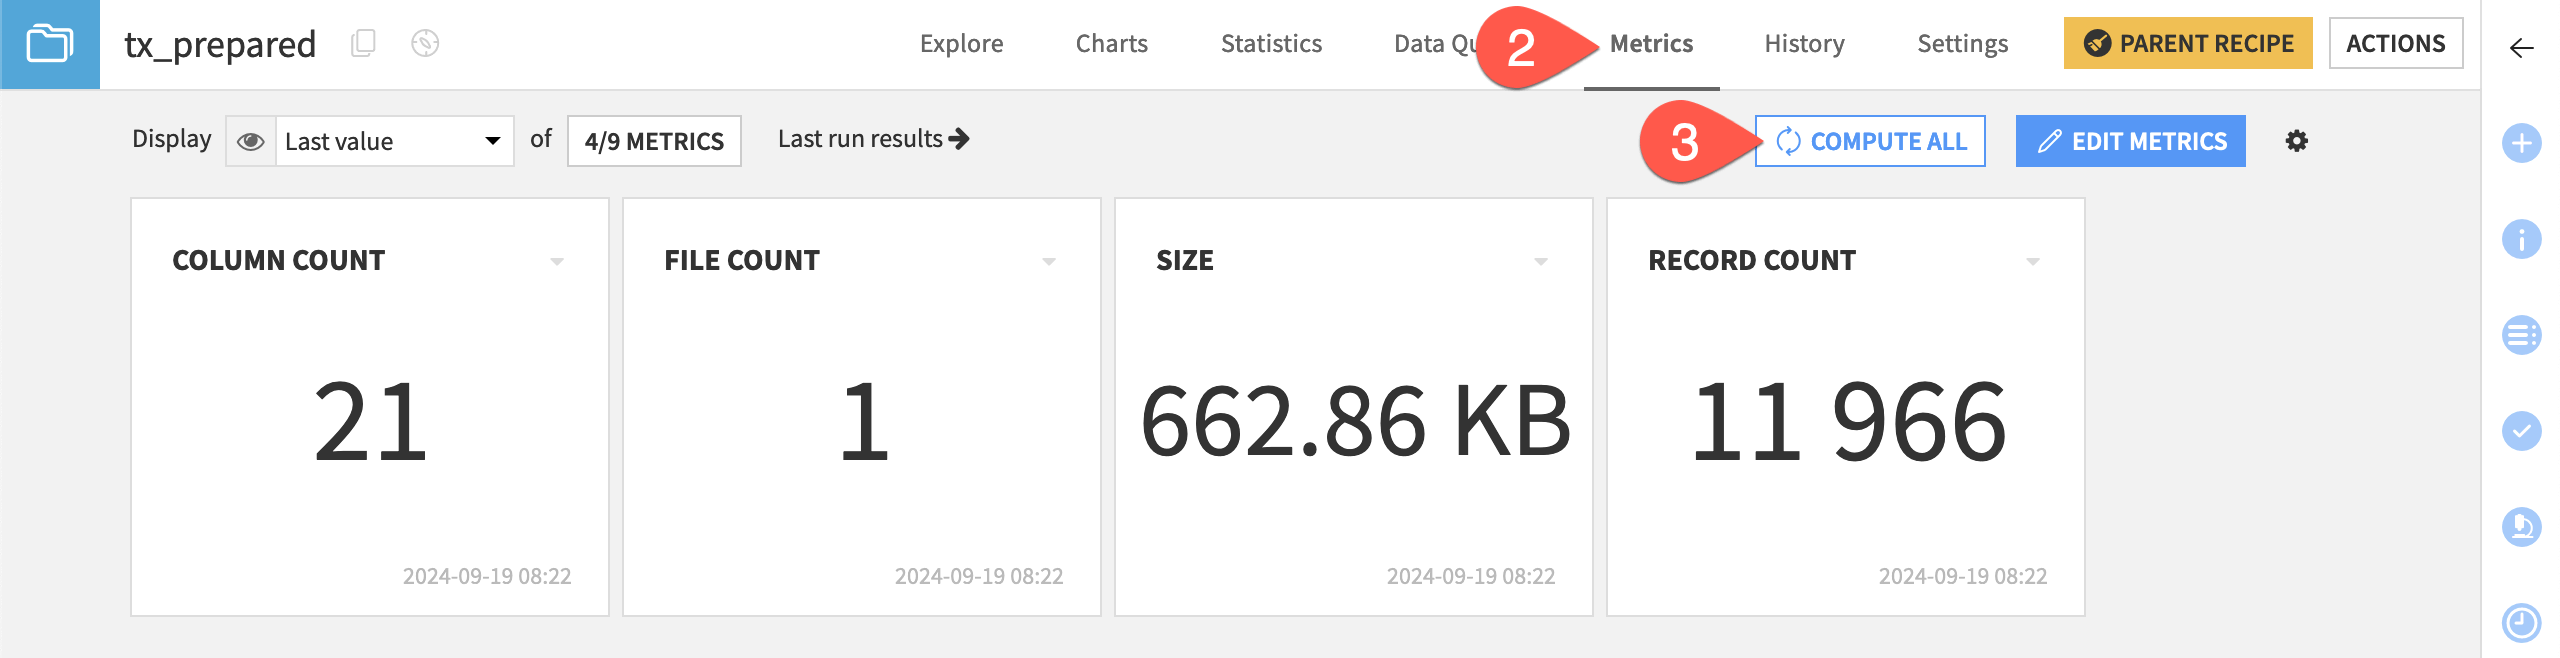
Open the tx_prepared dataset.
Navigate to the Metrics tab.
Click Compute All to calculate the default metrics such as column count and record count.
Create custom metrics#
In addition to these default metrics, you can also natively configure many more kinds of metrics on properties such as the dataset’s statistics, most frequent values, percentiles, and meaning validity.
For instance, the values of the authorized_flag column should always be 0 or 1. You can create custom min and max metrics on the column to verify this expectation.
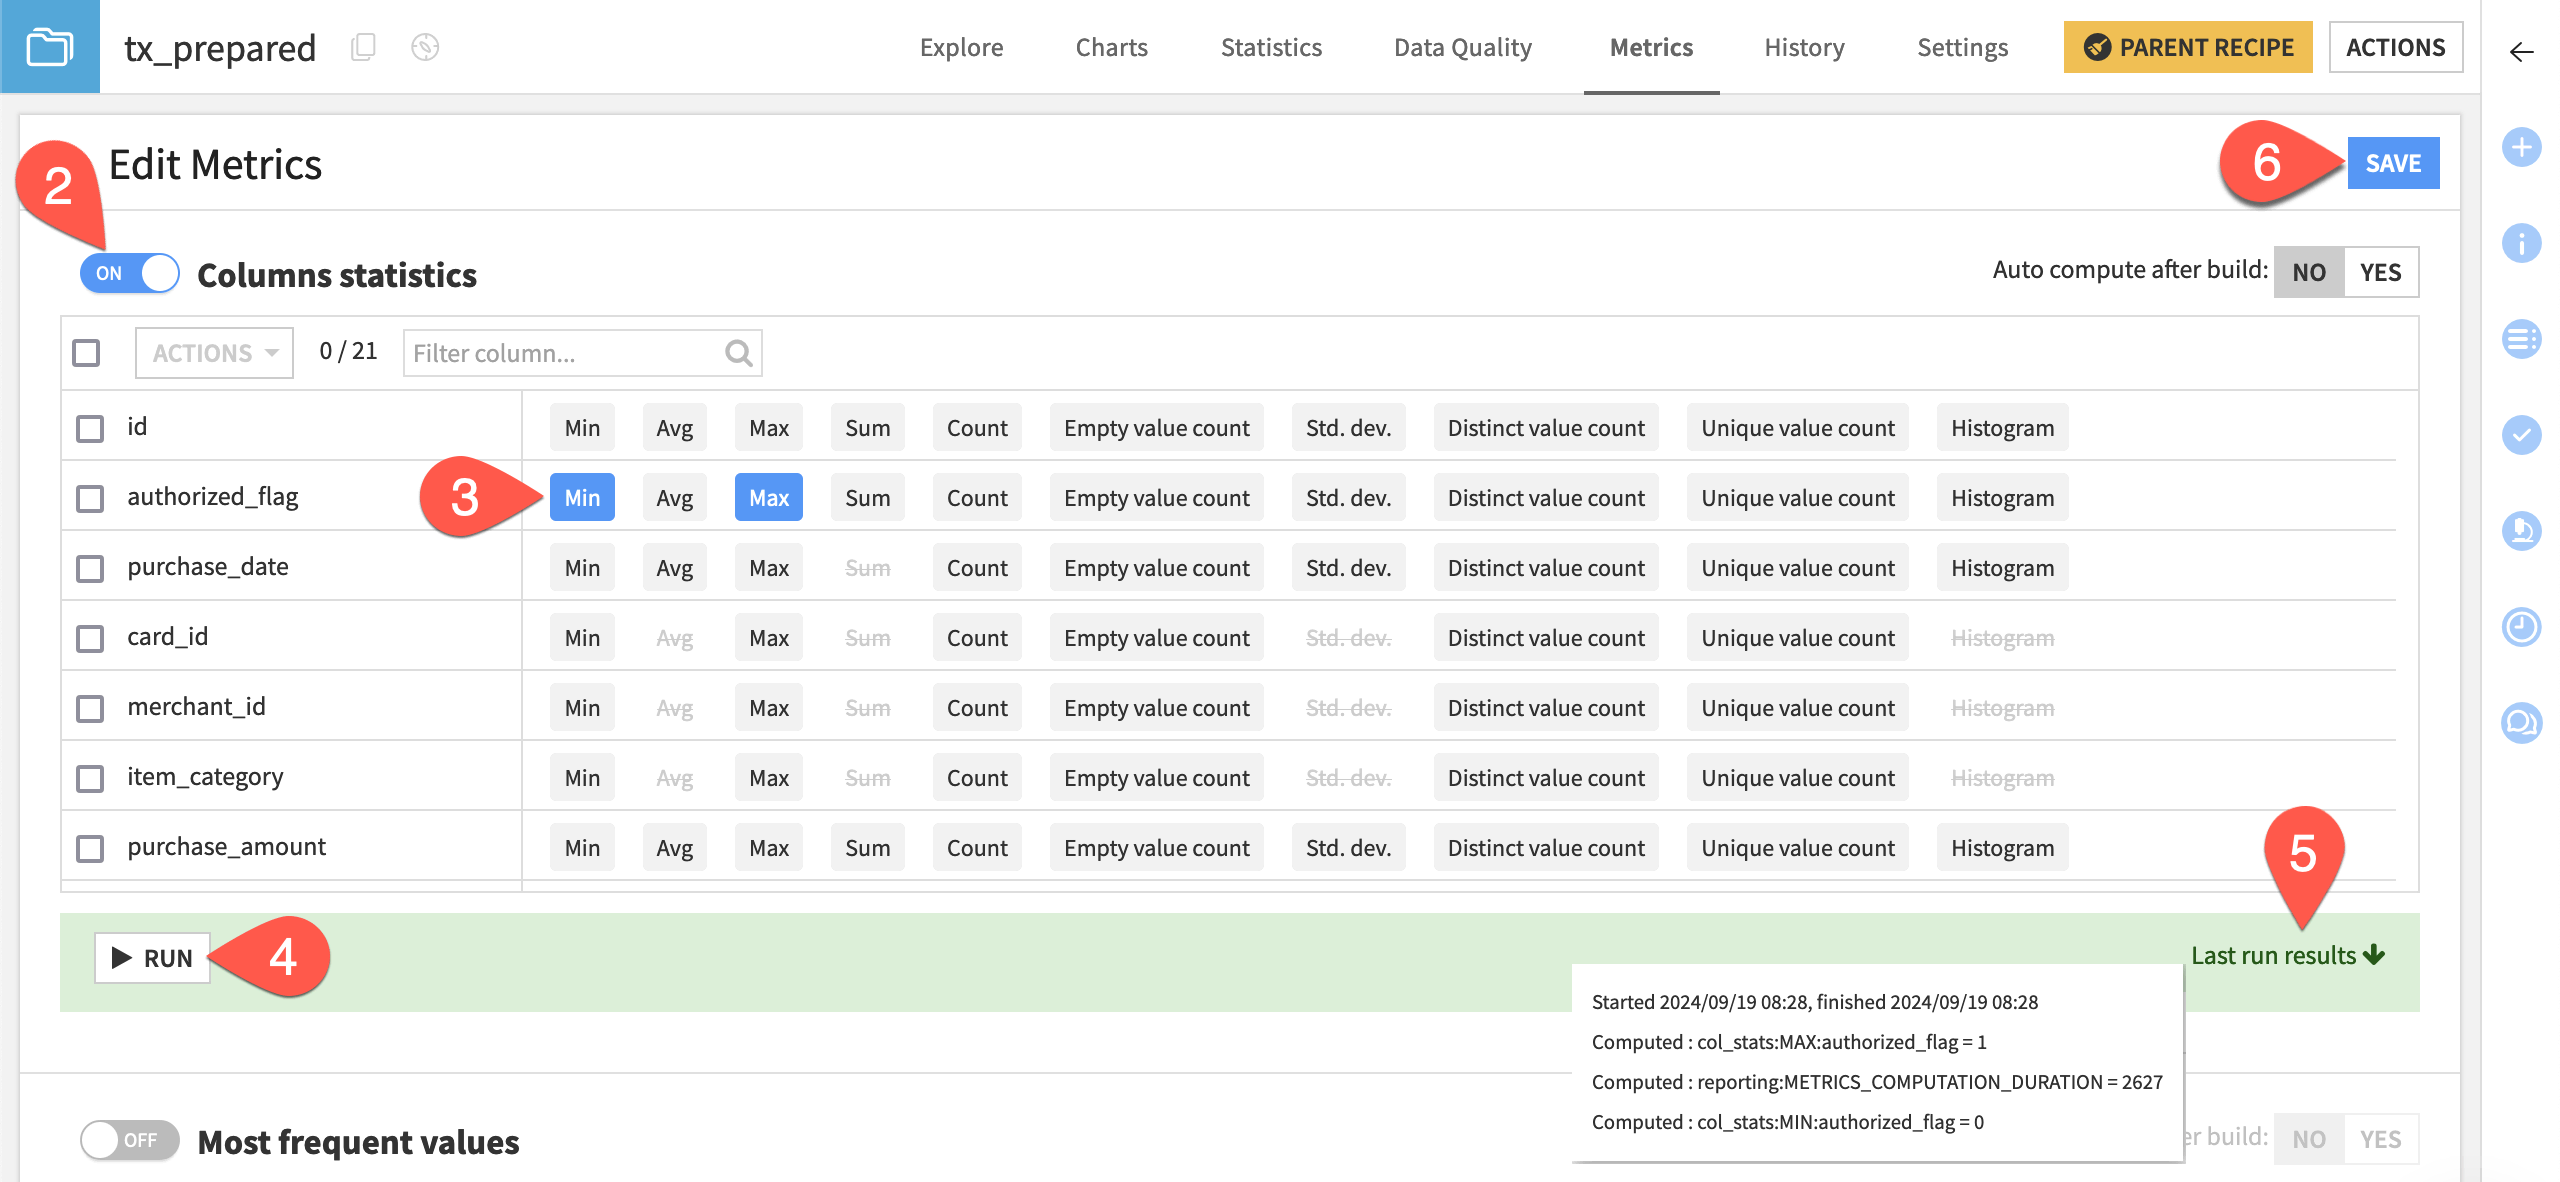
Click Edit Metrics.
Toggle On the Columns statistics section.
For authorized_flag, select Min and Max.
Click on Click to run this now, then Run.
After the metric has been computed, click Last run results to view the results.
Click Save in the top right to preserve the new metrics.
Display metrics#
The next step is to display any new metrics you have created.
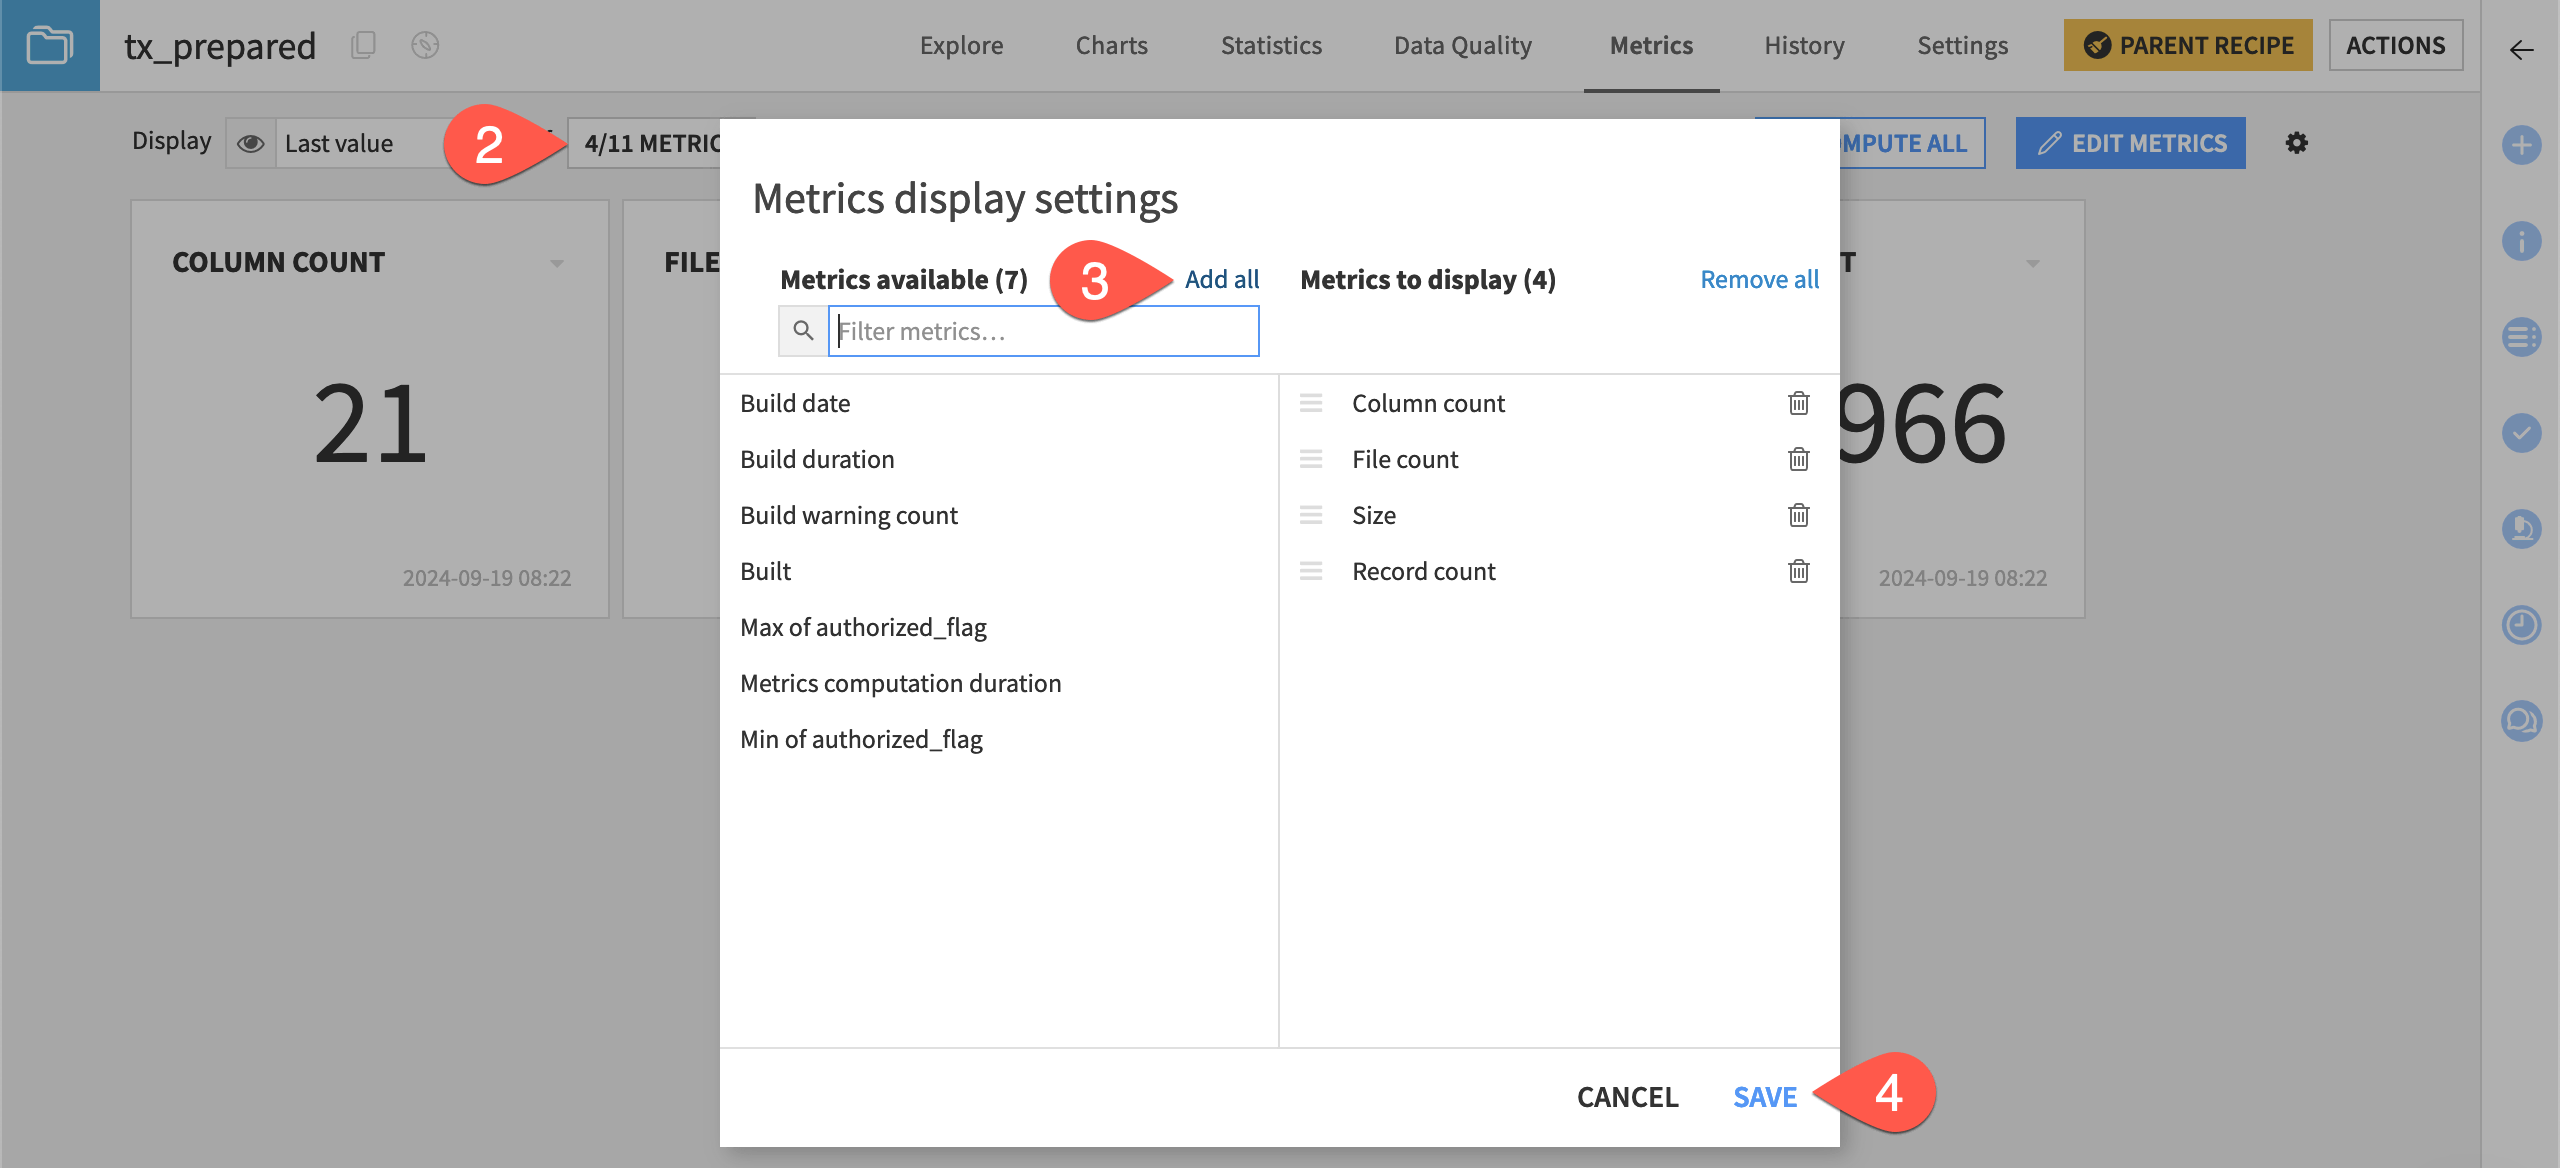
Click the back button next to Edit Metrics to navigate back to the metrics view screen.
Click X/Y Metrics to view all available metrics.
Click Add all next to Metrics available.
Click Save to include these metrics in the display.
Create data quality rules#
While metrics are useful to perform ad-hoc checks on your data as you work on a project, you can also use data quality rules to perform systemic data quality checks across datasets, projects, and even your entire Dataiku instance.
The Data Quality tab contains a wide selection of built-in rule types:
Many types don’t require you to explicitly create a metric as done above (for example column count in range).
Other types are built directly on top of a metric that was explicitly created (for example metric value in range/set).
You can also create custom rules (or metrics for that matter) using Python code.
Tip
If interested in creating Python metrics and data quality rules, see the Custom Automation Academy course.
Record count in range#
Assume you expect the dataset most often contains at least 50,000 records, but most definitely should have more than 5,000 records. You can use a built-in data quality rule to check whether the record count meets this criteria, and return an error or warning if it doesn’t.
Create a rule that will return a warning.
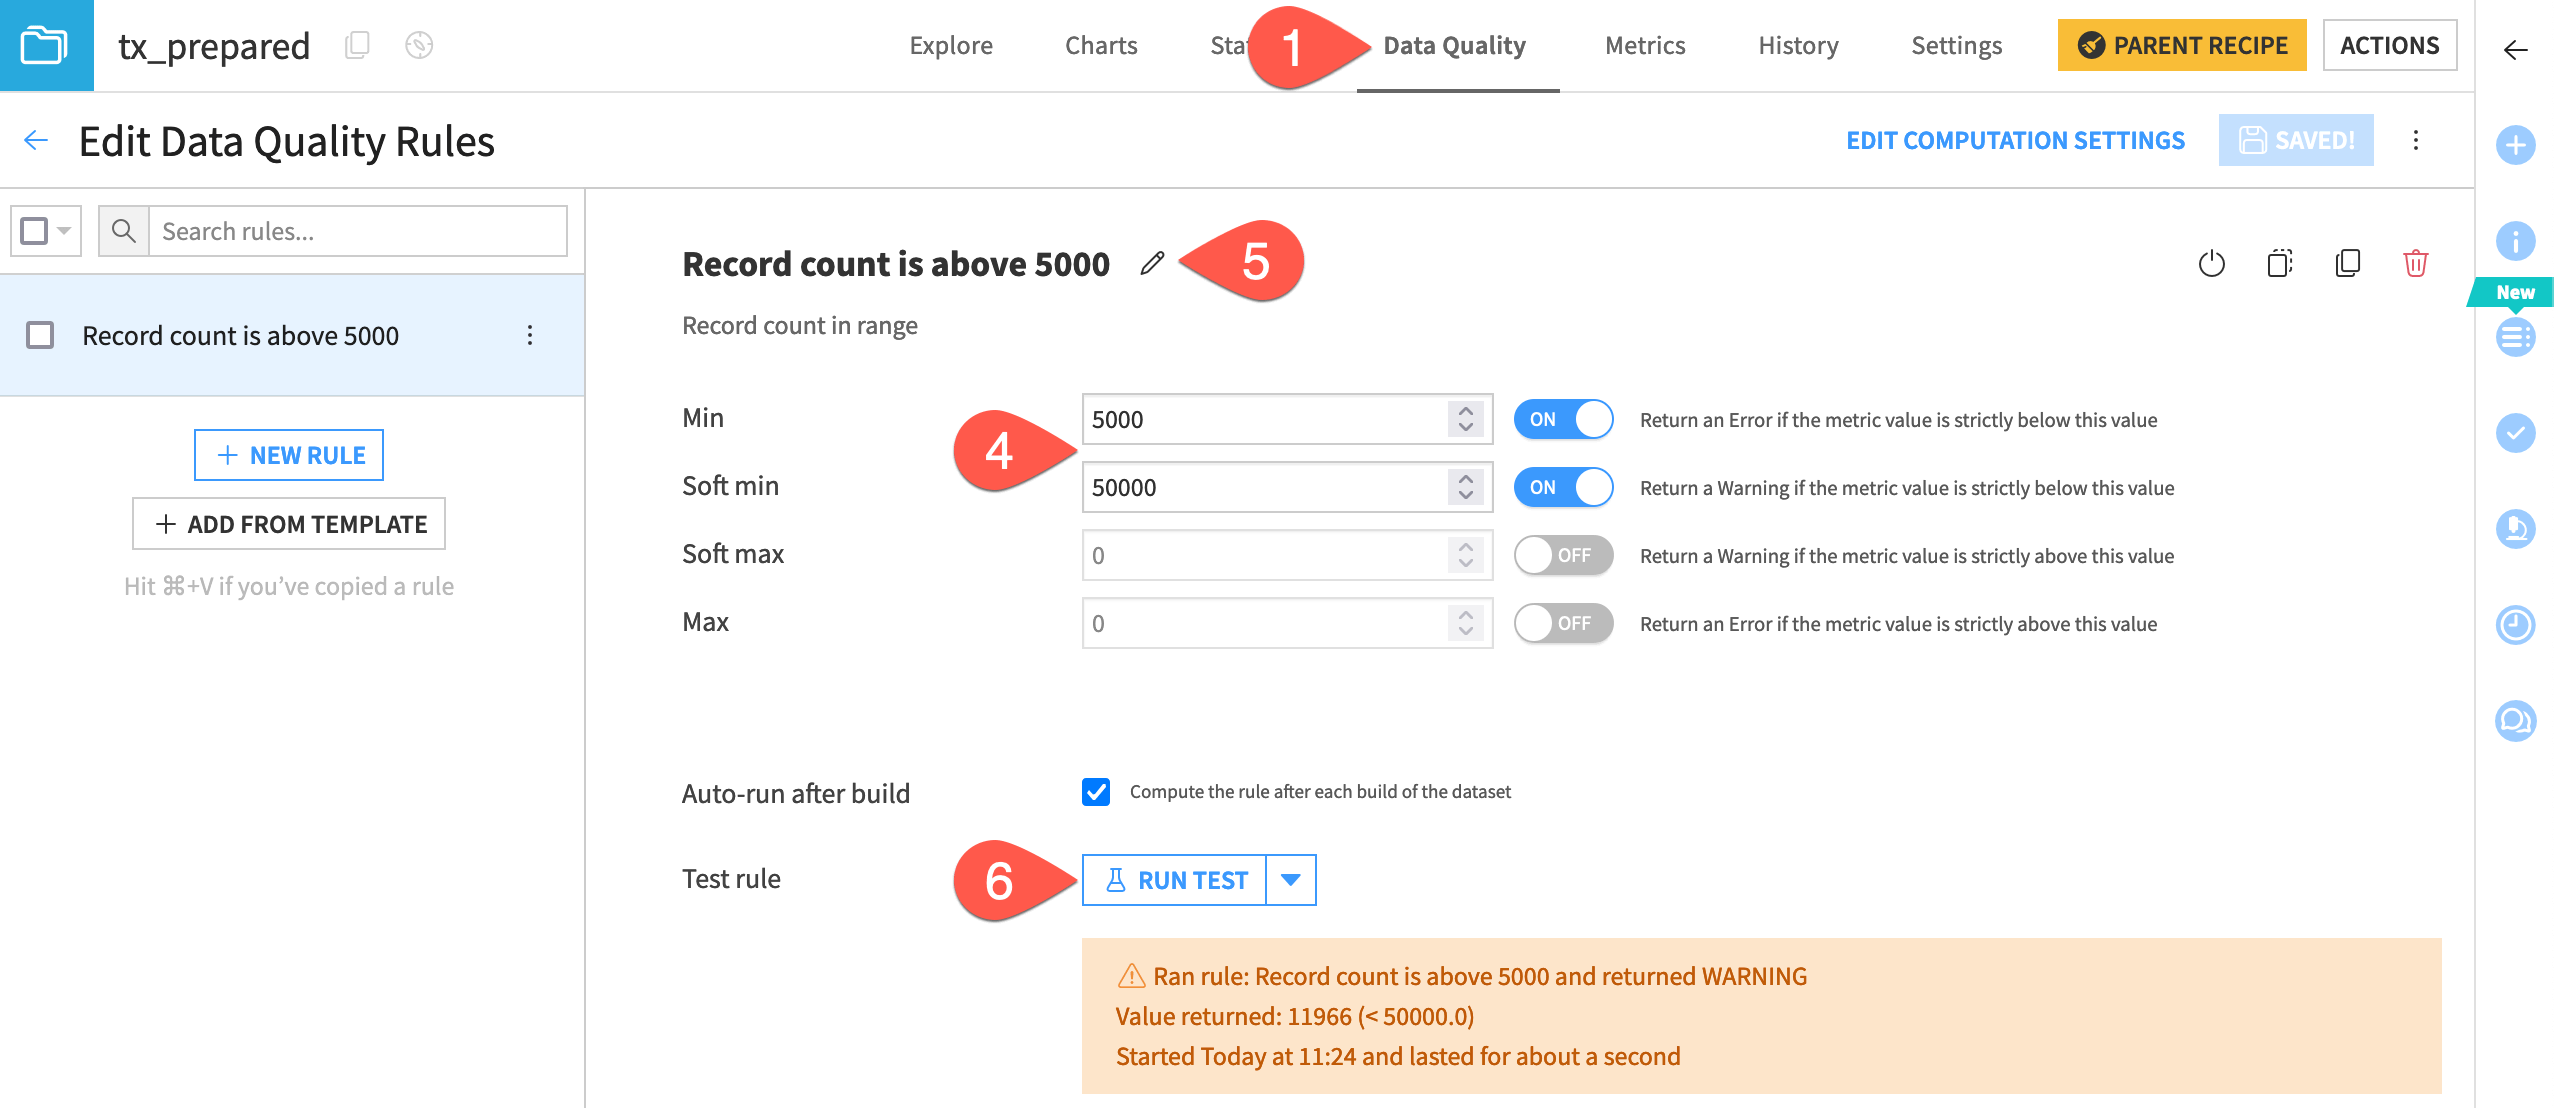
Navigate to the Data Quality tab of the tx_prepared dataset.
Click Edit Rules.
Select Record count in range as the category. You can use the search box to speed up this process.
Based on your expectations, set the min to 5k (
5000) and the soft min to 50k (50000).Note the rule name that has been auto-generated. You can click on the pencil icon to overwrite it if you choose.
Click Run Test to test it, and confirm the warning.
Column min in range#
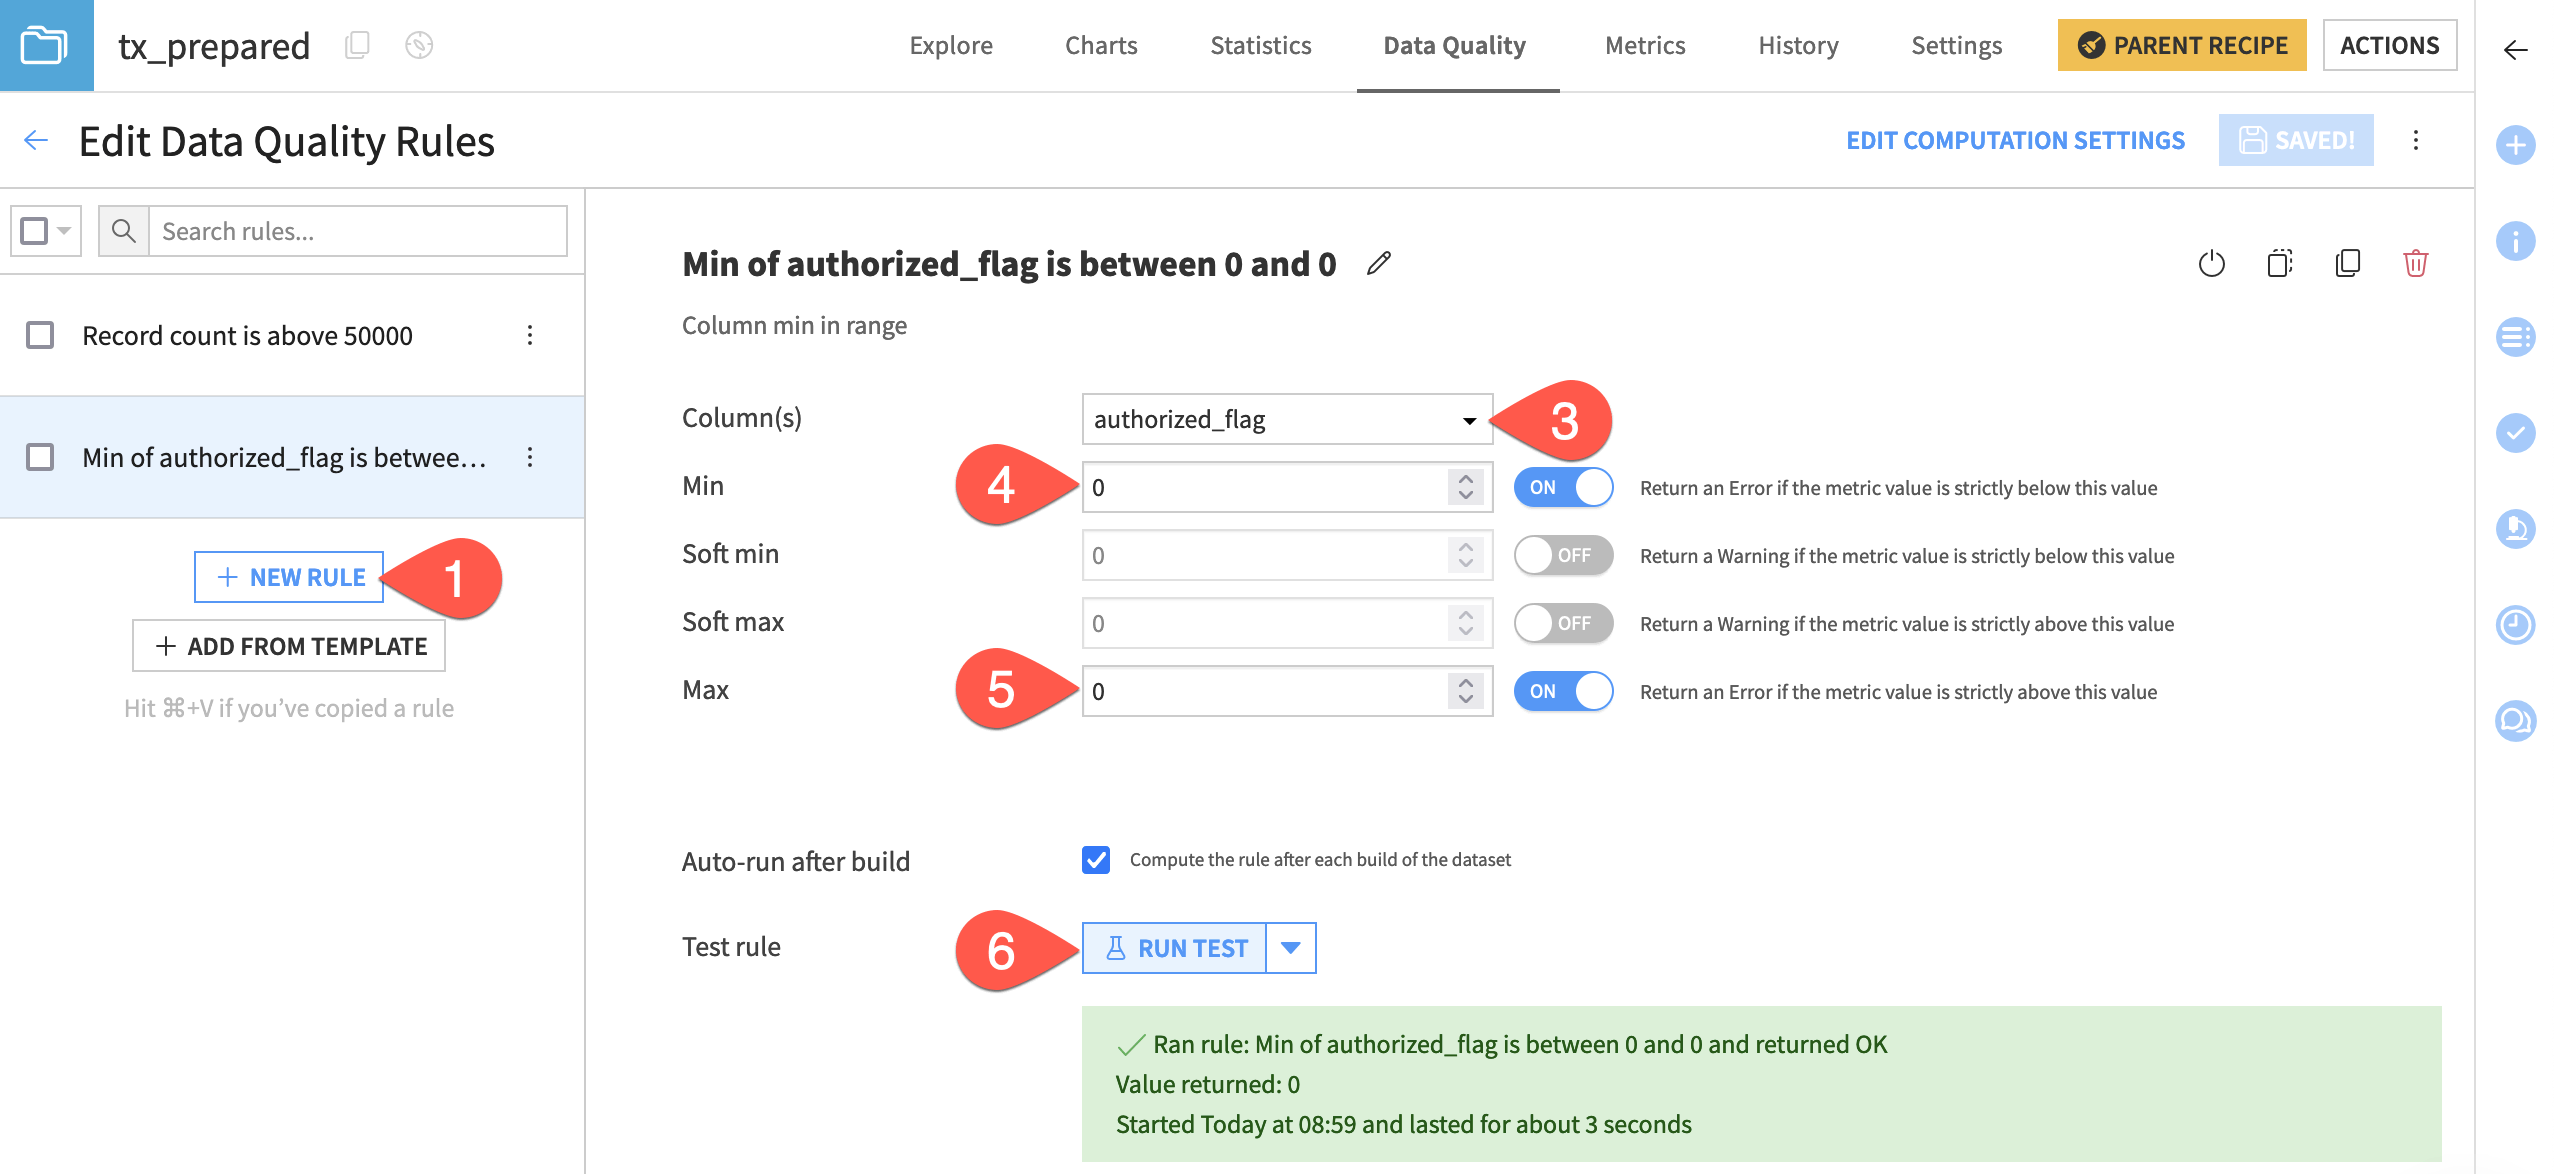
Using a different rule type, you can also check if a column’s minimum value falls within a certain range or is equal to an exact value.
Since you know that the minimum value for authorized_flag must be 0, you can create a rule to check that the column minimum has a range between 0 and 0.
In the left panel, click + New Rule.
Select Column min in range.
Select authorized_flag as the Column.
Toggle On the Min of
0.Do the same for Max.
Click Run Test to confirm it returns OK.
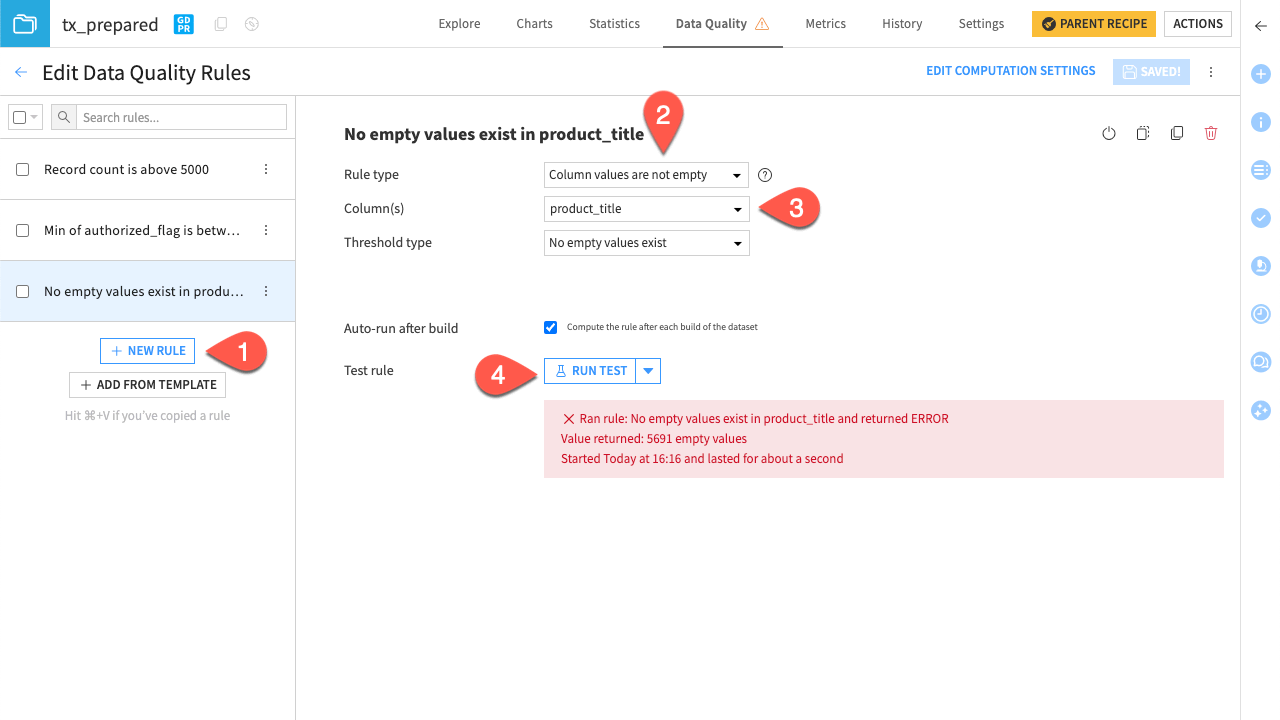
Column values are not empty#
Let’s take a look at an error. We’ll create a rule that the product description must not be empty. That way, we ensure some quality data for the recorded transaction. Then, we’ll monitor if the product_title column has empty values and trigger an error otherwise.
Click + New Rule.
Select Column values are not empty as the rule type.
Select product_title as the column.
Click Run Test and notice the returned error.
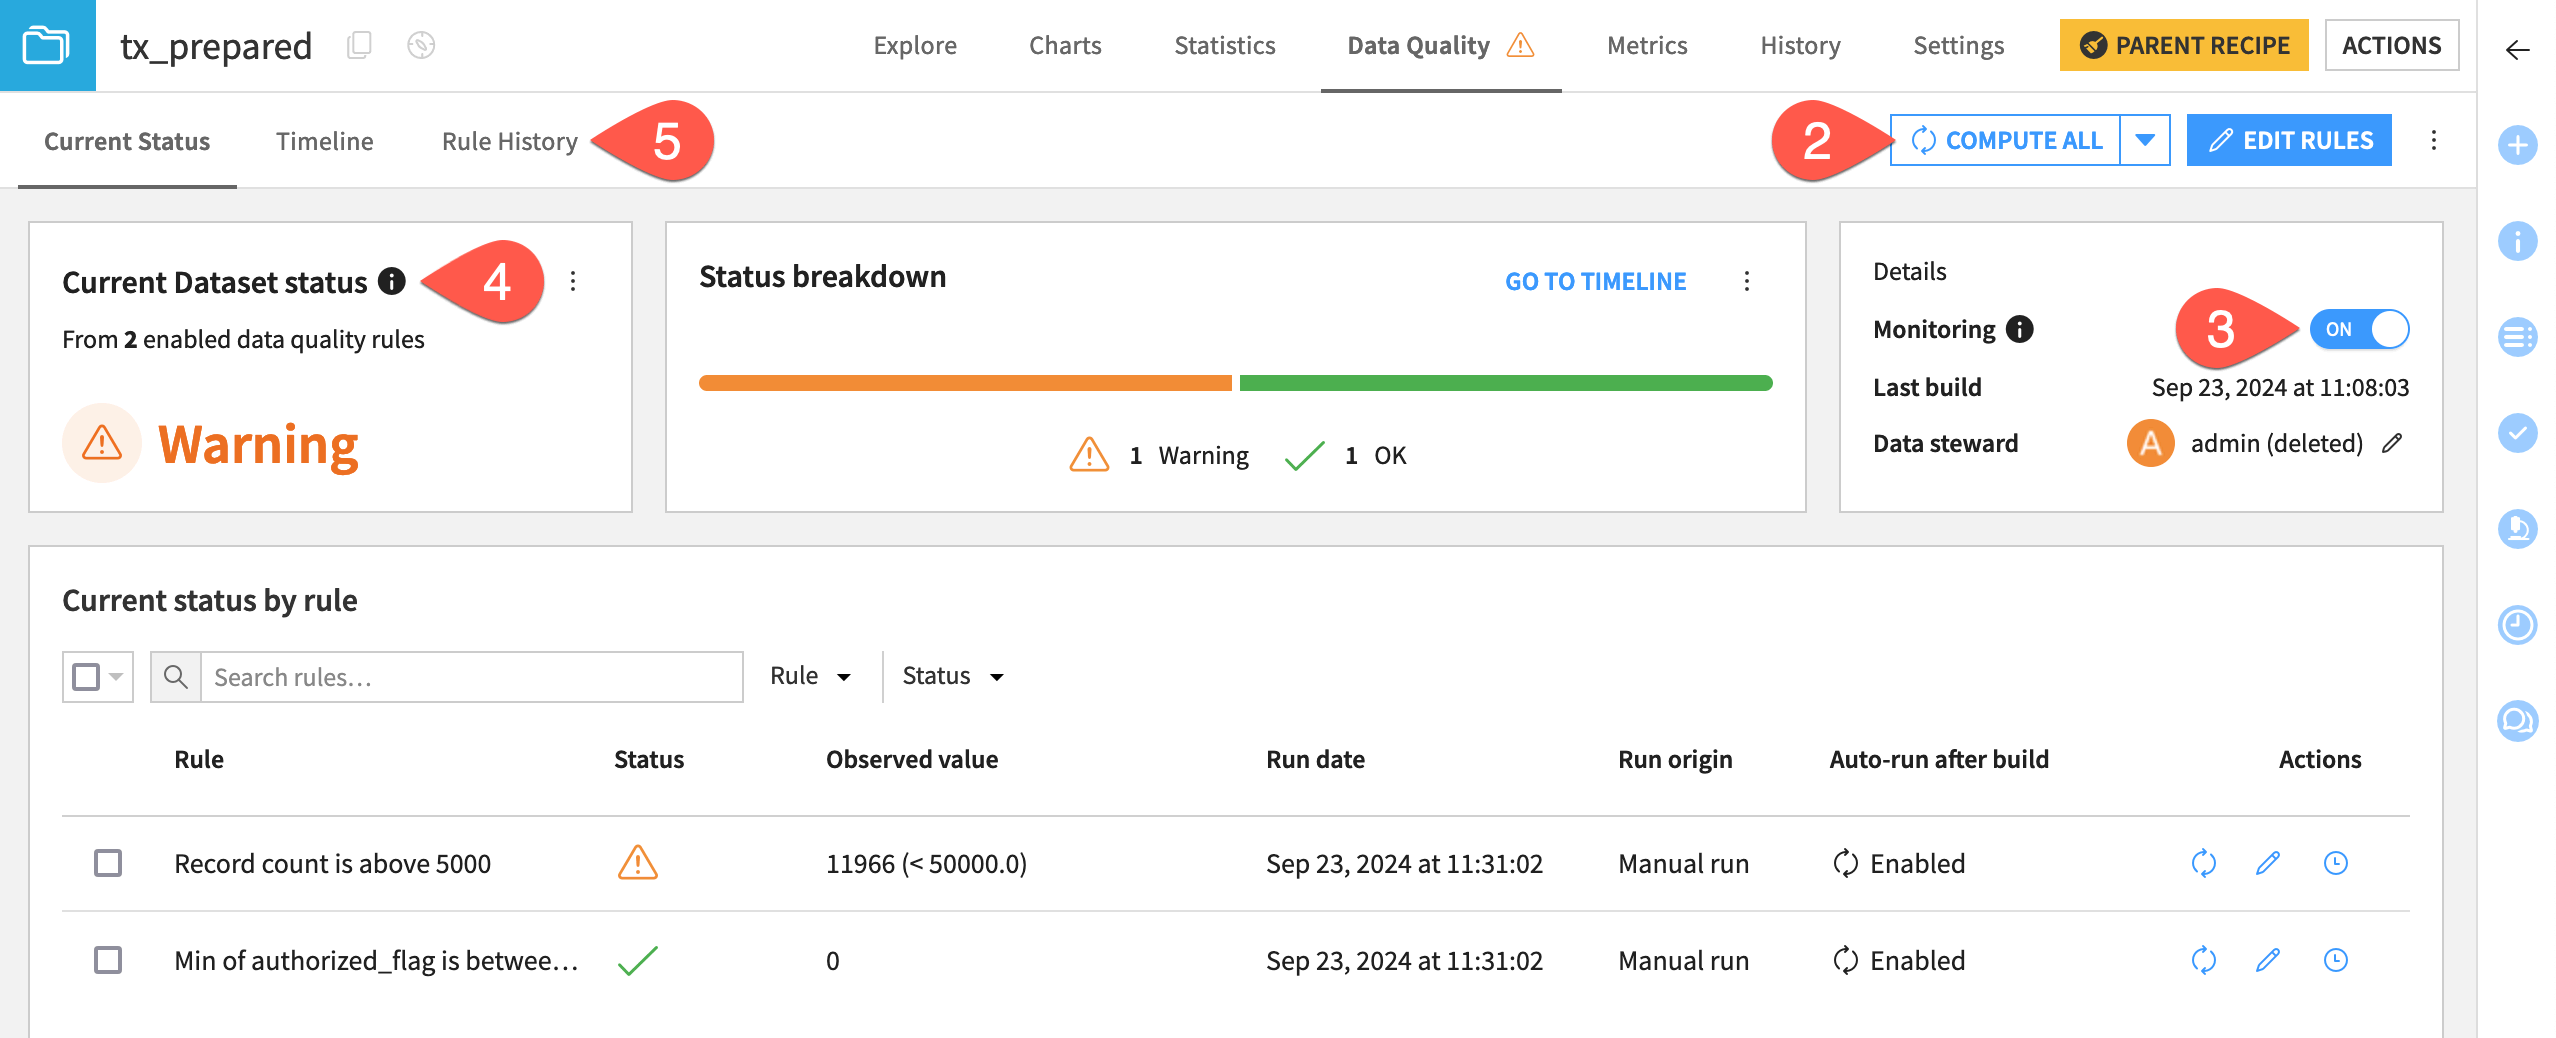
View data quality#
You’re now ready to compute the status of the data quality rules and view the results.
Click the back arrow next to Edit Data Quality Rules to return to the Current Status view.
Click Compute All.
Take note of the Monitoring flag.
Monitoring is toggled on by default as soon as you create rules on a dataset. Monitored datasets are included in the project and instance level data quality views. If you don’t want a dataset to be included in these views, you can toggle the flag off.
Take note of the current dataset status and status breakdown. The current dataset status displays the most severe current status of all enabled rules. Since one rule returned an error, the current status is an error.
Click through the subtabs Current Status, Timeline, and Rule History to view the results in different displays.
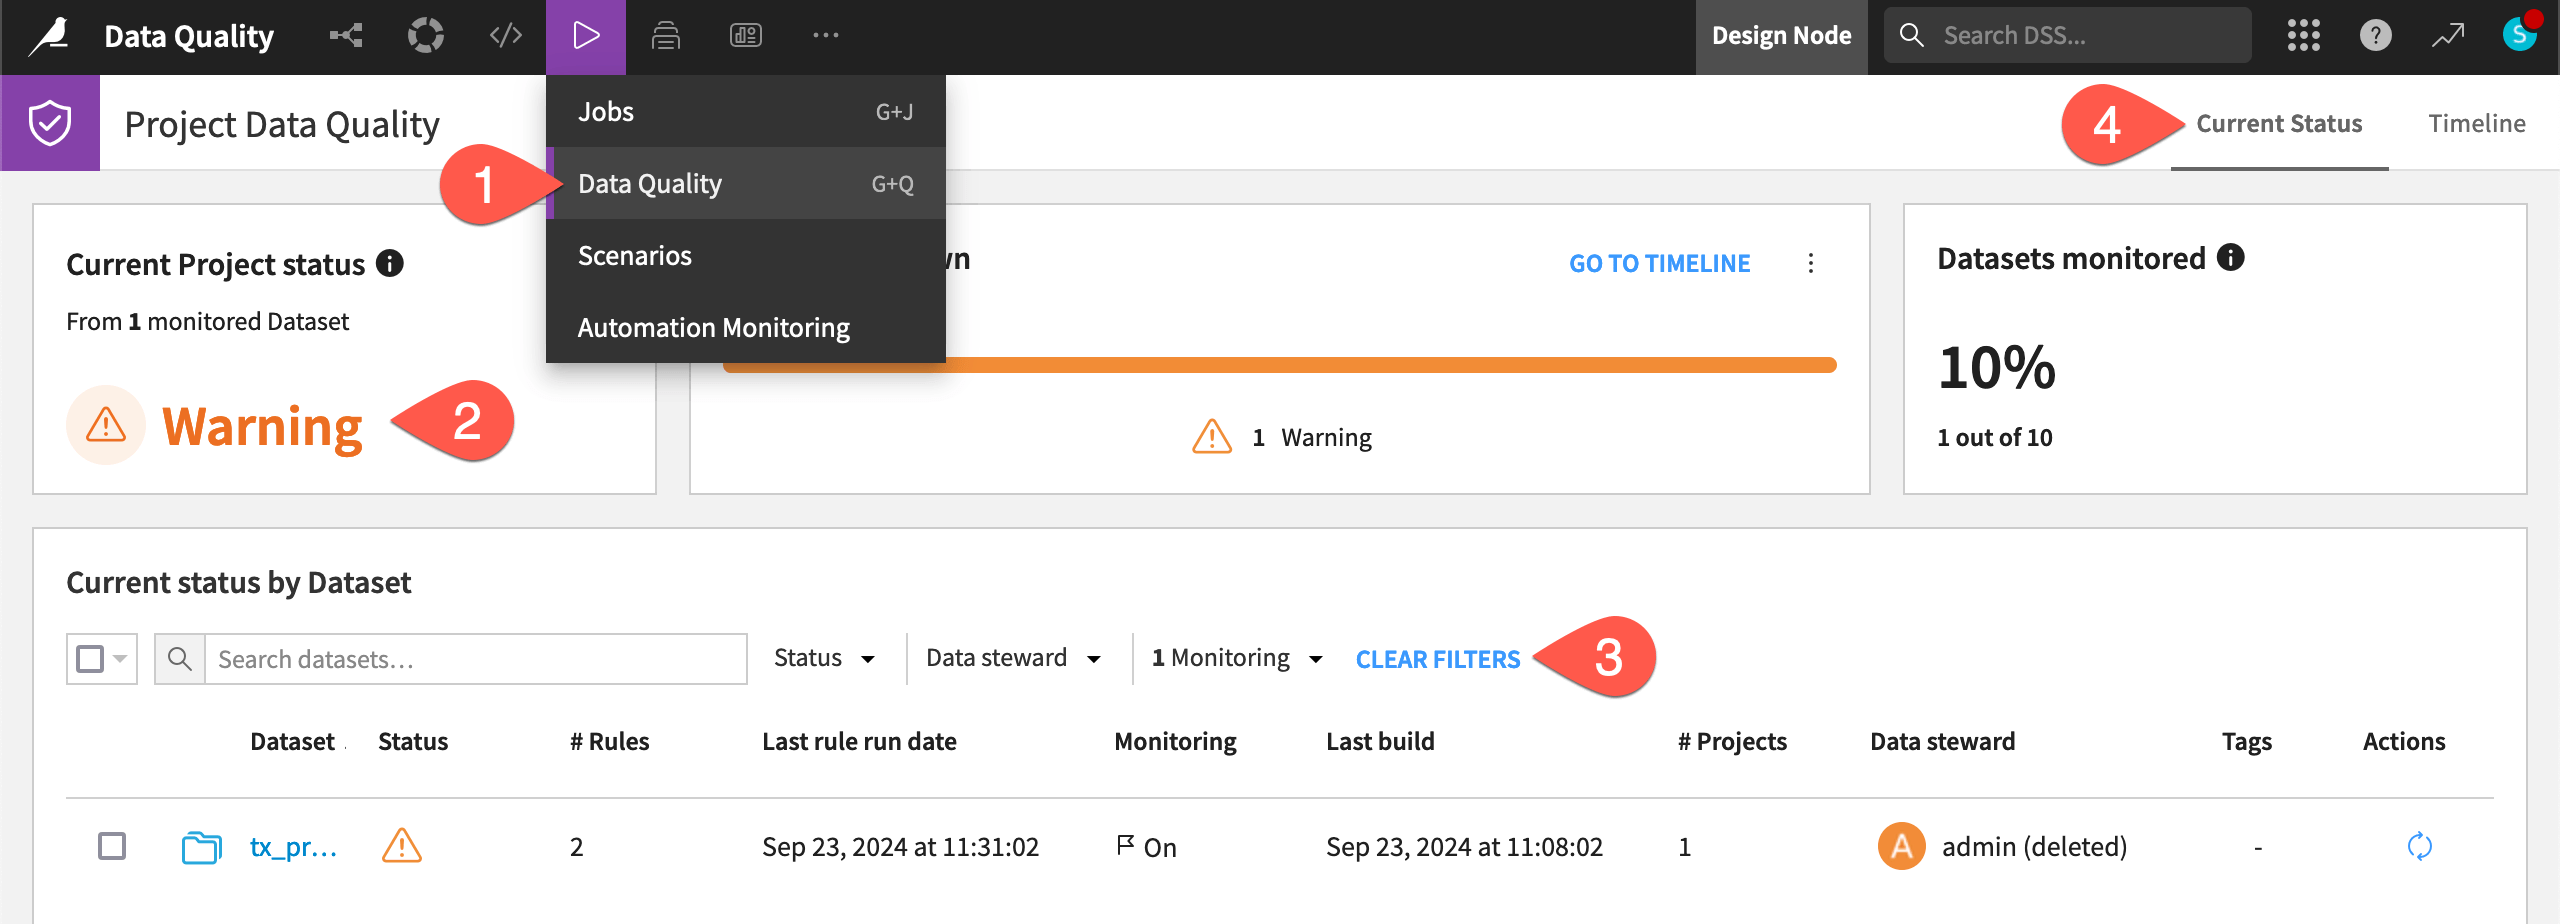
This view shows data quality at the dataset level, but you can also get a broader view of data quality across the entire project.
In the Jobs (
 ) menu, select Data Quality (or type
 g+q).Take note of the current project status. It shows a warning because there is only one monitored dataset, tx_prepared, which is currently returning a warning.
Click the blue Clear filters button for a look at all datasets in the project, regardless of whether they’re monitored or not.
Click through the subtabs Current Status and Timeline to see the different views for project data quality.
Tip
You can experiment with setting up data quality rules on other datasets and check back to see how the status breakdown changes in this view!
Also, check out the instance data quality view from waffle (![]() ) > Data Quality to see an overview of data quality for all projects you have access to on your Dataiku instance.
) > Data Quality to see an overview of data quality for all projects you have access to on your Dataiku instance.
Extract failed rows from data quality rules#
You can also monitor the rows that failed to pass the data quality rules.
Return to the Flow (
 ).
).Select the tx_prepared dataset.
From the Actions (
 ) panel, select Extract failed rows under Other recipes dropdown.
Leave the default settings and click Create Recipe.
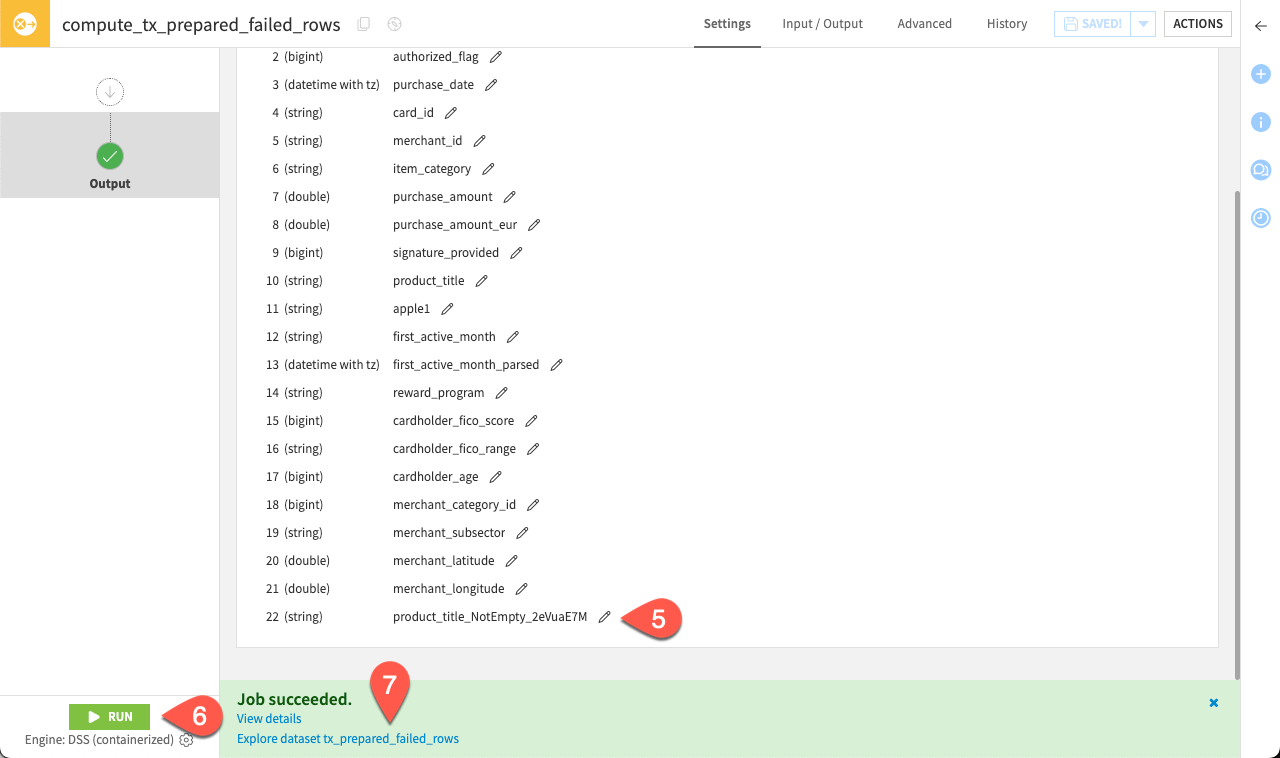
Notice the new column introduced in the dataset that will show the status of the rule.
Click Run.
Click Explore dataset tx_prepared_failed_rows to have an overview of the failing rows.
View data lineage#
As part of monitoring data quality, you can also view data lineage, or track data transformations throughout your pipeline. This can help you diagnose data issues upstream or potential impacts of changes downstream. Let’s view the data lineage of a column!
Important
You must use Dataiku version 13.2+ to complete this section of the tutorial.
Return to the Flow, and open the tx_prepared dataset.
Click on the purchase_amount_eur column header.
In the dropdown menu, choose See column lineage.
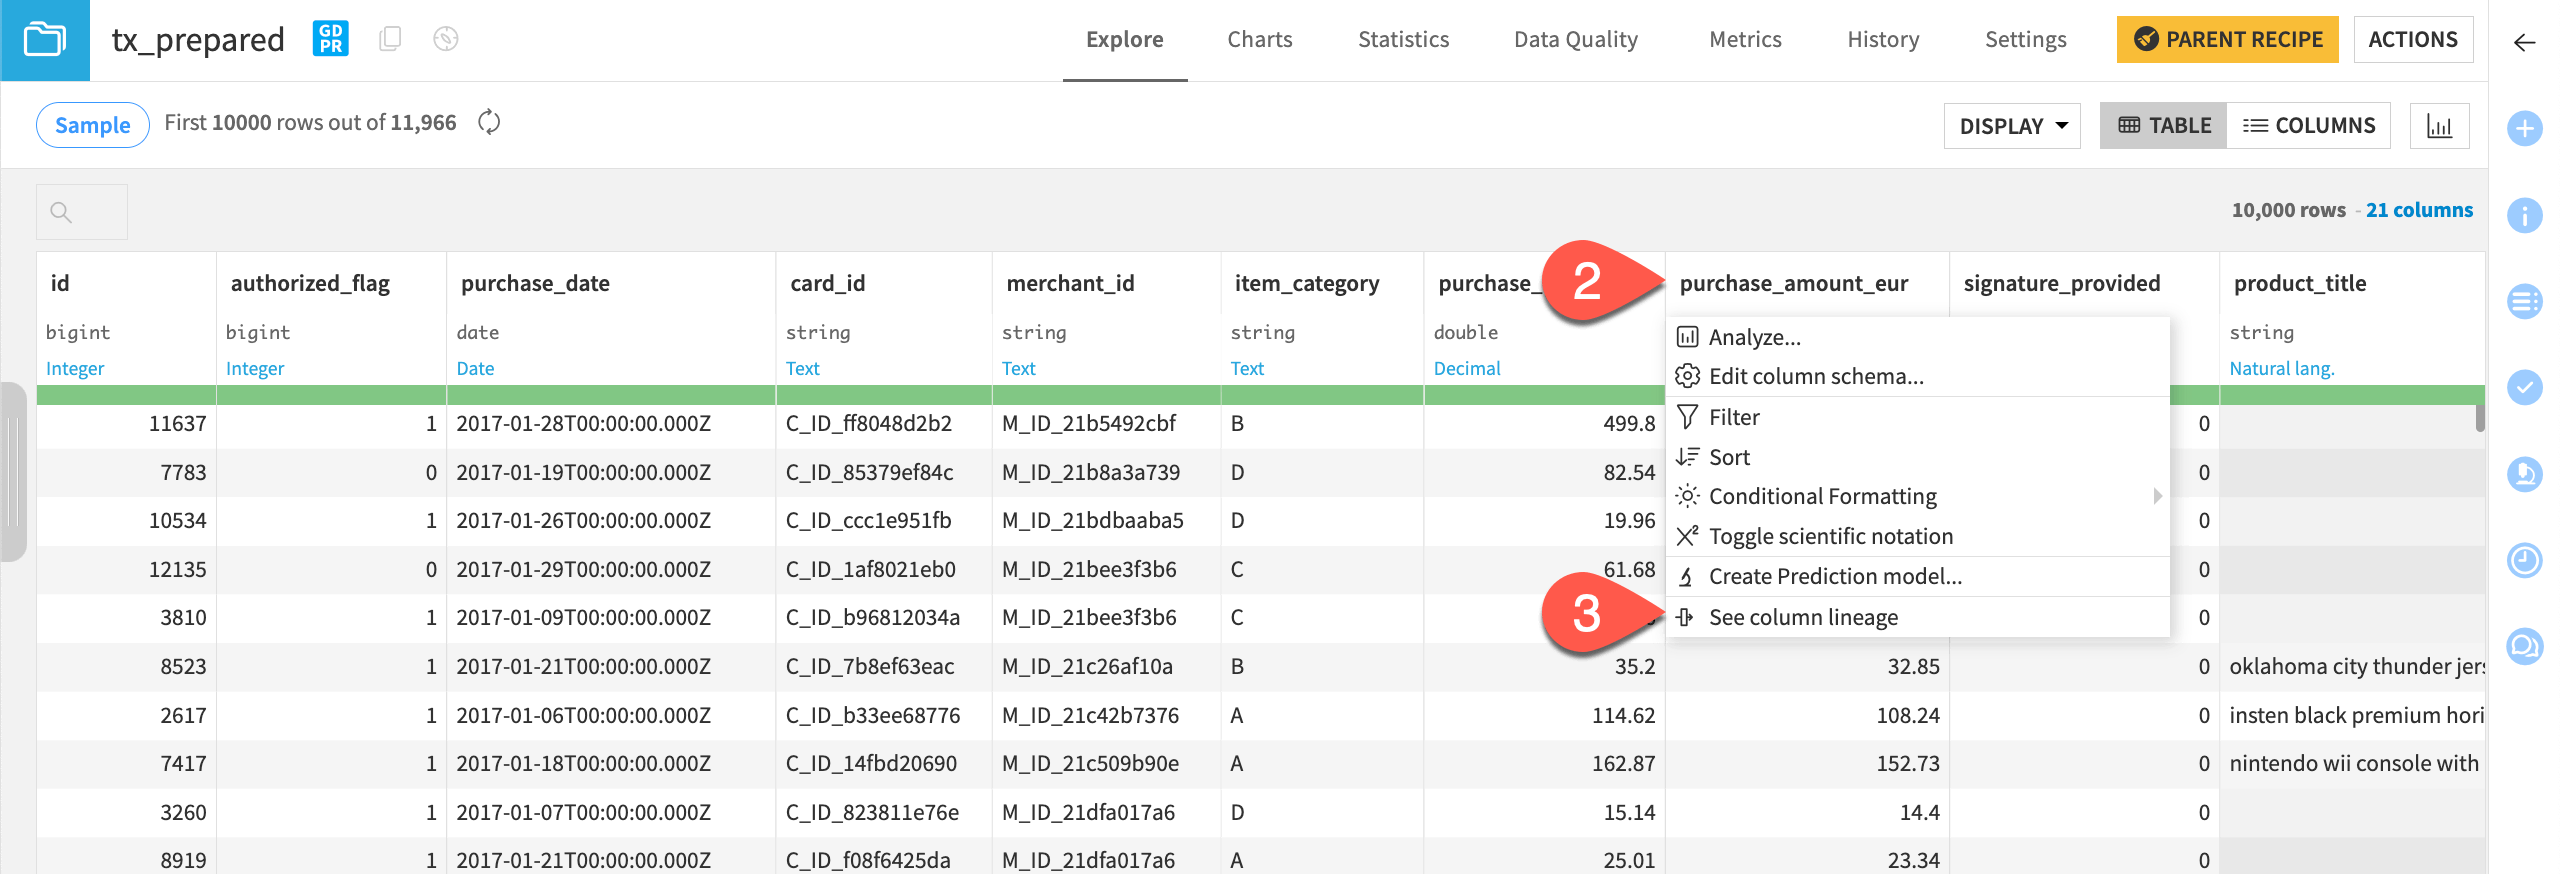
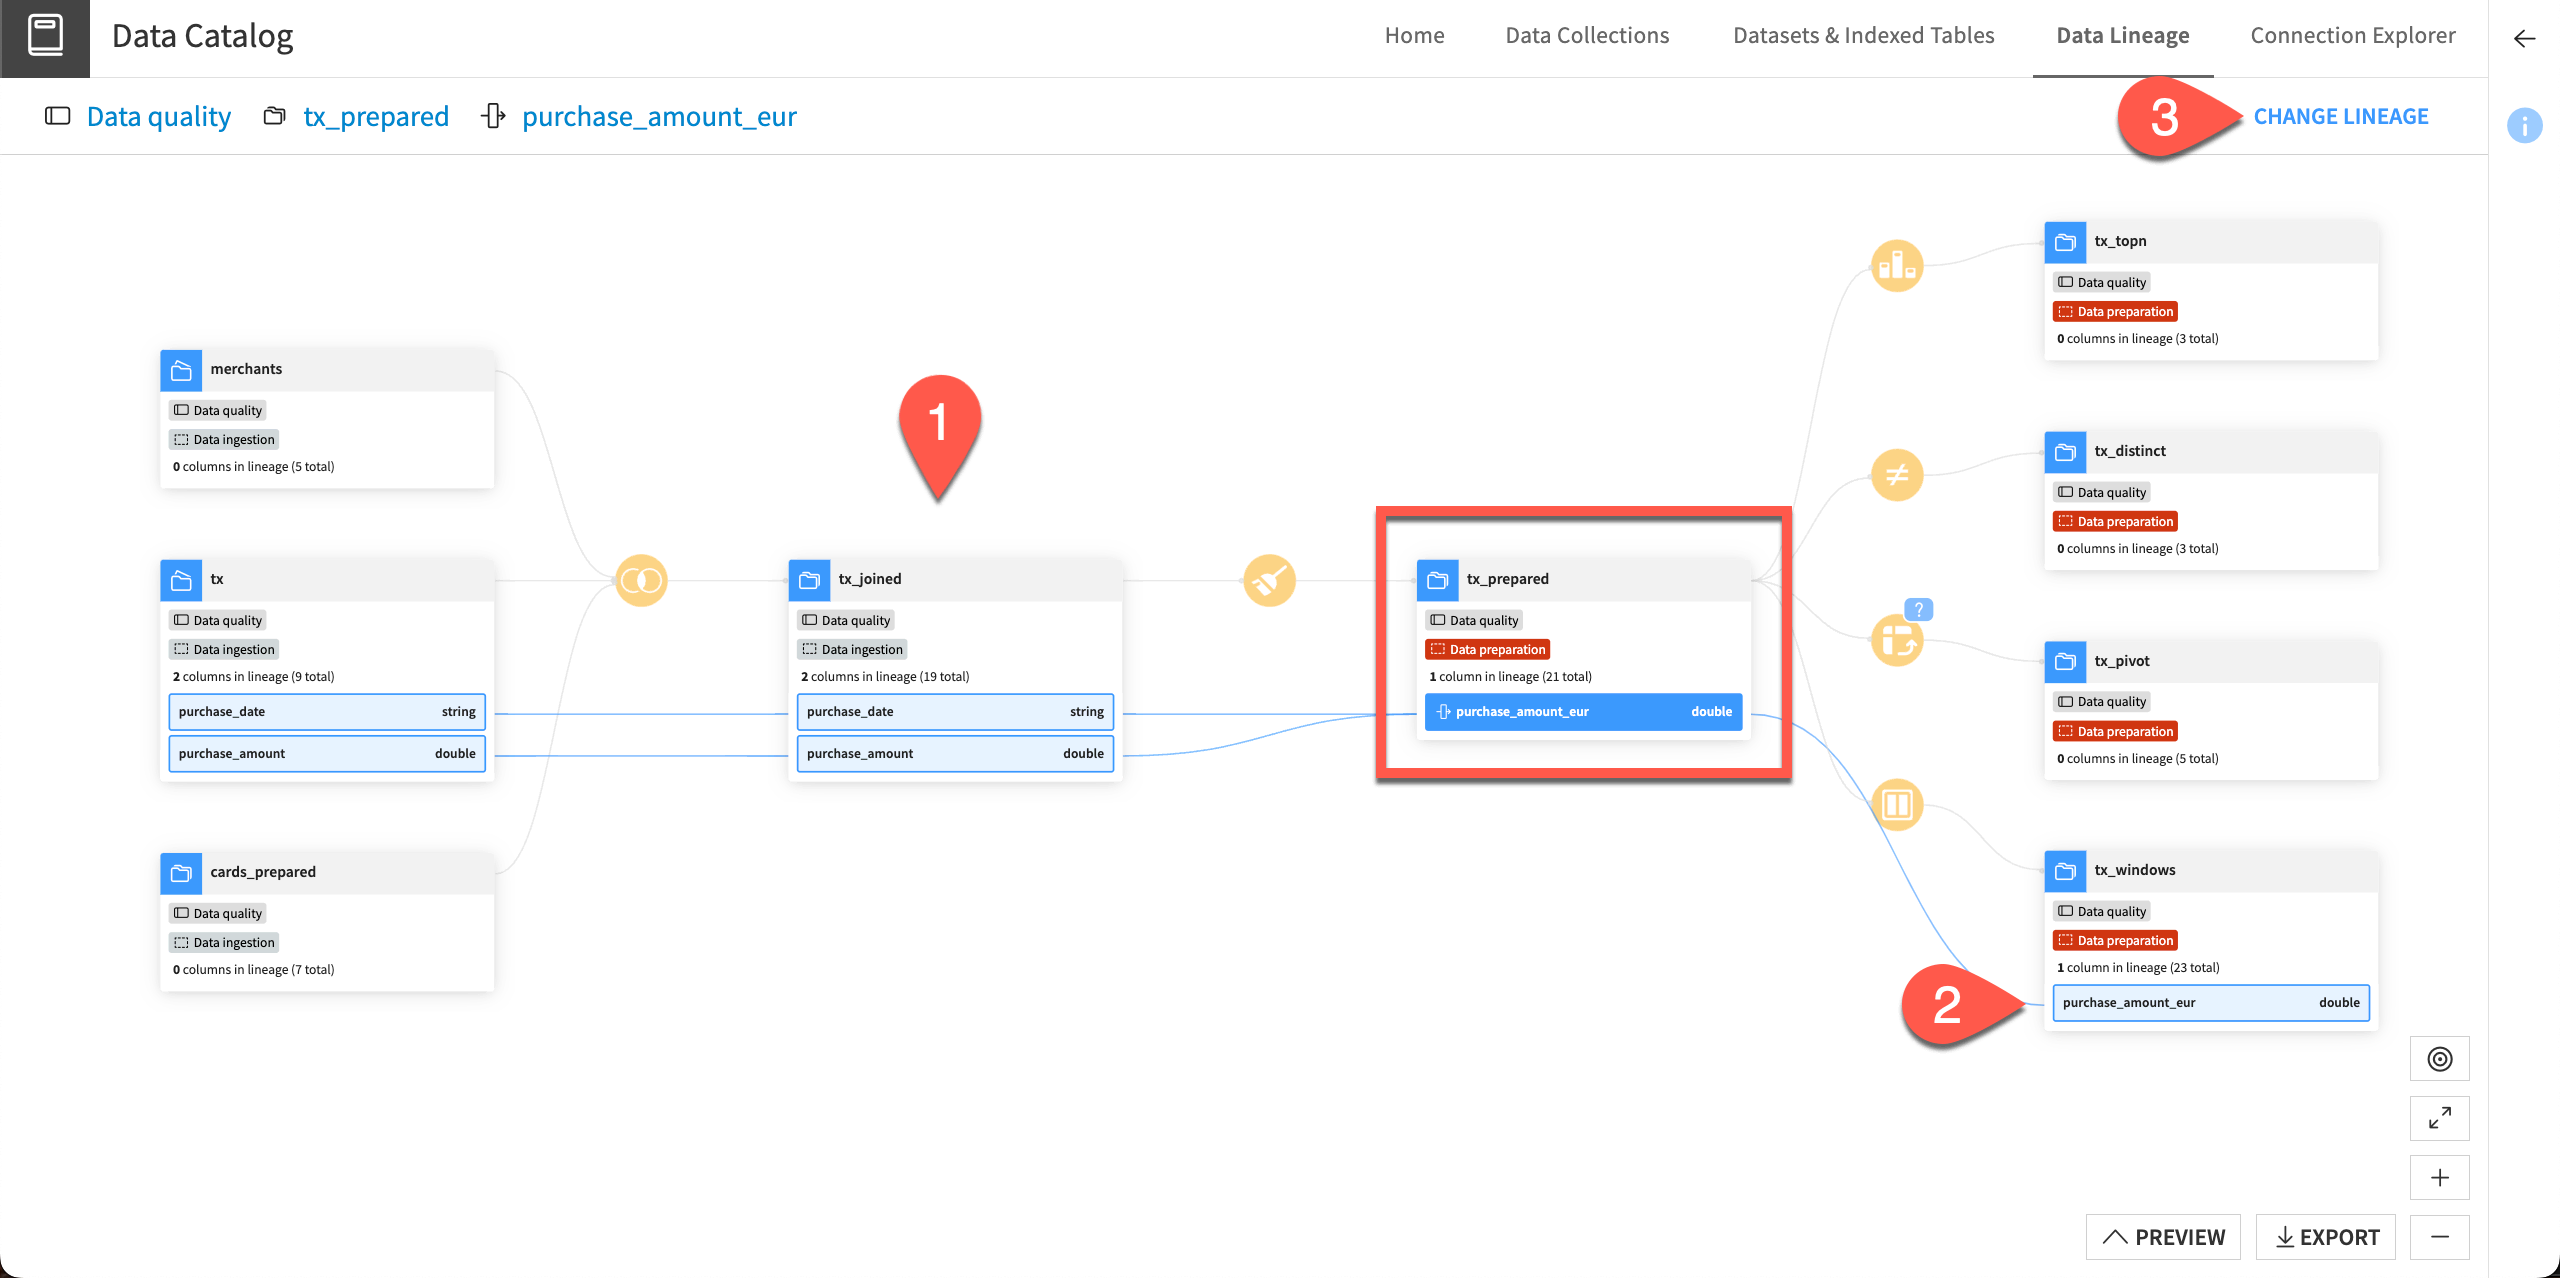
This takes you to the Data Lineage view, which is in the Data Catalog. The column we selected is highlighted in blue. Let’s investigate the lineage of this column.
Follow the blue lines to the left to see that this column was created in a Prepare recipe using the input columns purchase_date and purchase_amount.
Follow the blue lines to the right to see the column is used in one downstream dataset, tx_windows.
Click Change Lineage and choose another column in this dataset to view its lineage and experiment with this view.
Next steps#
Congratulations on setting up metrics and data quality rules! On their own, these features can provide deep insight into objects in the Flow.
However, to act on these insights, you’ll want to explore scenarios. Learn how to automate your data pipeline with a scenario next.
See also
See the reference documentation to learn more about Data Quality Rules.