Tutorial | Custom metrics, checks, and data quality rules#
Get started#
Metrics, checks, and data quality rules are tools for monitoring the status of objects in a Flow. With code, you can customize them beyond the built-in visual options. Let’s see how these work!
Objectives#
In this tutorial, you will use Python to create:
A custom metric on a dataset.
A custom check on a managed folder.
A custom data quality rule on a dataset.
Prerequisites#
To reproduce the steps in this tutorial, you’ll need:
Dataiku 12.0 or later.
An Advanced Analytics Designer or Full Designer user profile.
Basic knowledge of Dataiku (Core Designer level or equivalent).
Basic knowledge of Python code.
Tip
Previous knowledge of metrics, checks, and data quality rules is also helpful. See the Data Quality & Automation Academy course if this is unfamiliar to you.
Create the project#
From the Dataiku Design homepage, click + New Project.
Select Learning projects.
Search for and select Custom Metrics, Checks & Data Quality Rules.
If needed, change the folder into which the project will be installed, and click Create.
From the project homepage, click Go to Flow (or type
g+f).
From the Dataiku Design homepage, click + New Project.
Select DSS tutorials.
Filter by Developer.
Select Custom Metrics, Checks & Data Quality Rules.
From the project homepage, click Go to Flow (or type
g+f).
Note
You can also download the starter project from this website and import it as a zip file.
You’ll next want to build the Flow.
Click Flow Actions at the bottom right of the Flow.
Click Build all.
Keep the default settings and click Build.
Use case summary#
The project has three data sources:
Dataset |
Description |
|---|---|
tx |
Each row is a unique credit card transaction with information such as the card that was used and the merchant where the transaction was made. It also indicates whether the transaction has either been:
|
merchants |
Each row is a unique merchant with information such as the merchant’s location and category. |
cards |
Each row is a unique credit card ID with information such as the card’s activation month or the cardholder’s FICO score (a common measure of creditworthiness in the US). |
Create custom Python metrics#
Let’s begin at one of the most foundational levels of data monitoring: the metric.
Add a Python probe#
The tx_prepared dataset contains transactions flagged with authorization status and item categories. Create a metric that indicates the most and least authorized item categories.
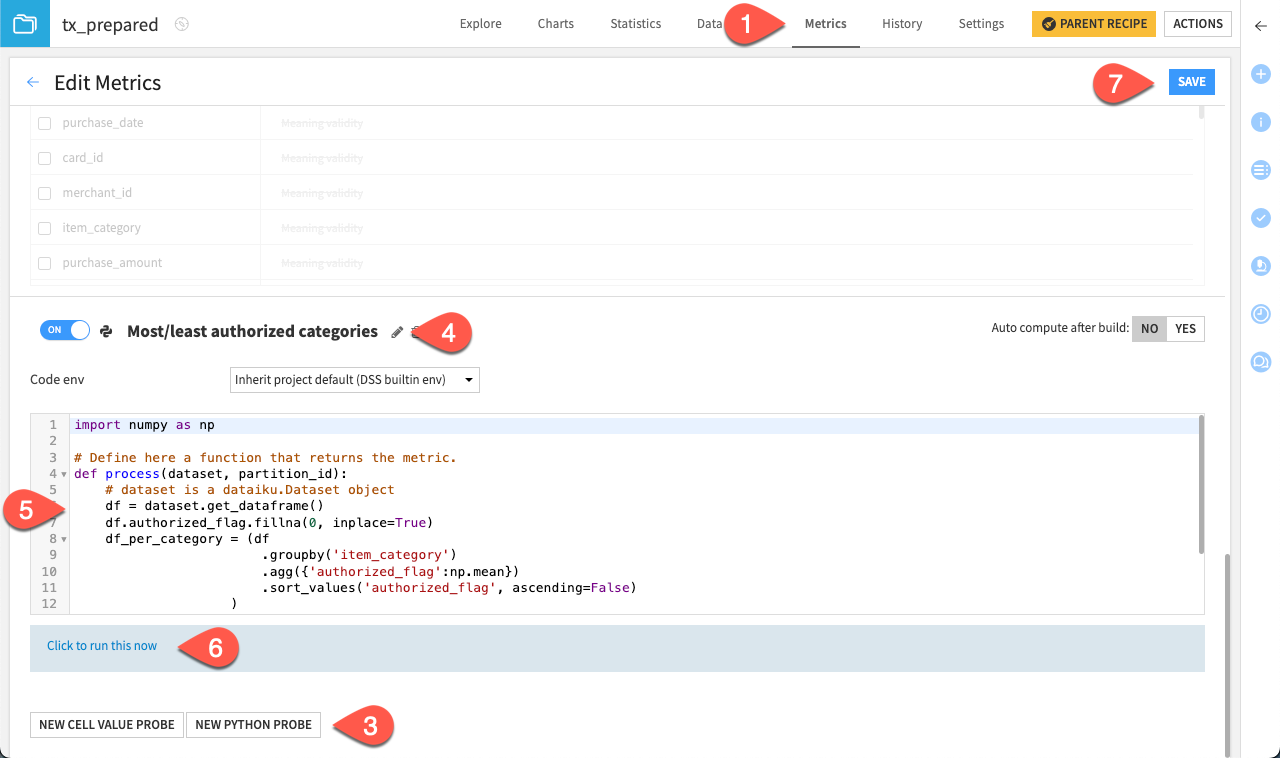
Open the tx_prepared dataset, and navigate to the Metrics tab.
Click Edit Metrics.
Scroll to the bottom of the page, and click New Python Probe.
Toggle it On, and click the pencil icon to rename it
Most/least authorized categories.Copy-paste the following code block:
import numpy as np

# Define here a function that returns the metric.
def process(dataset, partition_id):
   # dataset is a dataiku.Dataset object
   df = dataset.get_dataframe()
   df.authorized_flag.fillna(0, inplace=True)
   df_per_category = (df
                   .groupby('item_category')
                   .agg({'authorized_flag':np.mean})
                   .sort_values('authorized_flag', ascending=False)
               )
   most_authorized_category = df_per_category.index[0]
   least_authorized_category = df_per_category.index[-1]

   return {'Most authorized item category' : most_authorized_category,
       'Least authorized item category' : least_authorized_category}
Click on Click to run this now, and then Run to test out these new metrics.
Click Save.
Note
The code environment for the custom metric is set to inherit from the project default. However, feel free to change it to integrate your favorite library when creating your own metrics.
Display metrics#
Once you have a custom metric, you can display it like any other built-in metric.
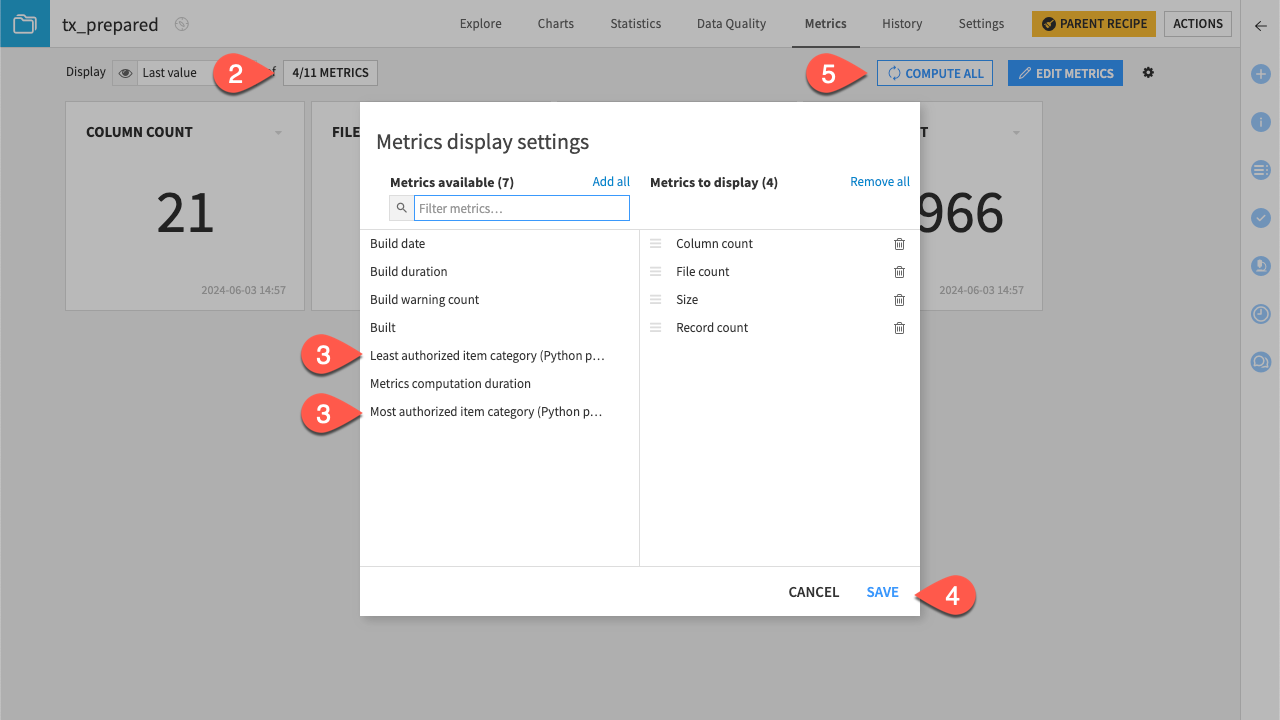
Navigate back to the metrics view screen.
Click X/Y Metrics.
Under Metrics Available, click on the created metrics Least authorized item category and Most authorized item category.
Click Save.
Click Compute All.
Create custom Python checks#
Checks are a tool to monitor the status of Flow objects like managed folders, saved models, and model evaluation stores. You can also customize these with Python in a similar way.
Add a Python check#
Let’s change from the dataset to the managed folder tx to create custom checks. The folder holds two years of transactions. Programmatically ensure you have all the necessary data.
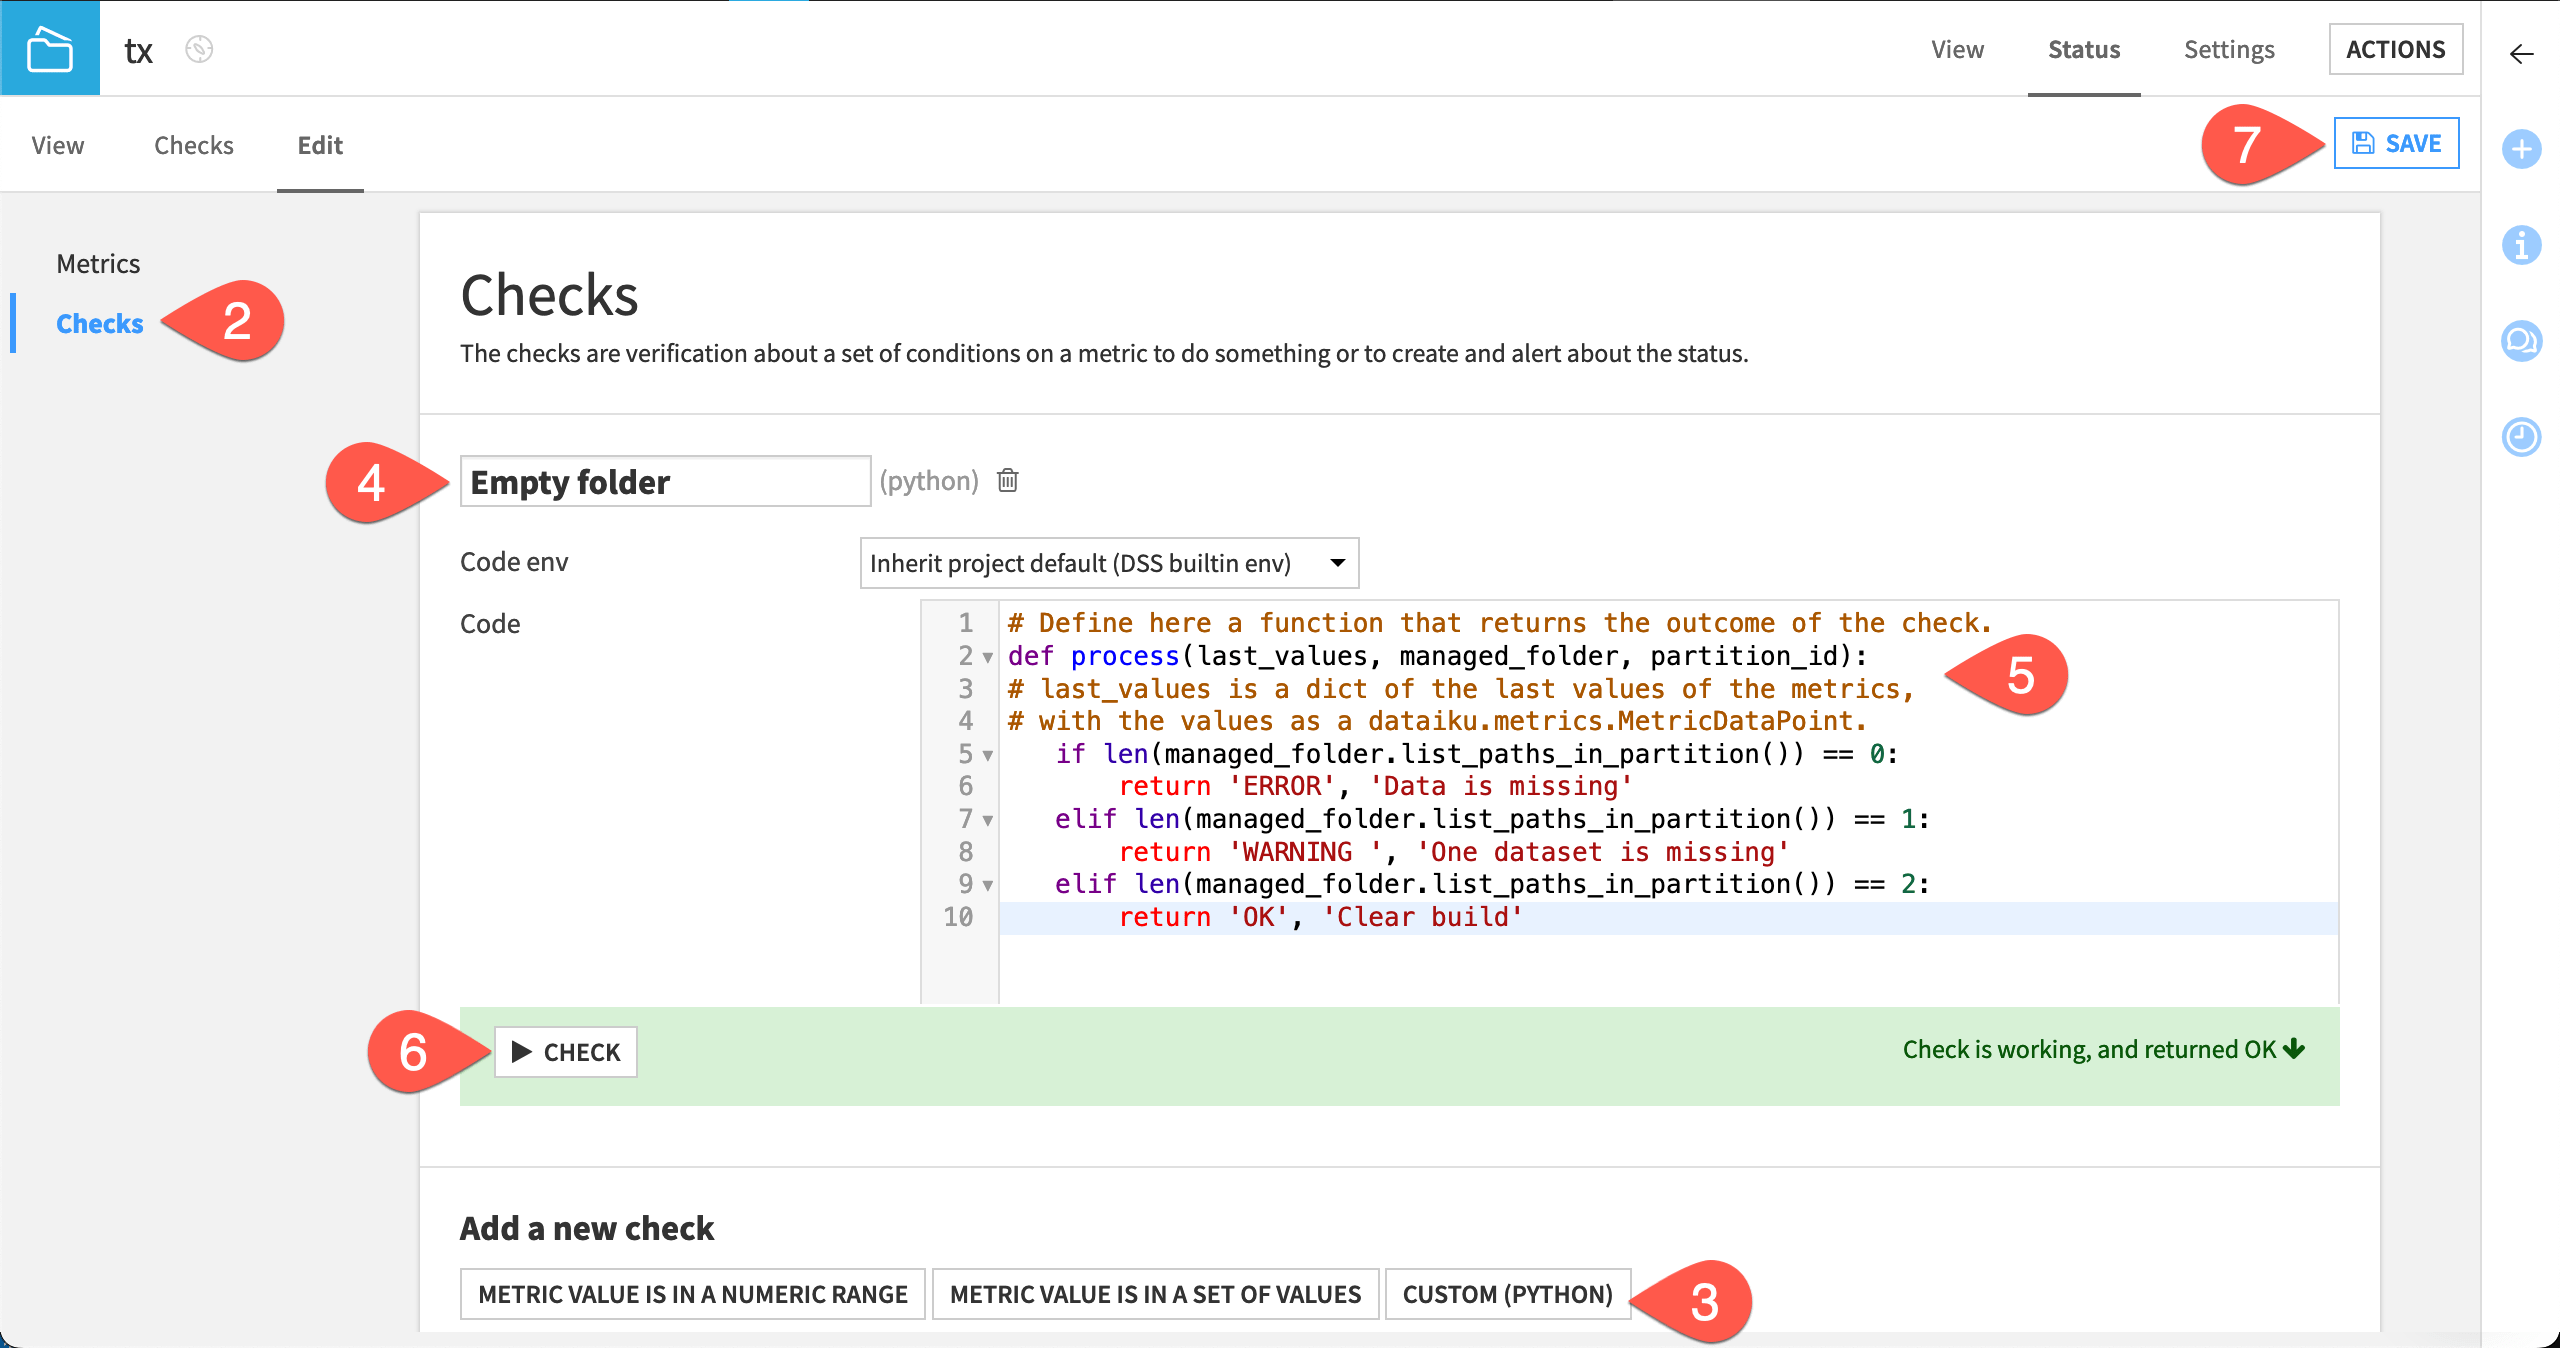
Open the tx folder.
Navigate to Status > Edit > Checks.
Under Add a New Check, click Custom (Python).
Enter
Empty folderas the name of the check.Copy/paste the code below into the editor:
# Define here a function that returns the outcome of the check.
def process(last_values, managed_folder, partition_id):
# last_values is a dict of the last values of the metrics,
# with the values as a dataiku.metrics.MetricDataPoint.
   if len(managed_folder.list_paths_in_partition()) == 0:
       return 'ERROR', 'Data is missing'
   elif len(managed_folder.list_paths_in_partition()) == 1:
       return 'WARNING ', 'One dataset is missing'
   elif len(managed_folder.list_paths_in_partition()) == 2:
       return 'OK', 'Clear build'
Click Check to confirm it returns OK.
Click Save.
Note
The code calls the length of the folder and checks on it. You can play with various methods of the managed folders to create new checks. The Developer Guide contains the complete Python API reference for managed folders.
Display checks#
To display your checks:
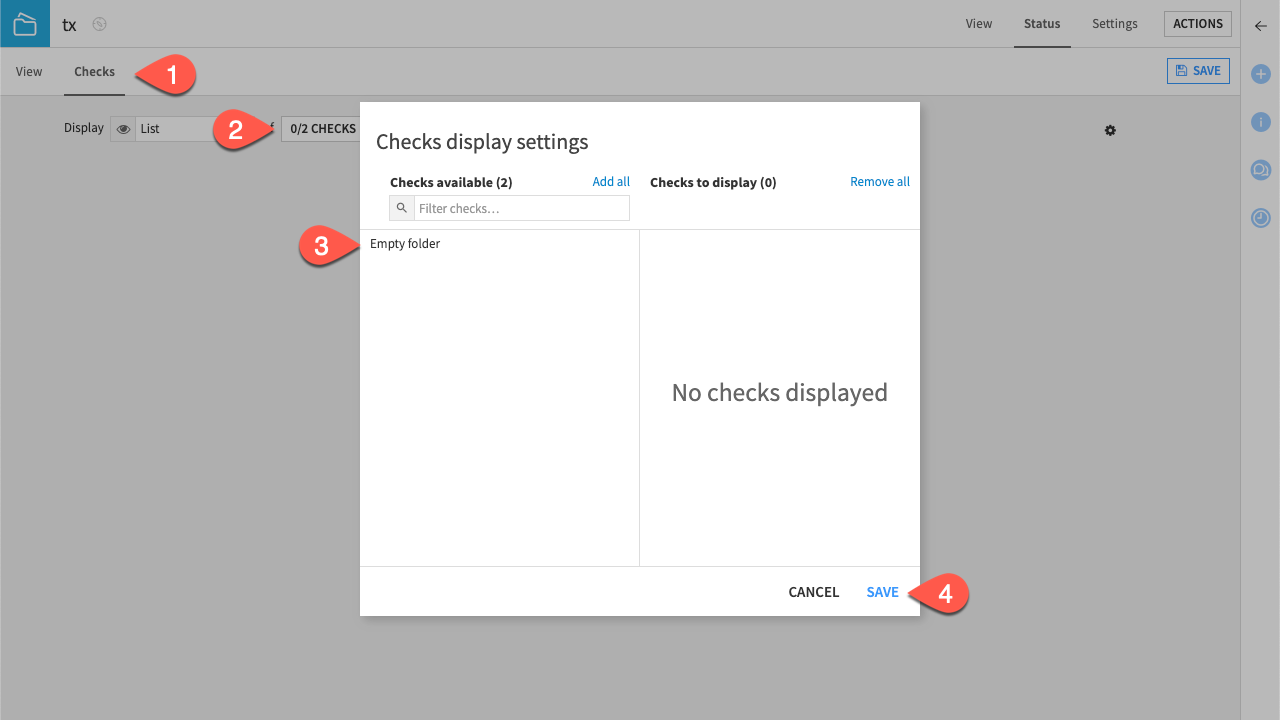
Navigate to the Check subtab.
Click X/Y Checks.
Click on the Empty folder check.
Click Save.
Tip
If your folder has the two files as expected, your check should be displaying an OK status.
Test checks#
Test if the check is working. To do so:
Navigate to the View tab of the tx folder.
Download one of the CSV files in the folder.
Delete the CSV file you downloaded from the folder.
Delete one of the files by clicking on the bin (
) (be sure to download it before, so you can upload it back).
Navigate back to Status > Checks.
Click Compute.
Tip
You should see a Warning with the message saying One dataset is missing.
Optional: Create custom Python data quality rules#
Warning
Dataiku introduced data quality rules in versions 12.6+ to allow users to monitor the status of datasets.
Add a Python rule#
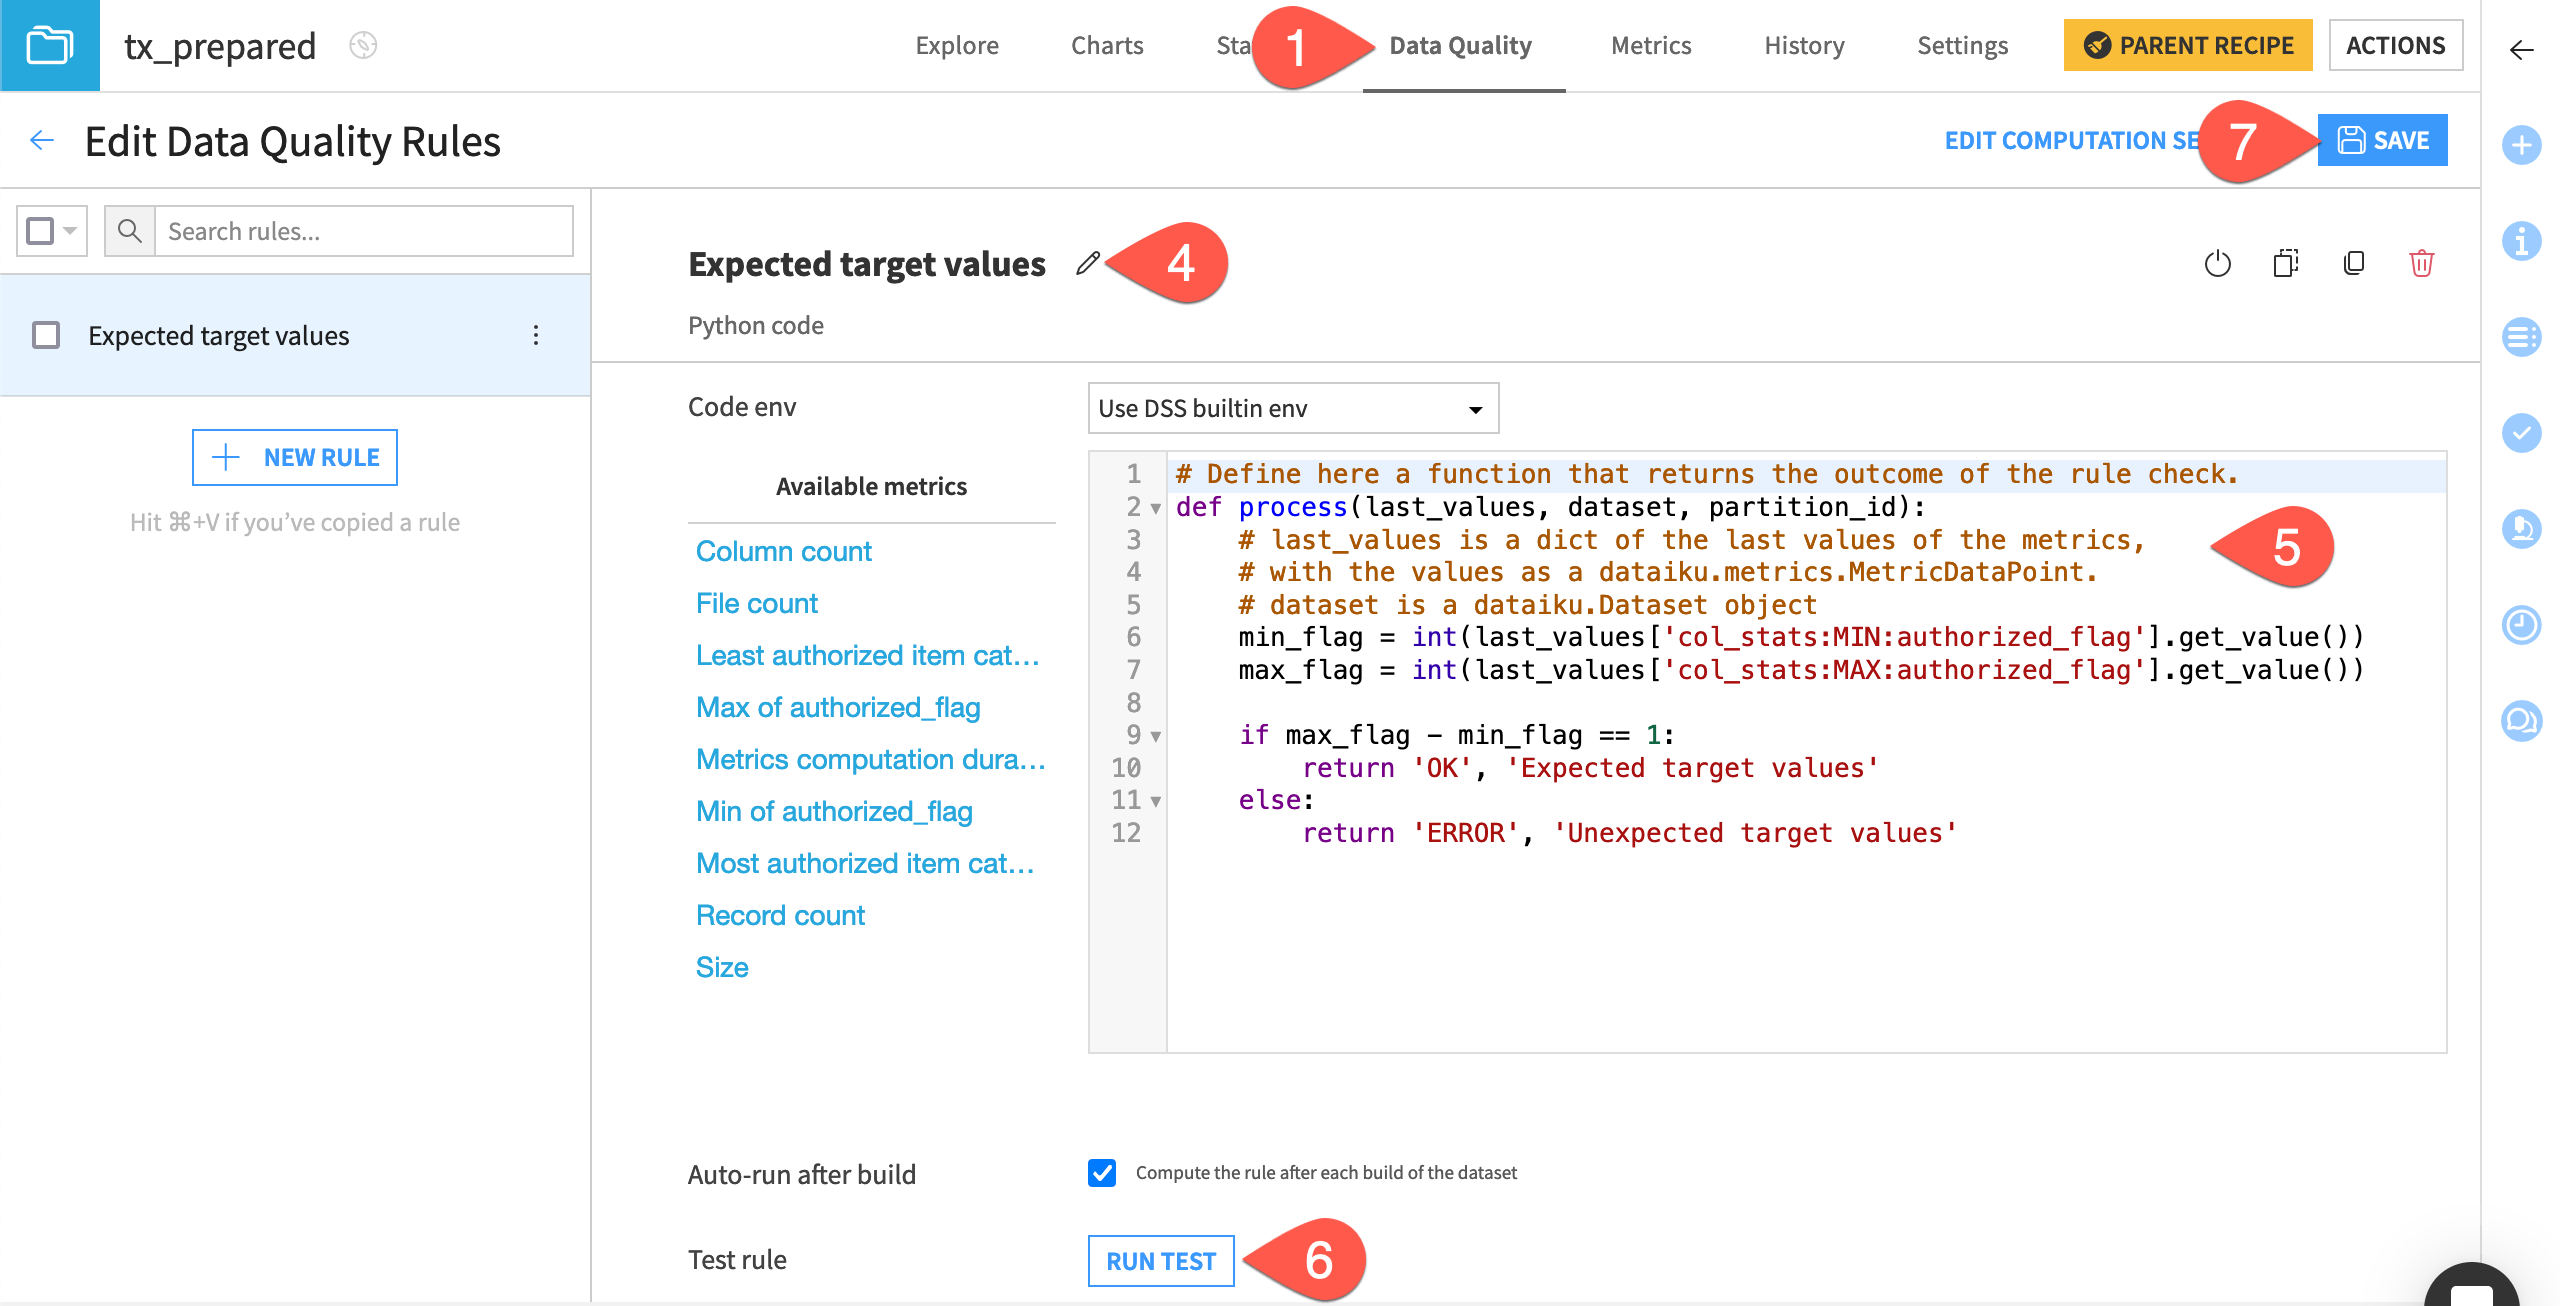
Navigating back to the tx_prepared dataset, now let’s create a custom data quality rule to check that the difference between the maximum and minimum values of the column authorized_flag is 1.
Navigate to the Data Quality tab of the tx_prepared dataset.
Click Edit Rules.
Scroll down or search for the Python code rule type.
Click on the pencil (
) icon to name the rule
Expected target values. Note that rule names aren’t auto-generated for Python rules.Copy-paste the code block below.
# Define here a function that returns the outcome of the rule check.
def process(last_values, dataset, partition_id):
    # last_values is a dict of the last values of the metrics,
    # with the values as a dataiku.metrics.MetricDataPoint.
    # dataset is a dataiku.Dataset object
    min_flag = int(last_values['col_stats:MIN:authorized_flag'].get_value())
    max_flag = int(last_values['col_stats:MAX:authorized_flag'].get_value())

    if max_flag - min_flag == 1:
        return 'OK', 'Expected target values'
    else:
        return 'ERROR', 'Unexpected target values'
Click Run Test to confirm that it returns OK.
Then Save.
Tip
You can insert the syntax referencing any available metric, including Python metrics, from the list on the left.
View data quality#
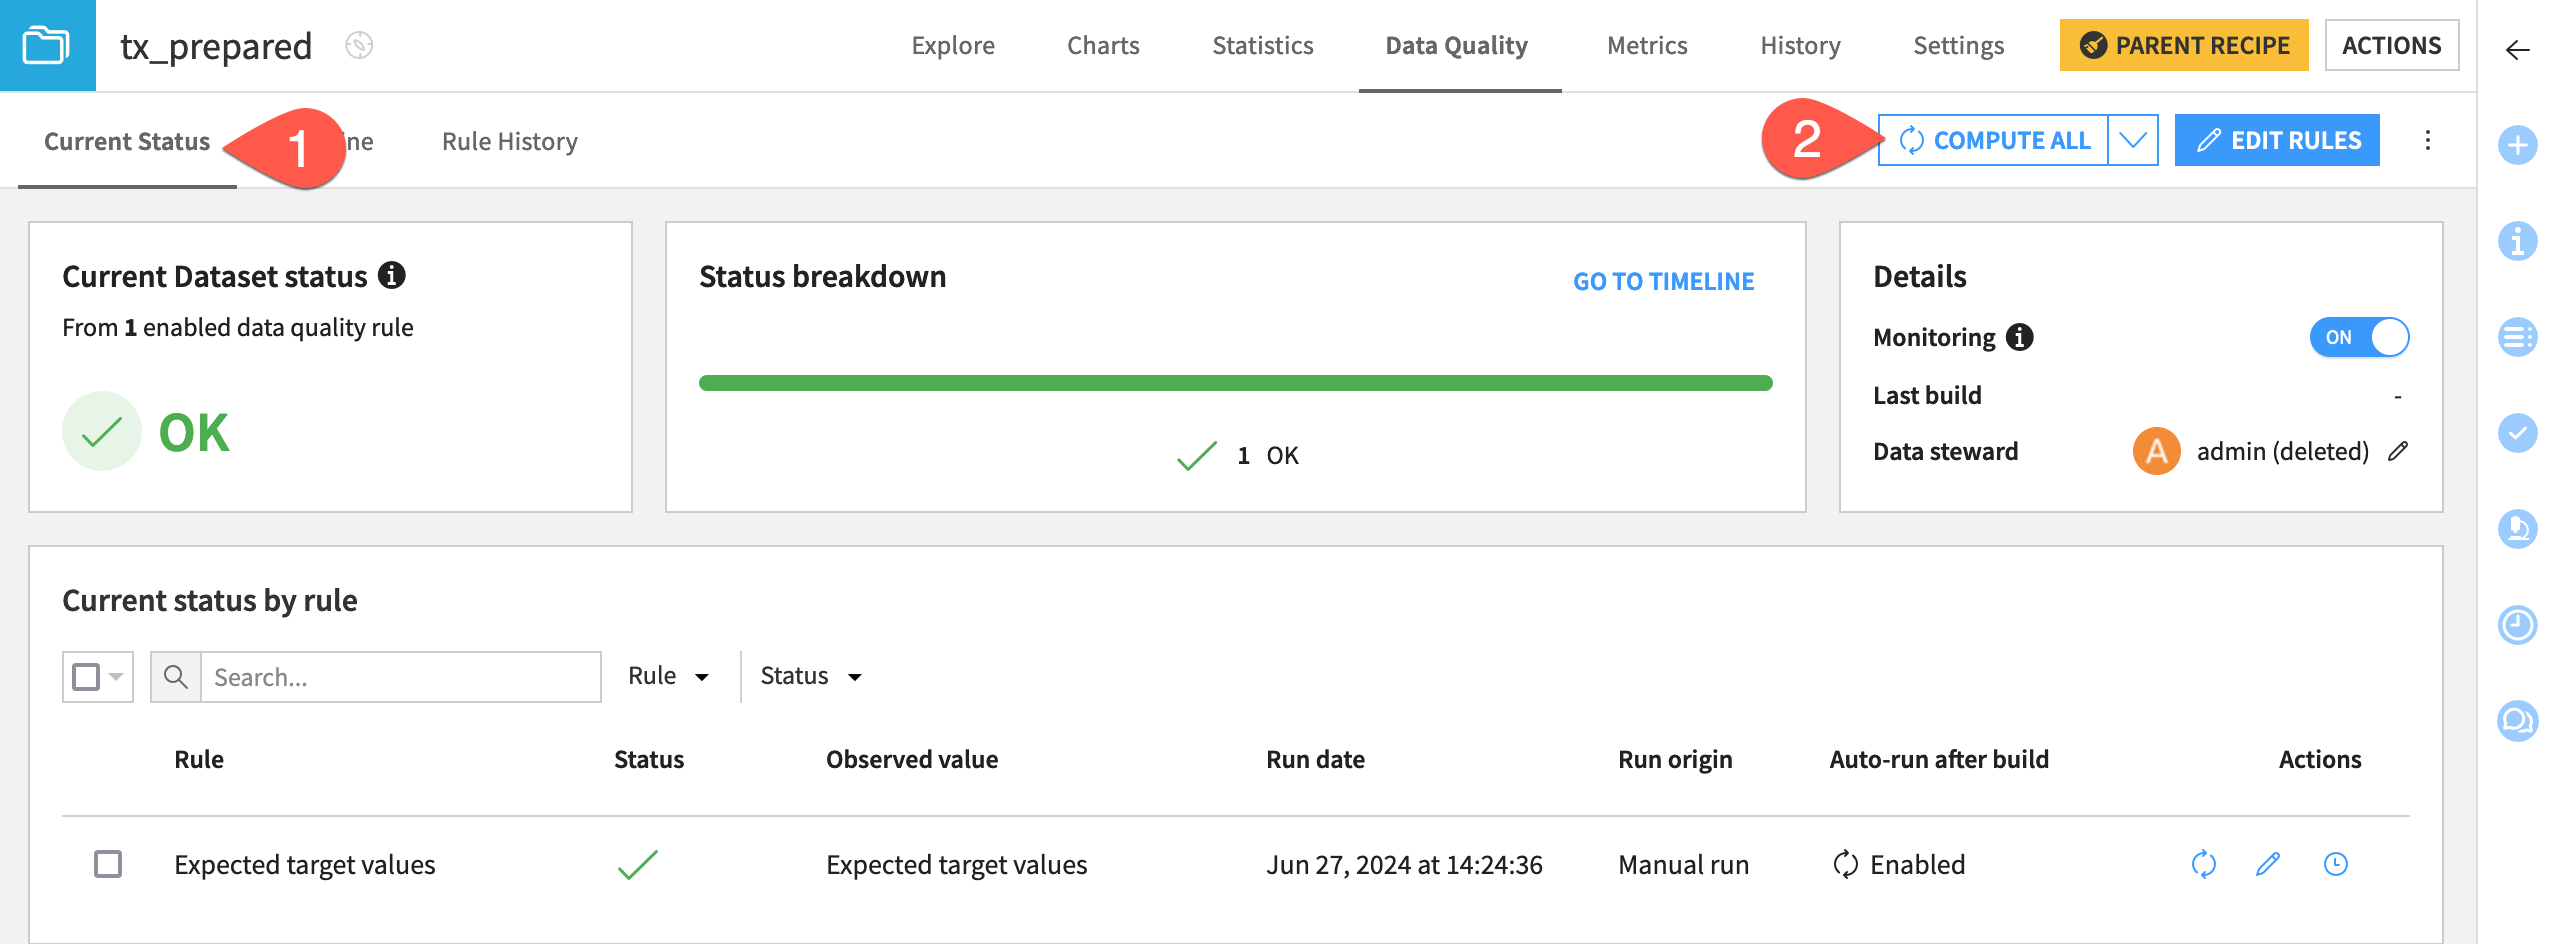
You’re now ready to compute the status of the data quality rules and view the results.
Navigate back to the Current Status tab view with the arrow near Edit Data Quality Rules.
Click Compute All.
Next steps#
Congratulations on learning how to customize metrics, checks, and data quality rules with Python!
Next, you may want to learn how to introduce custom Python steps to your automation scenarios by following Tutorial | Custom script scenarios.

