Understand the model#
When satisfied with the design of the model, return to the Results tab.
Dataiku provides model metrics auto-magically! For example, we can compare how models performed against each other. By default, the AUC is graphed for each model. By that metric, random forest has performed better than logistic regression.
Switch from the Sessions view to the Table view to see a side-by-side comparison of model performance across a number of metrics.
Note
For more detail, we could also create a model comparison.

In this case, random forest has performed better across a number of different metrics. Let’s explore this model in greater detail.
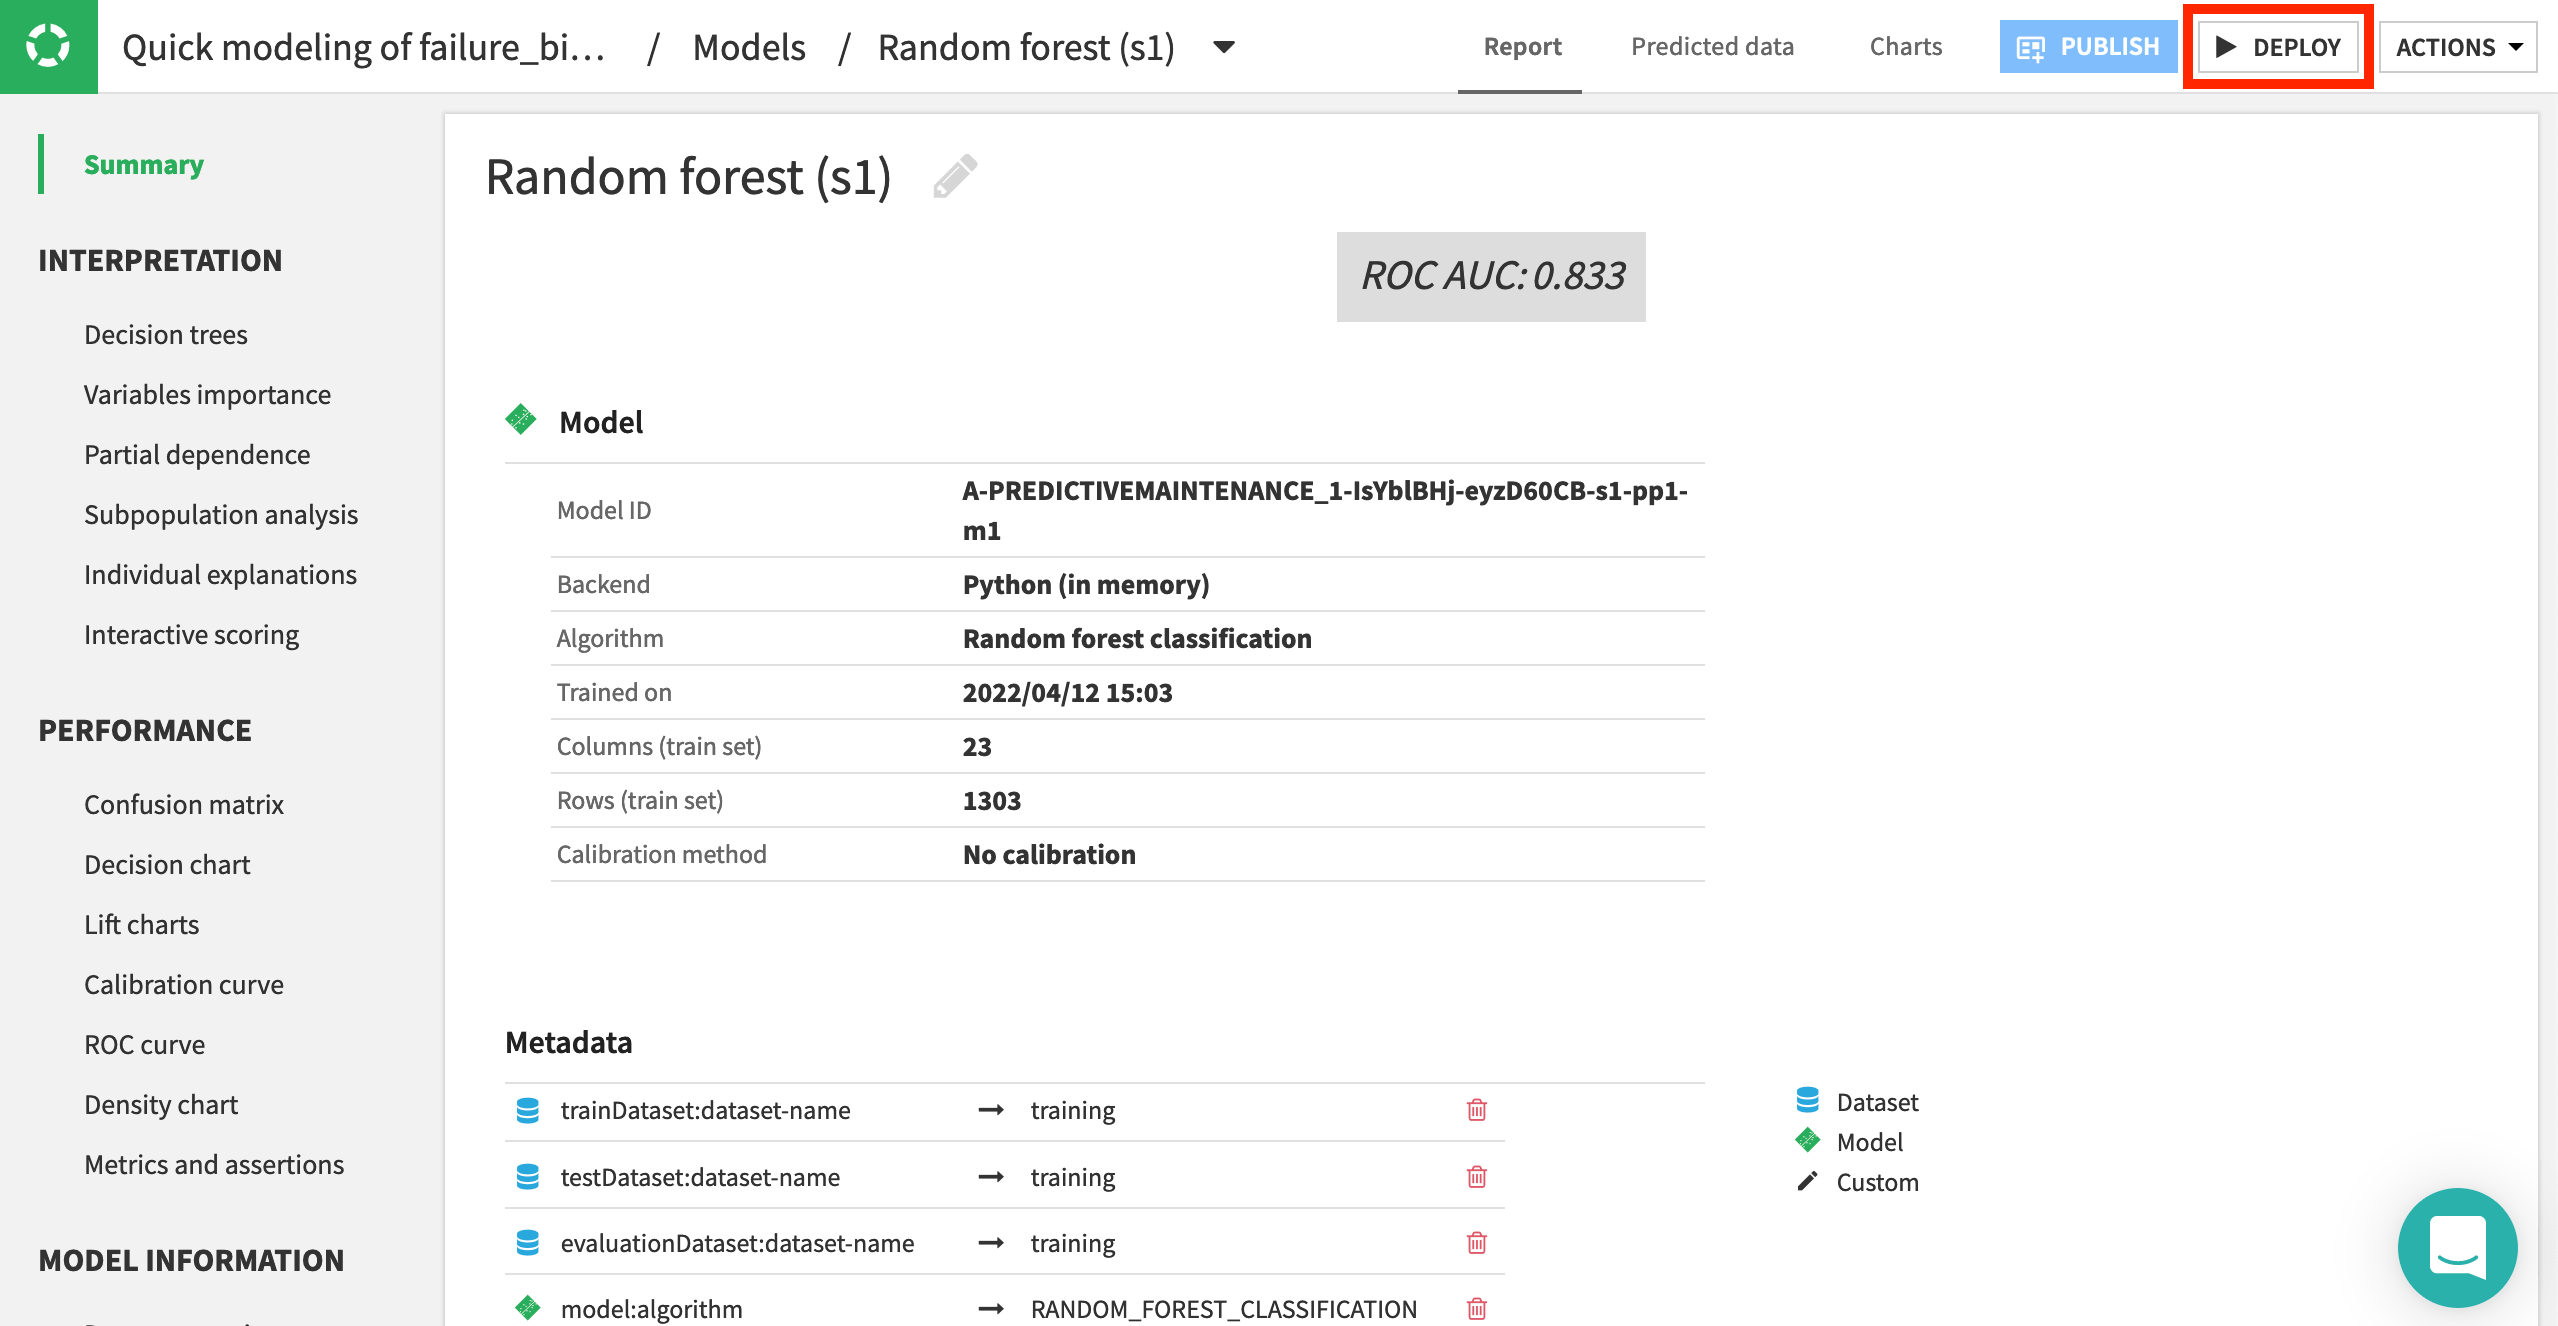
Click on the name of the model to view a more detailed report into the model’s interpretation, performance, and training information.

Note
Feel free to explore any of these panes to learn more about the model at hand.
You can learn more about prediction results in the reference documentation.

