
Tutorial | Automation scenarios#
Get started#
Scenarios are the main tool for automating actions in Dataiku, such as rebuilding datasets or retraining models. Let’s see how they work!
Objectives#
In this tutorial, you will:
Create a scenario to automate actions in Dataiku.
Add triggers to control the timing of a scenario’s execution.
Understand how to use a combination of metrics, checks, and/or data quality rules to control the logic of a scenario’s actions.
See also
This tutorial walks through creating a step-based scenario. Although this type of scenario can include custom Python and SQL steps, it’s also possible to create custom scenarios entirely in Python.
Prerequisites#
To reproduce the steps in this tutorial, you’ll need:
Dataiku 12.6 or later.
Basic knowledge of Dataiku (Core Designer level or equivalent).
For those interested, this tutorial also includes an optional exercise for SQL triggers. To complete this, you’ll also need a supported SQL connection.
Create the project#
From the Dataiku Design homepage, click + New Project.
Select Learning projects.
Search for and select Automation Scenarios.
If needed, change the folder into which the project will be installed, and click Create.
From the project homepage, click Go to Flow (or type
g+f).
Note
You can also download the starter project from this website and import it as a ZIP file.
Use case summary#
The project has three data sources:
Dataset |
Description |
|---|---|
tx |
Each row is a unique credit card transaction with information such as the card that was used and the merchant where the transaction was made. It also indicates whether the transaction has either been:
|
merchants |
Each row is a unique merchant with information such as the merchant’s location and category. |
cards |
Each row is a unique credit card ID with information such as the card’s activation month or the cardholder’s FICO score (a common measure of creditworthiness in the US). |
Create a scenario#
Consider the final dataset at the end of a pipeline. It may be the key input to a dashboard, webapp, or Dataiku app. It may be routinely shared with other Dataiku projects or exported to other software tools.
It’s a common need to automate the rebuilding of a dataset like this as new data becomes available at the start of a pipeline. To automate a task like this in Dataiku, you’ll want to create a scenario.
Important
This example walks through rebuilding a dataset, but the same logic applies, for example, when retraining a model or refreshing a model evaluation store.
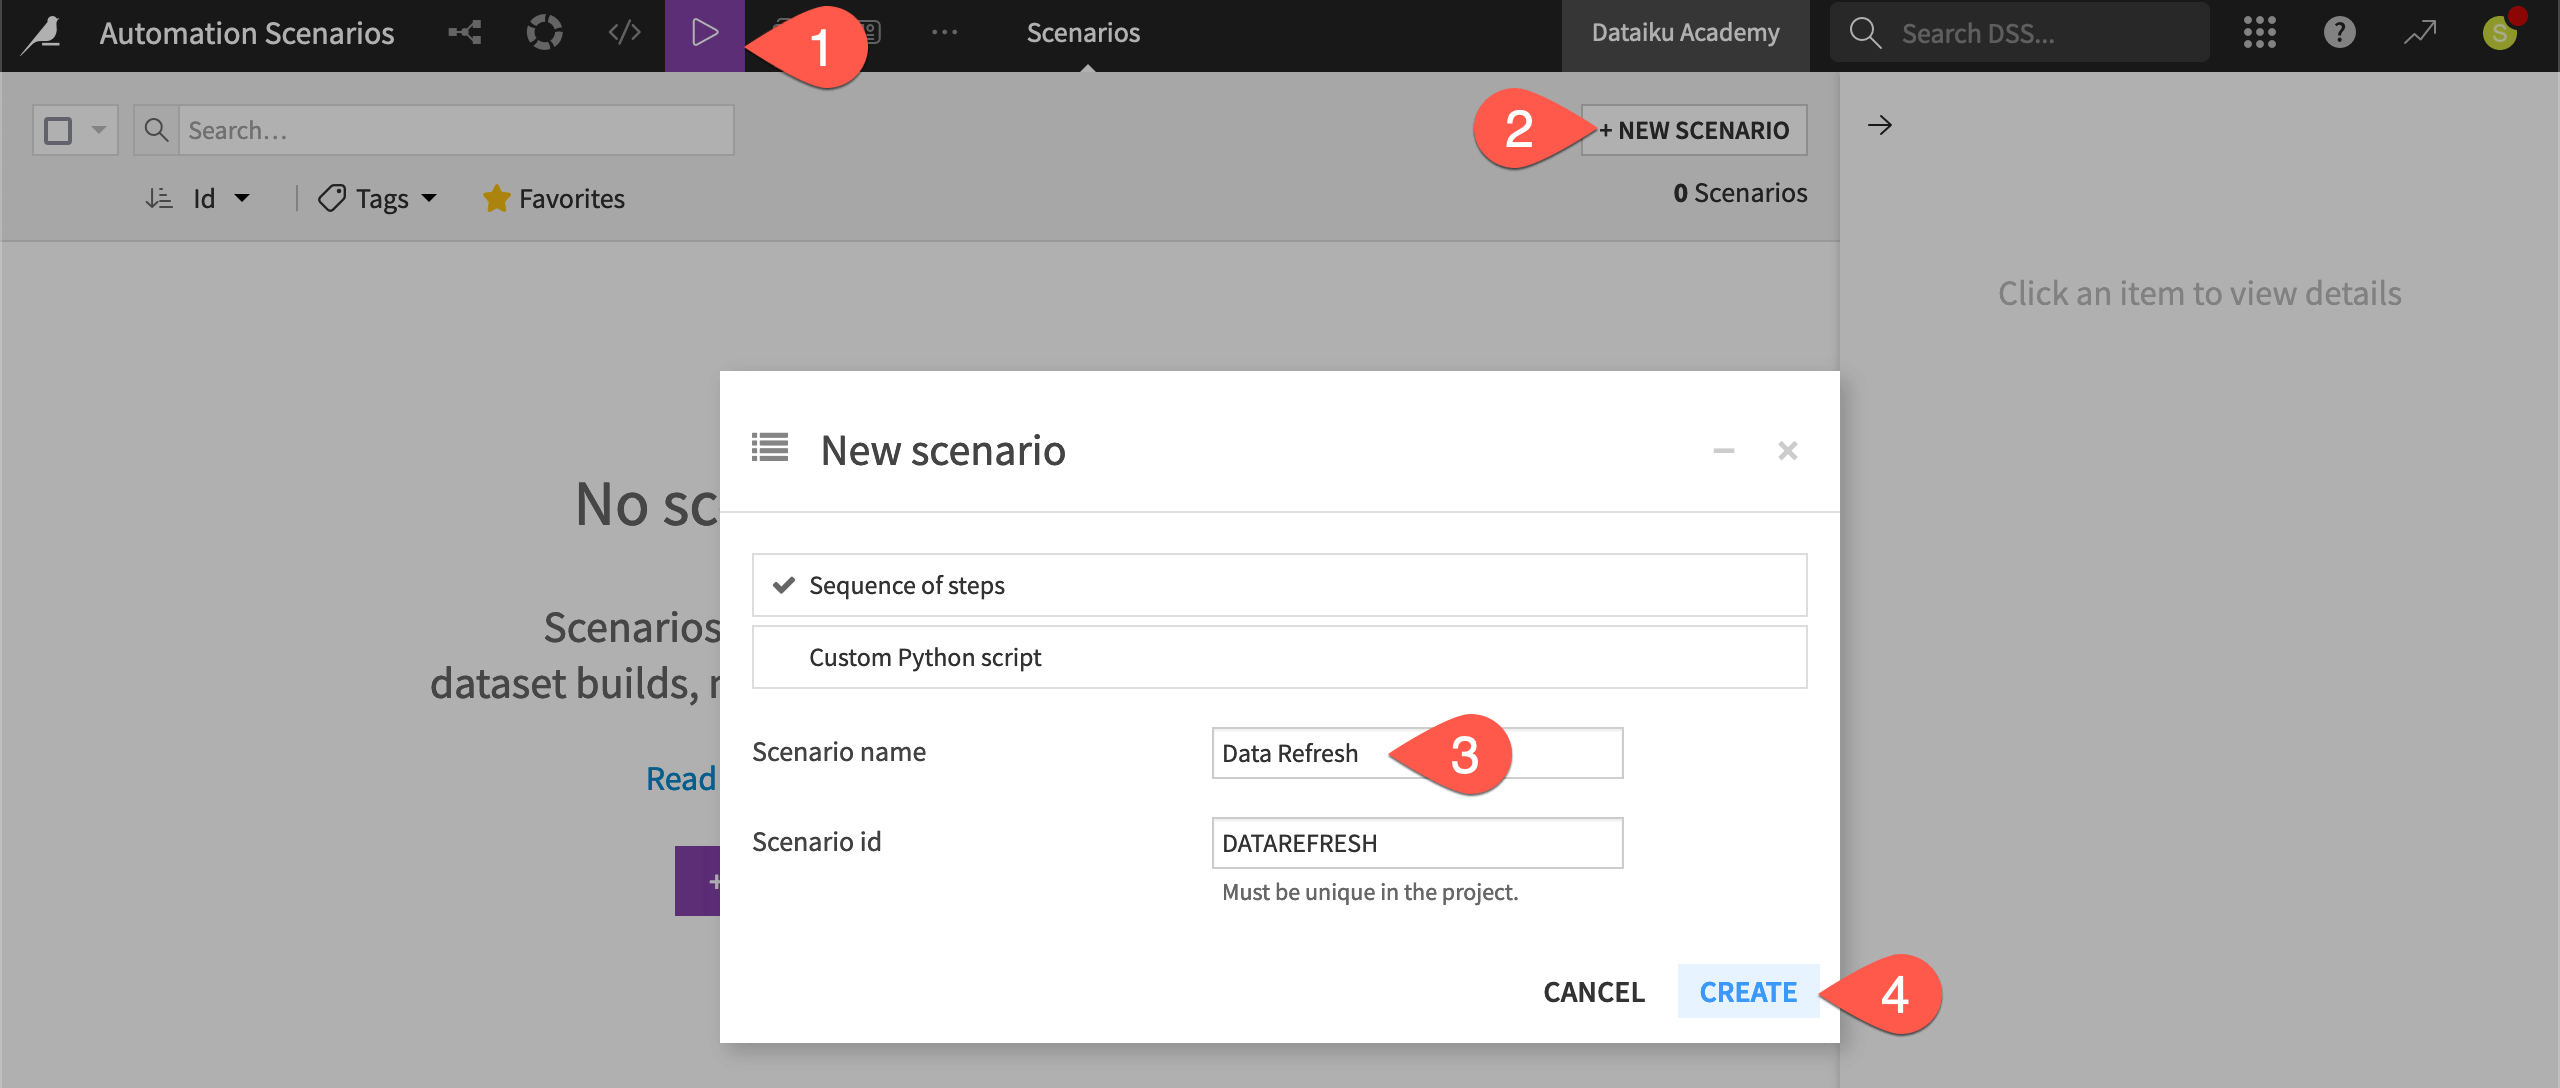
From the Jobs (
 ) menu in the top navigation bar, select Scenarios.
Click + New Scenario.
Name it
Data Refresh.Click Create.
Tip
In addition to this path, there’s a shortcut to creating scenarios for simple time-based rebuilds. Select the object in the Flow, and choose the Schedule option in the Actions tab of the right side panel.
Add steps to a scenario#
Assume tx_windows is the downstream dataset needing a rebuild. You’ll need to add that instruction to the scenario.
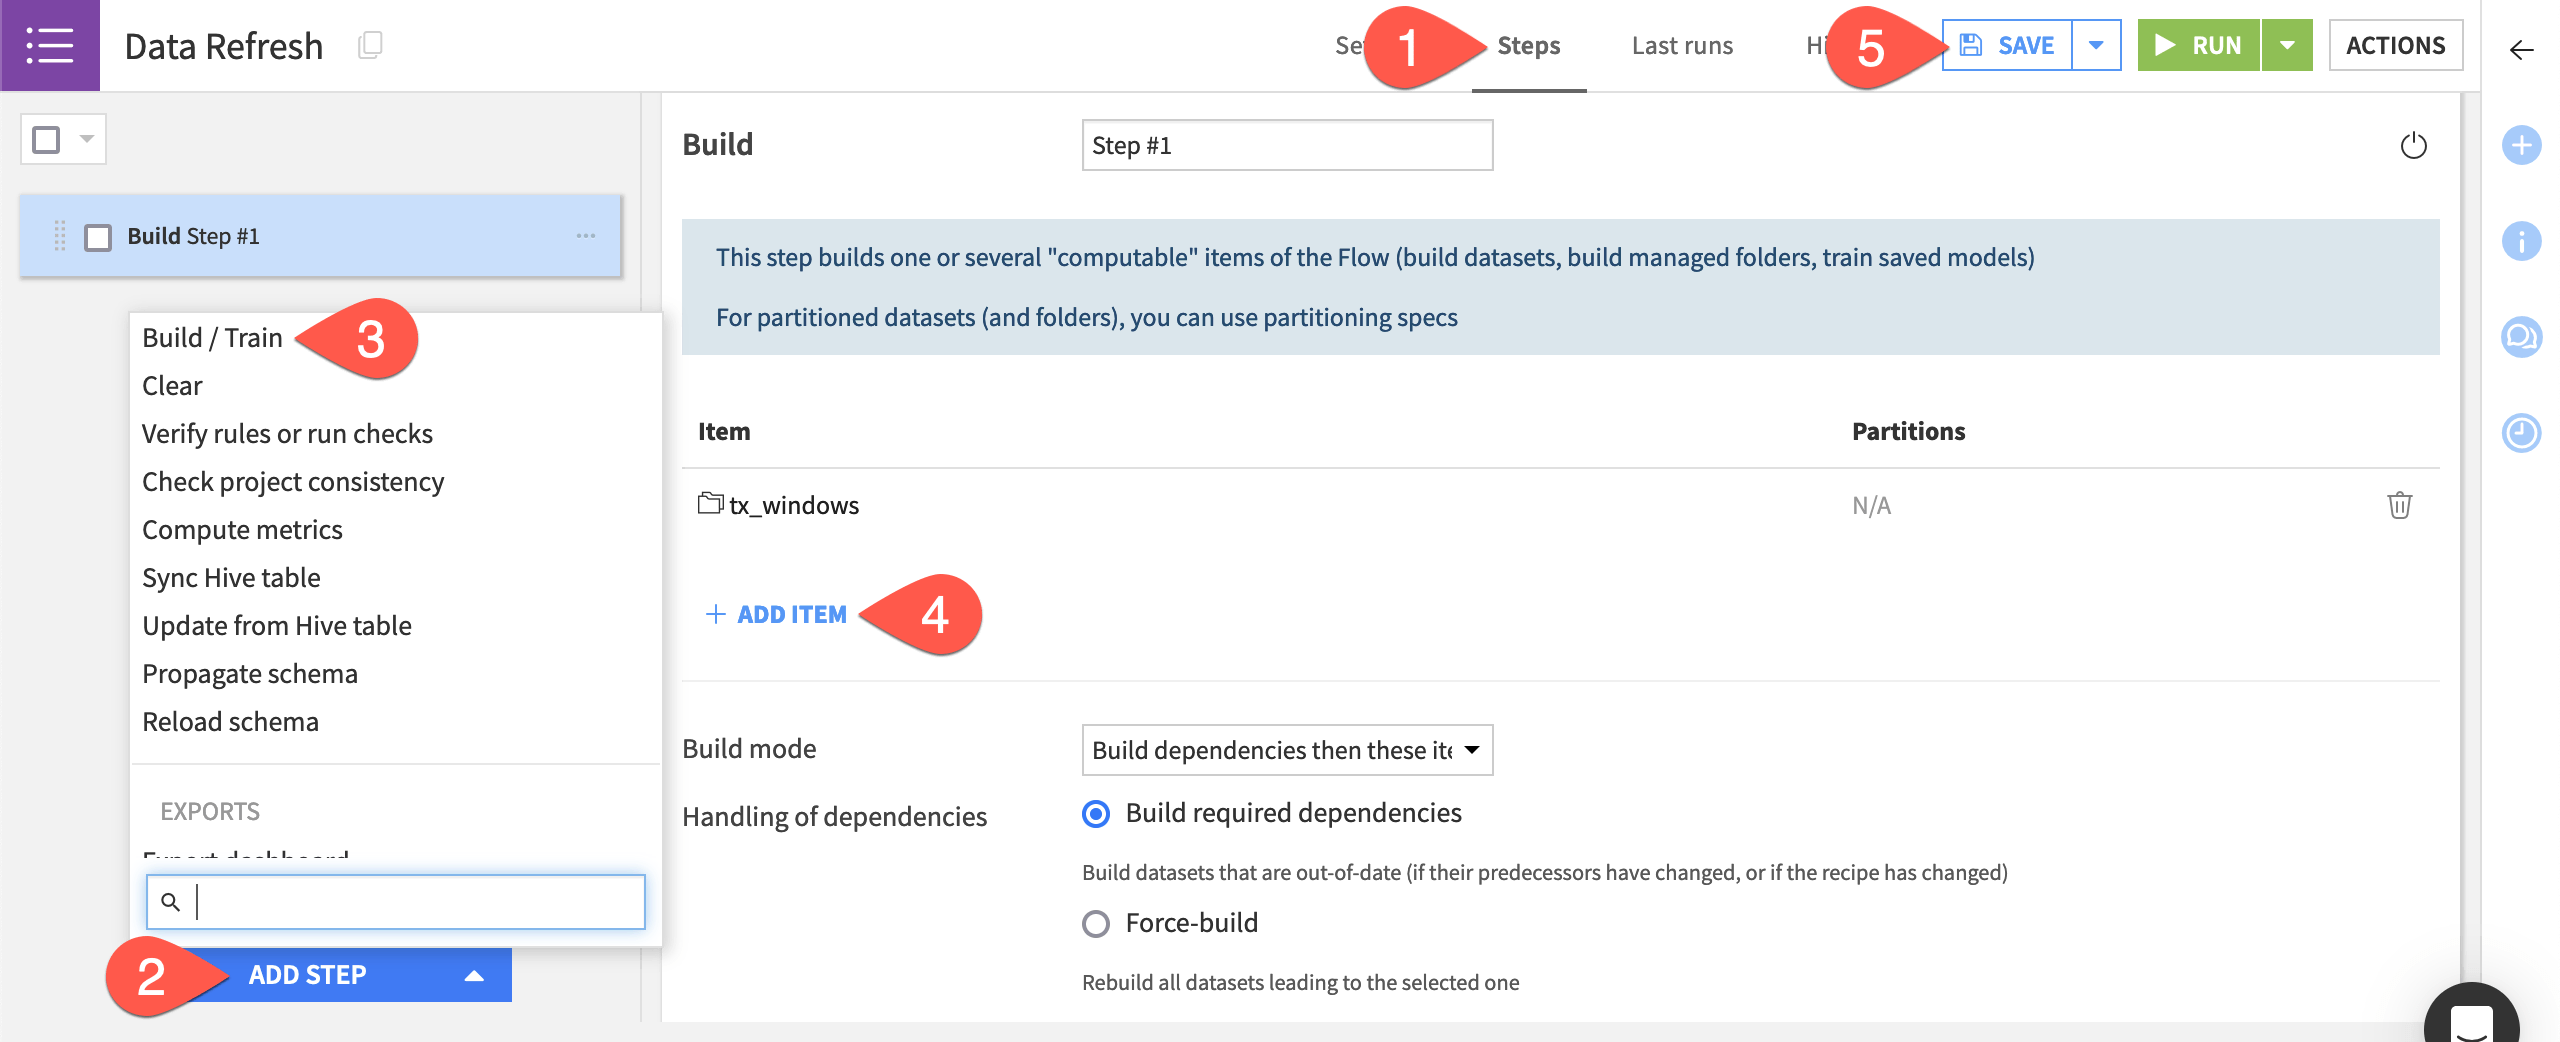
Navigate to the Steps tab of the Data Refresh scenario.
Click Add Step at the bottom left.
Select Build / Train.
Click + Add Item > Dataset > tx_windows > Add.
Click Save (or
Cmd/Ctrl+S).
Note
Here, you’re automating an upstream build of tx_windows. Using the default build mode, the dependencies of tx_windows are built first. Alternatively, you could automate a downstream (left to right) build of tx by changing the build mode to Run recipes downstream of these items. In this case though, the other downstream endpoints (tx_distinct, etc.) would also be built.
Empty the data in the Flow#
Before this first test of a scenario run, make sure the Flow is empty, except for the initial starting datasets. If not already empty, clear all data computed by Dataiku to observe the first scenario run with an empty Flow.
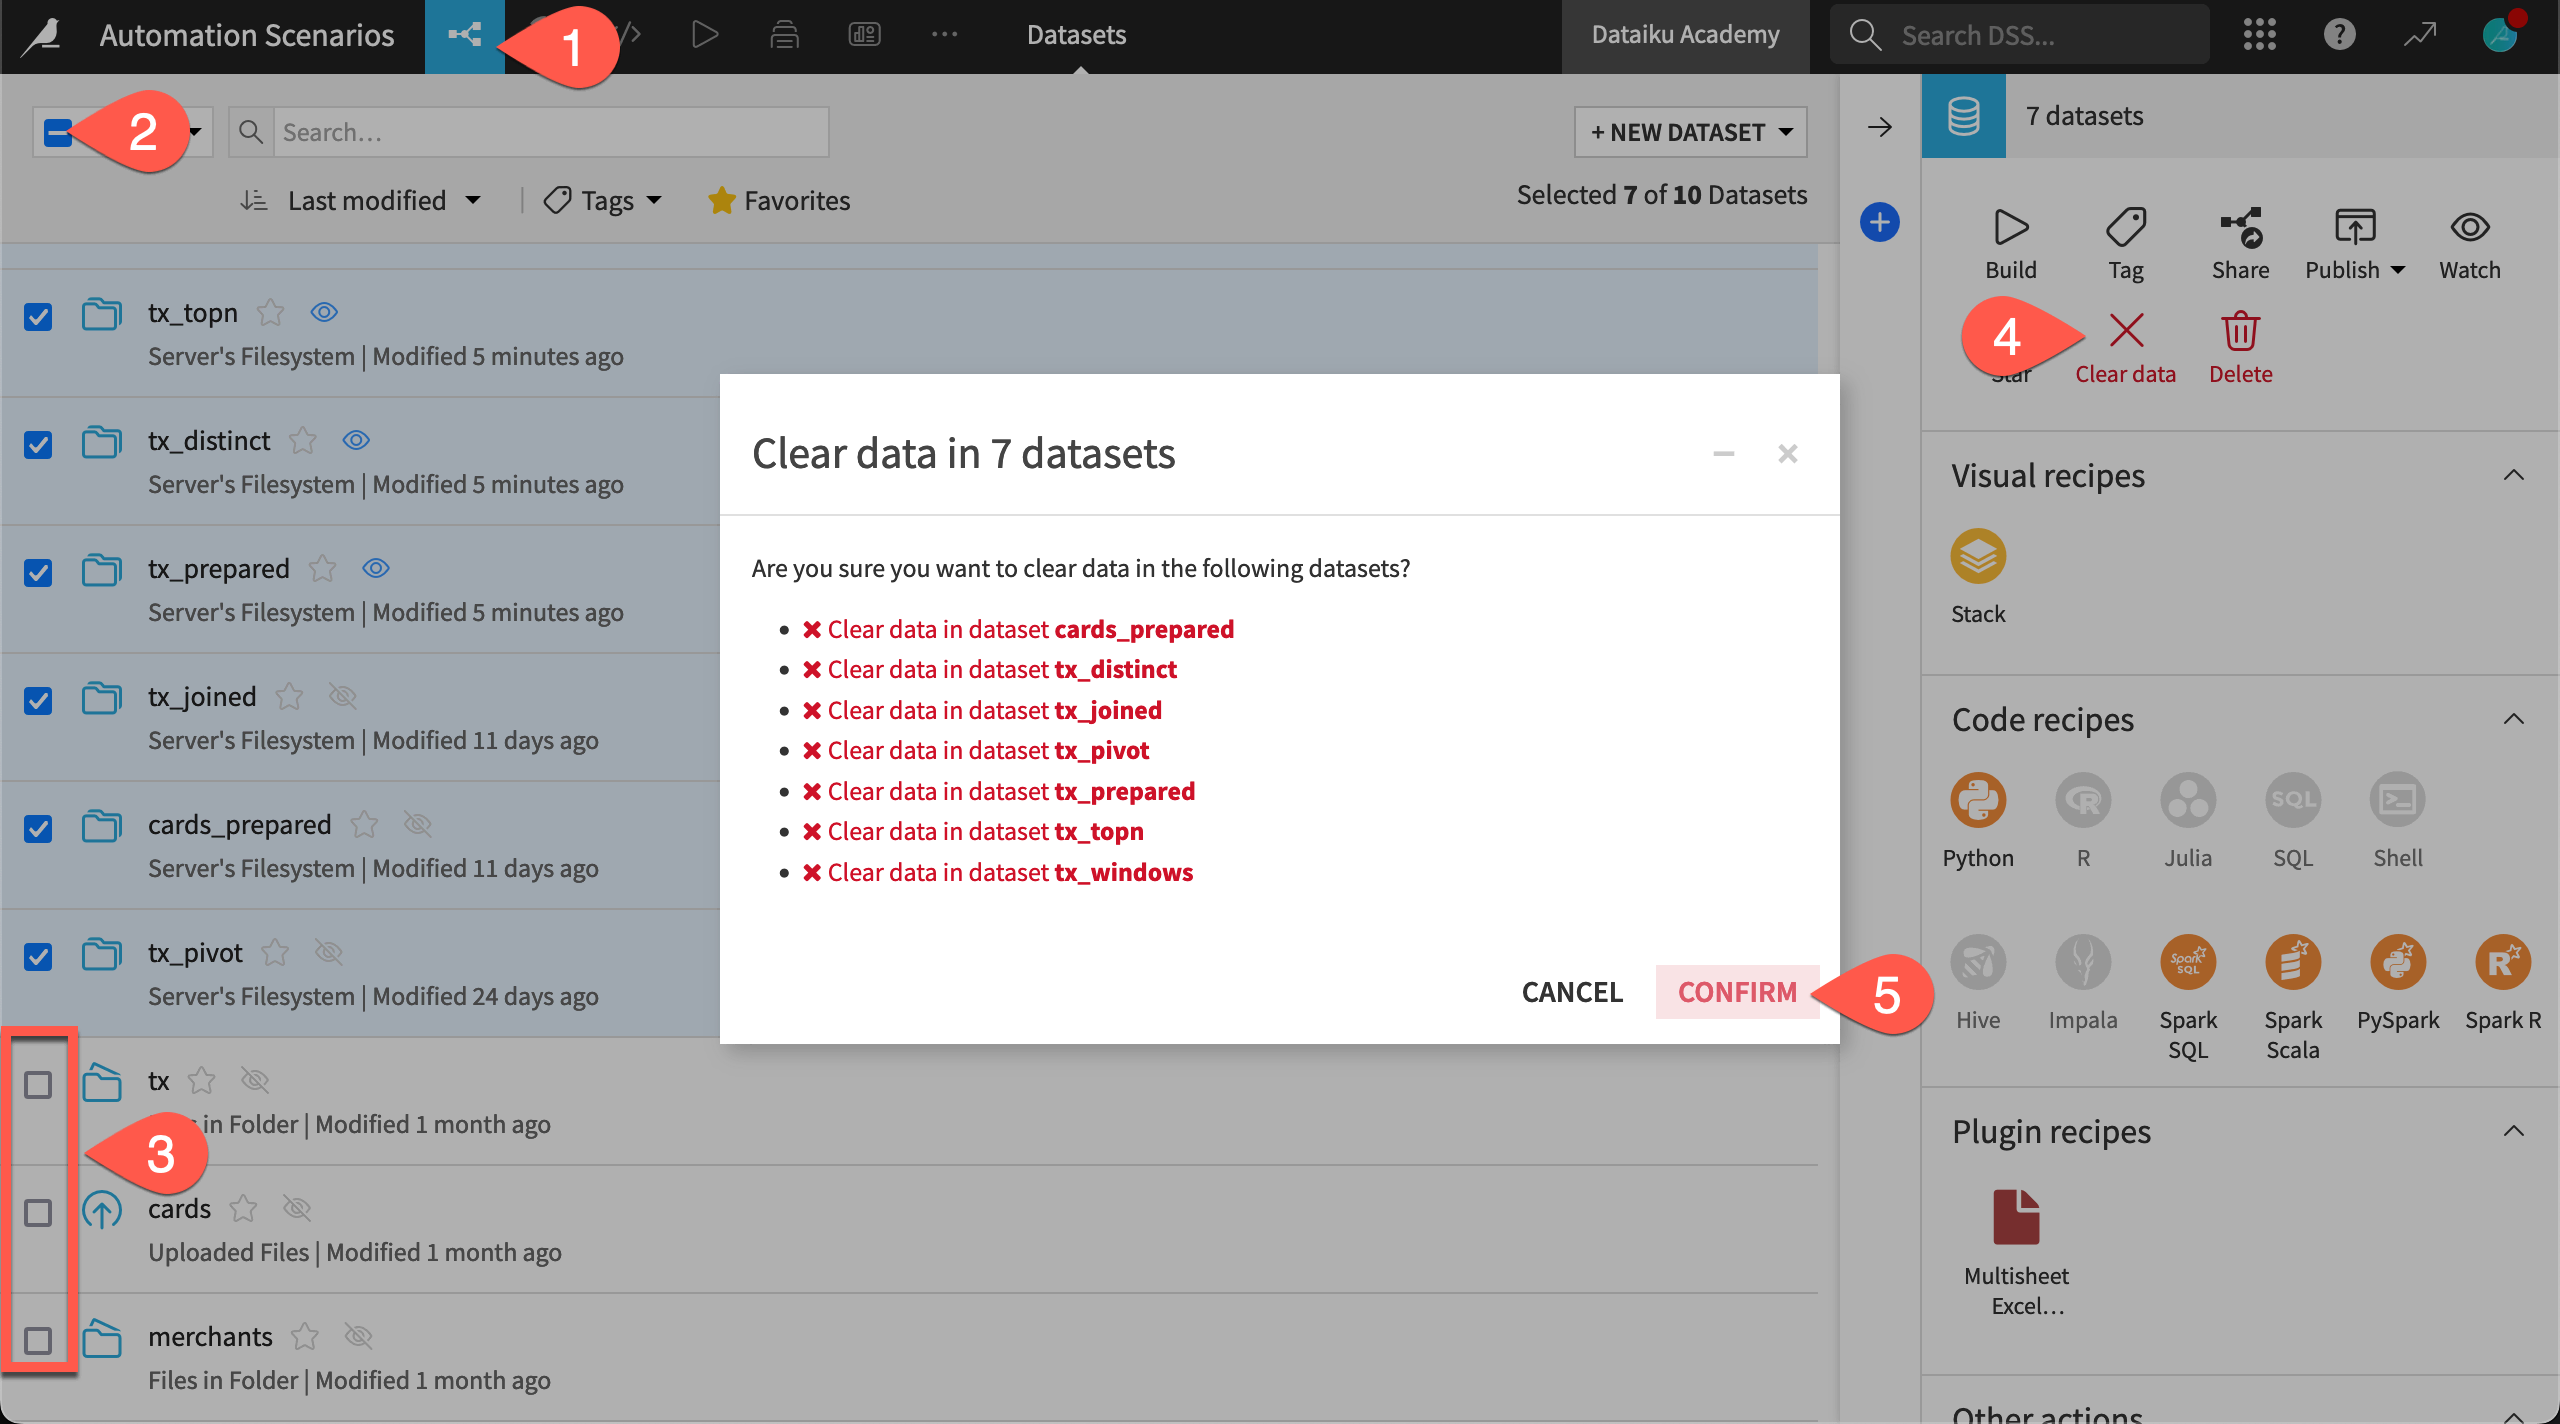
From the Flow (
 ) menu, go to the Datasets page (or
 g+d).Click the box at the top left to select all datasets.
Deselect the tx, cards, and merchants datasets.
Click Clear data in the Actions tab.
Click Confirm.
Manually run a scenario#
Without any downstream data in the Flow, manually run the scenario.
Return to the Data Refresh scenario.
Click Run near the top right.
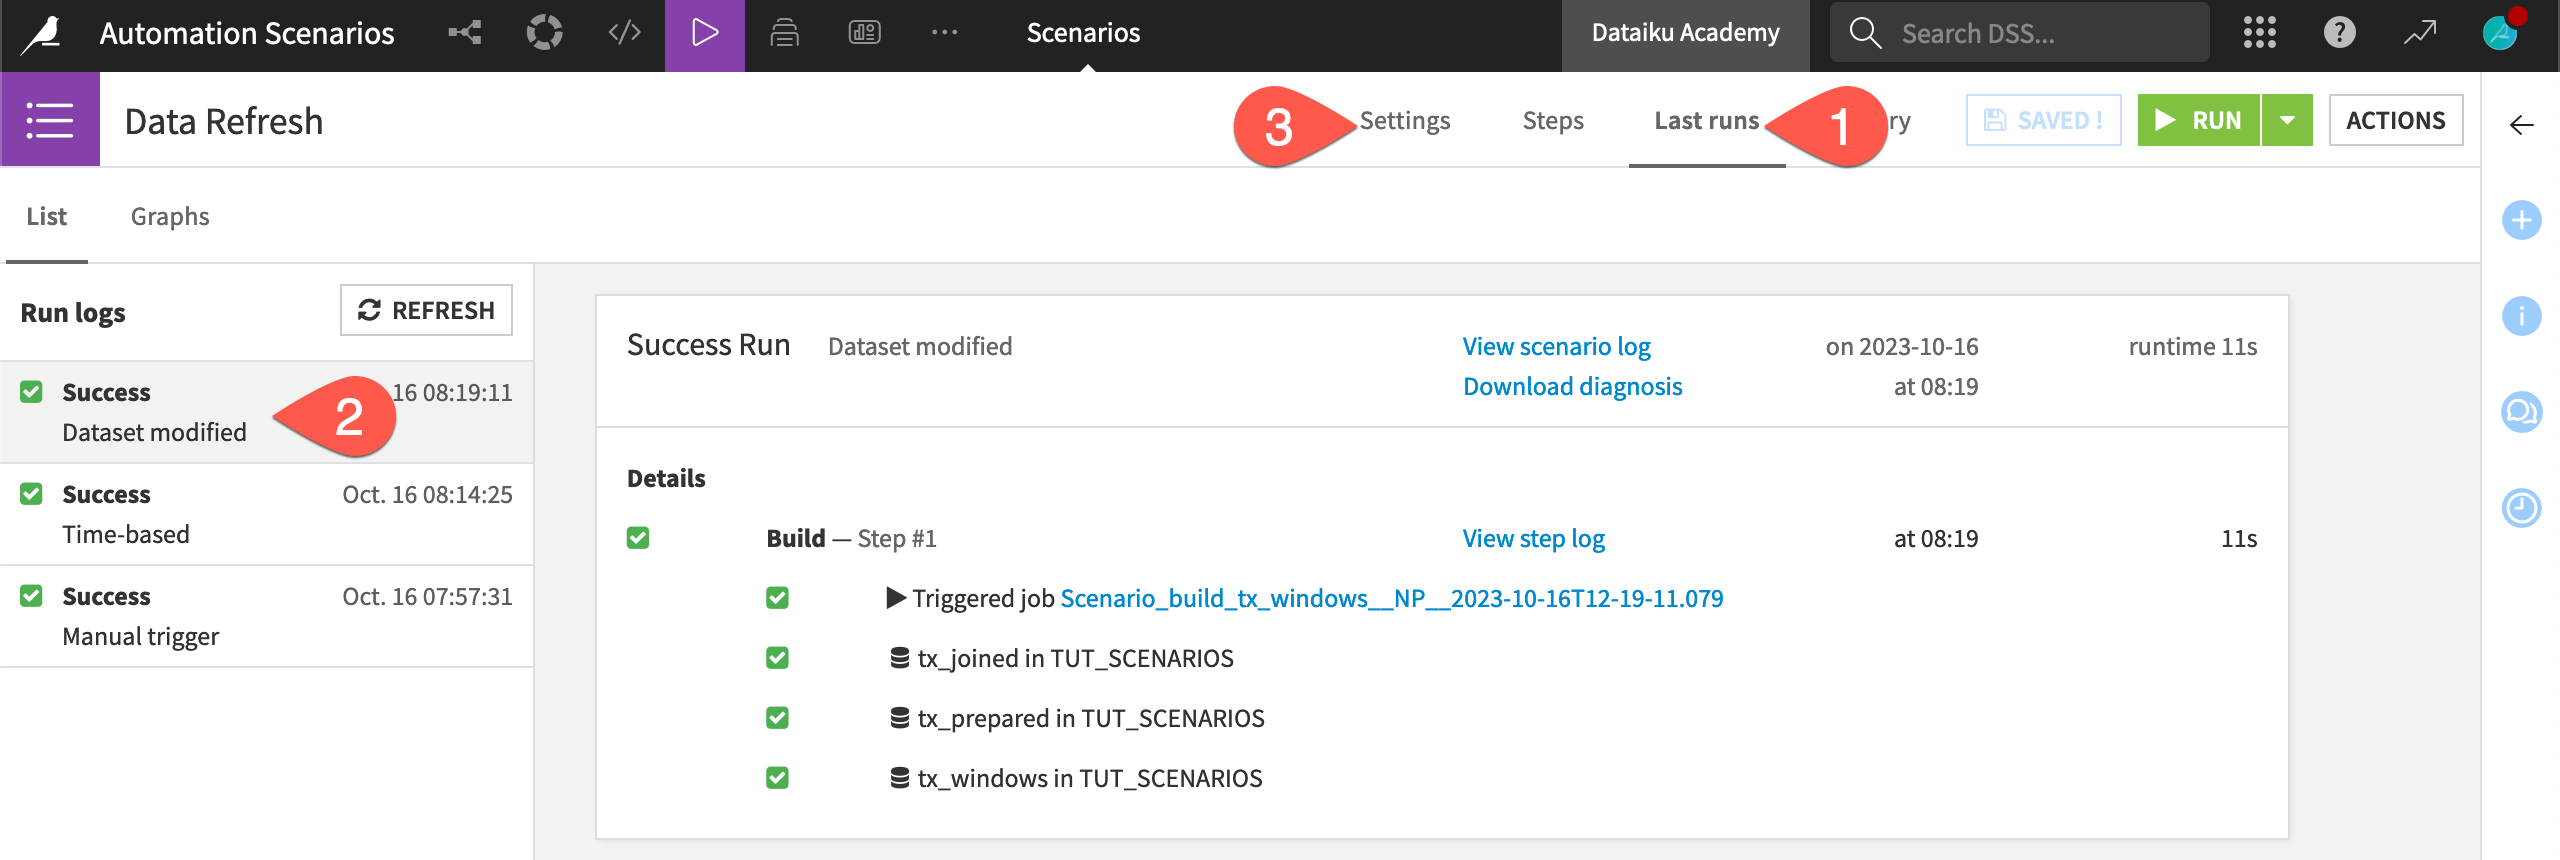
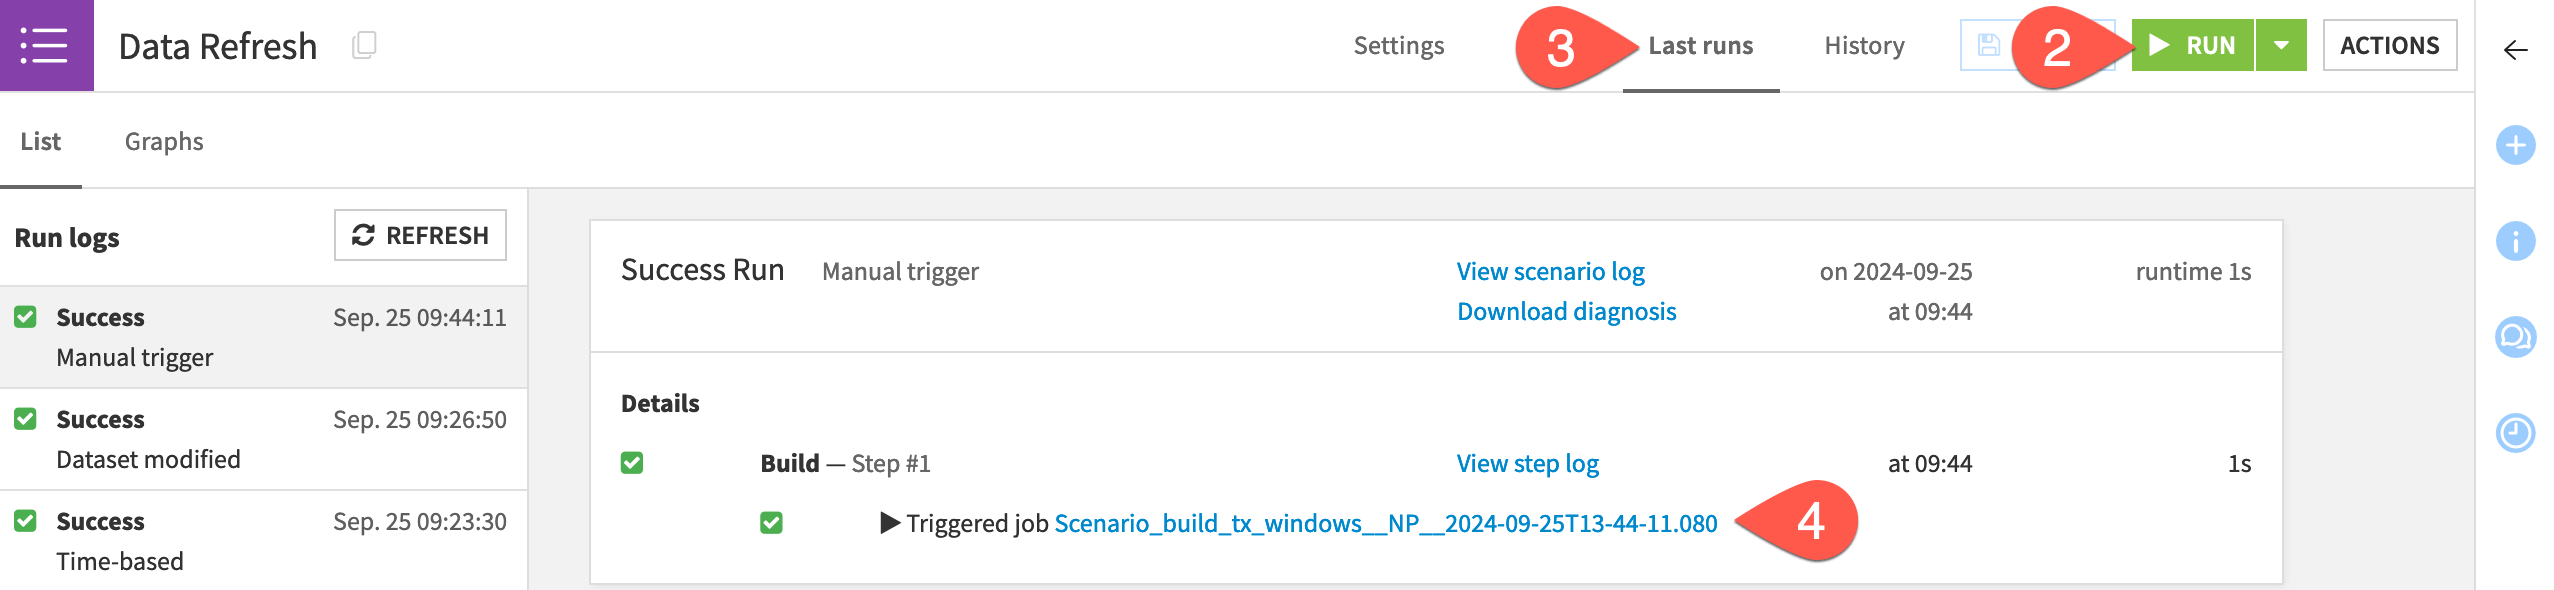
Navigate to the Last runs tab of the scenario to see what happens.
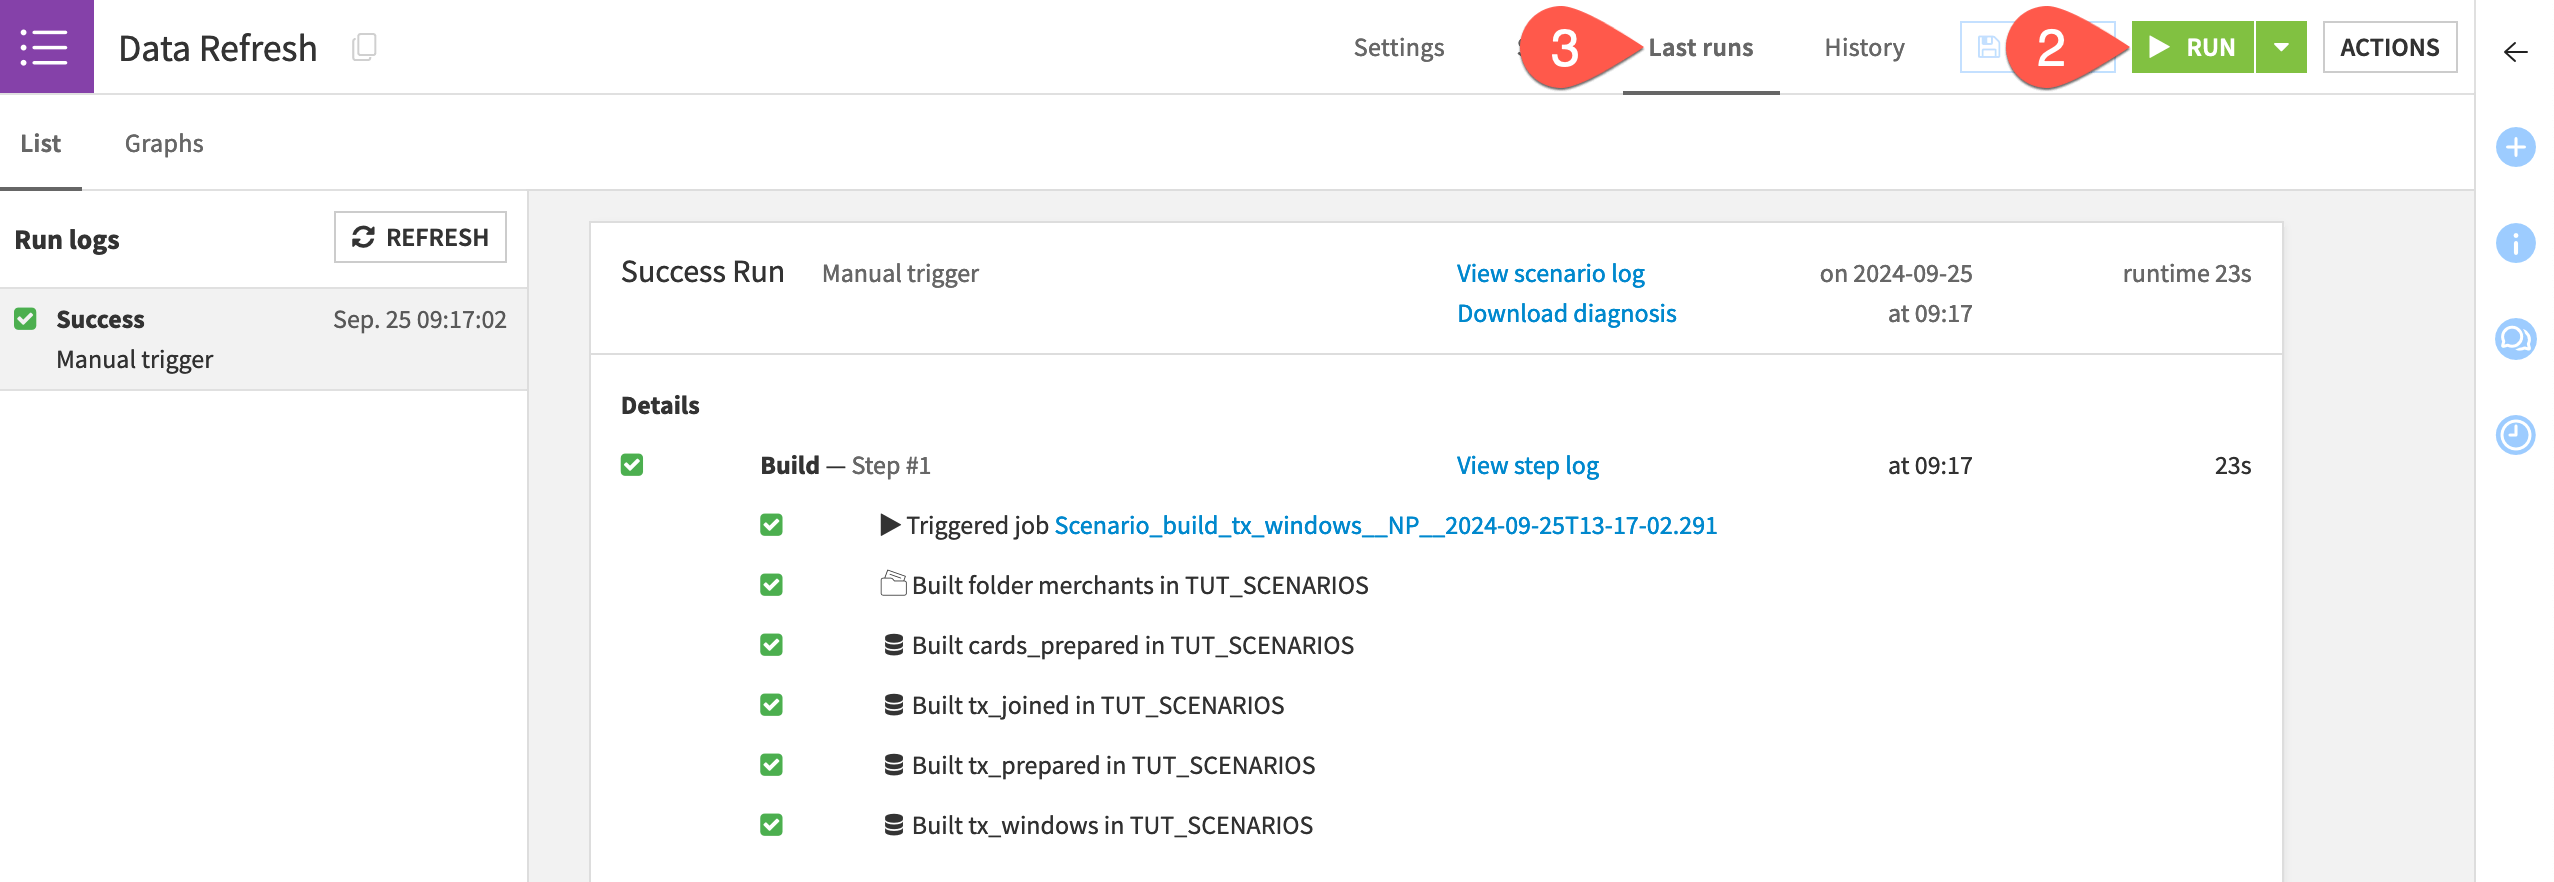
Running this scenario triggered the exact same set of actions as a default upstream build of the tx_windows dataset from the Flow. Why then bother with the scenario?
At least two important reasons:
You can automate exactly when this set of actions should run: for example, at a specified time, when a dataset changes, or even when another scenario finishes.
You can execute a scenario in more flexible ways: for example, through a button on a dashboard, a Dataiku app, or the Python API. This enables other users on the platform to execute actions created by colleagues.
Trigger a scenario#
Let’s demonstrate the value of automating when actions occur by adding various kinds of triggers to the scenario.
Add a time-based trigger#
The simplest trigger is a time-based one. You can use a short interval for testing purposes.
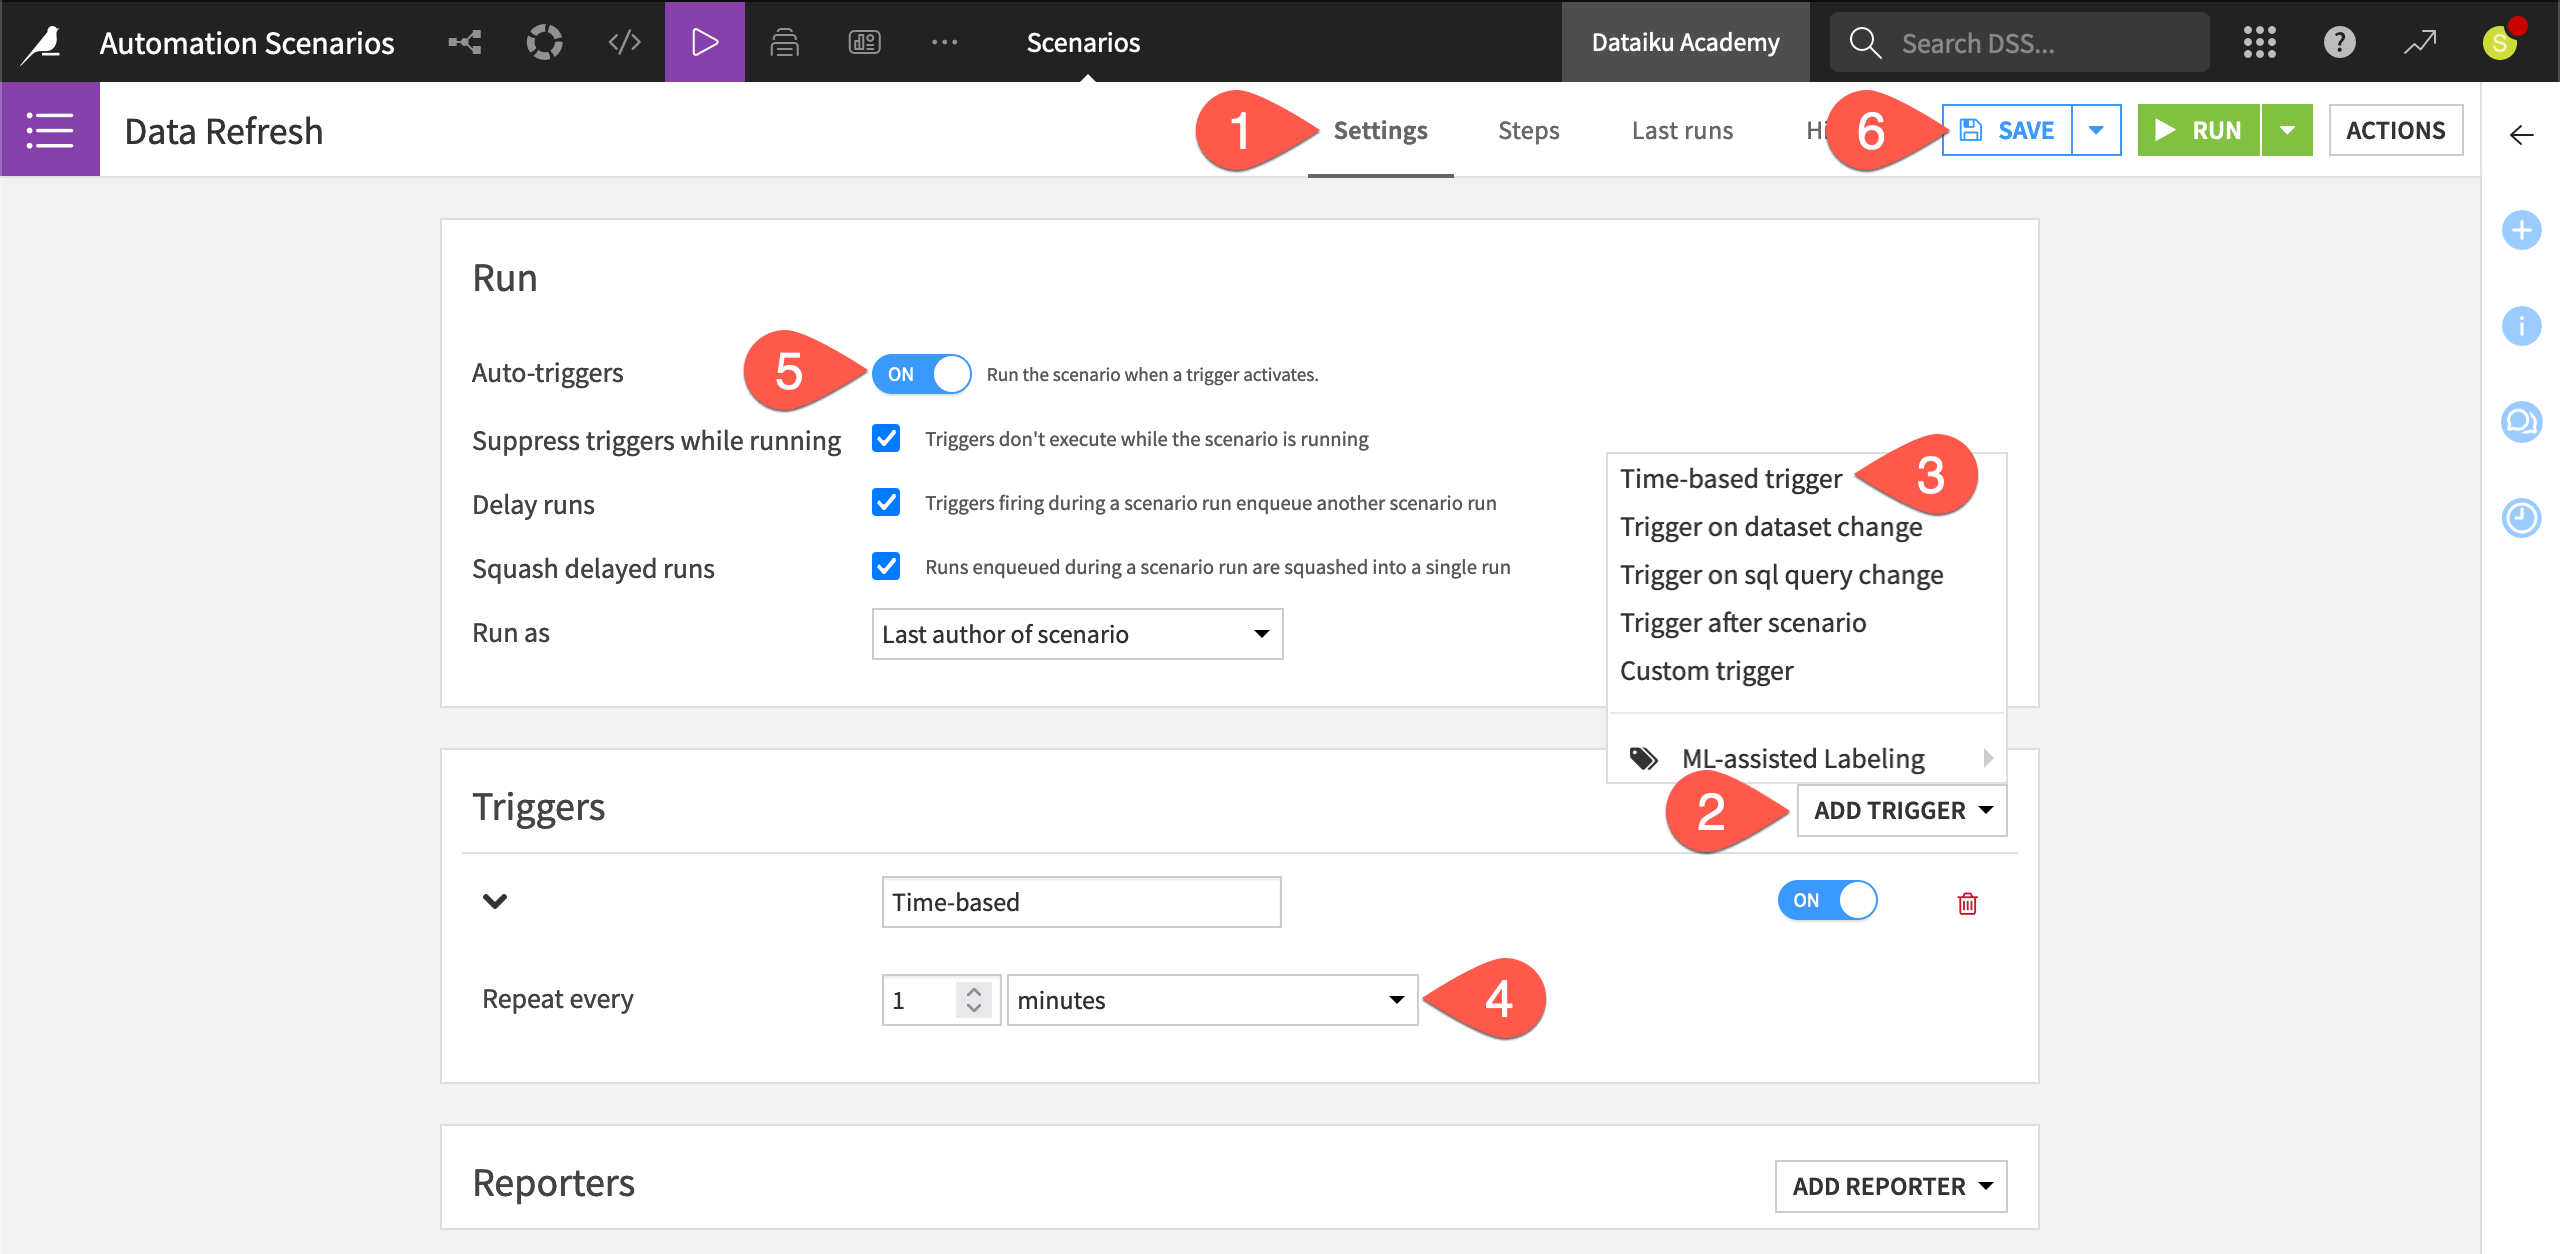
Navigate to the Settings tab of the Data Refresh scenario.
Click Add Trigger.
Choose Time-based trigger.
For the new time-based trigger, set the Repeat every field to
1 minute.In the Run tile, toggle Auto-triggers for the entire scenario to On.
Click Save, and observe what happens next.
Depending on your instance settings, you may soon see a pop-up notification that the scenario has started and finished.
Once one run has finished, in the scenario’s Settings tab, toggle the time-based trigger (not the auto-triggers for the entire scenario) to Off to stop it from repeatedly running, and click Save.
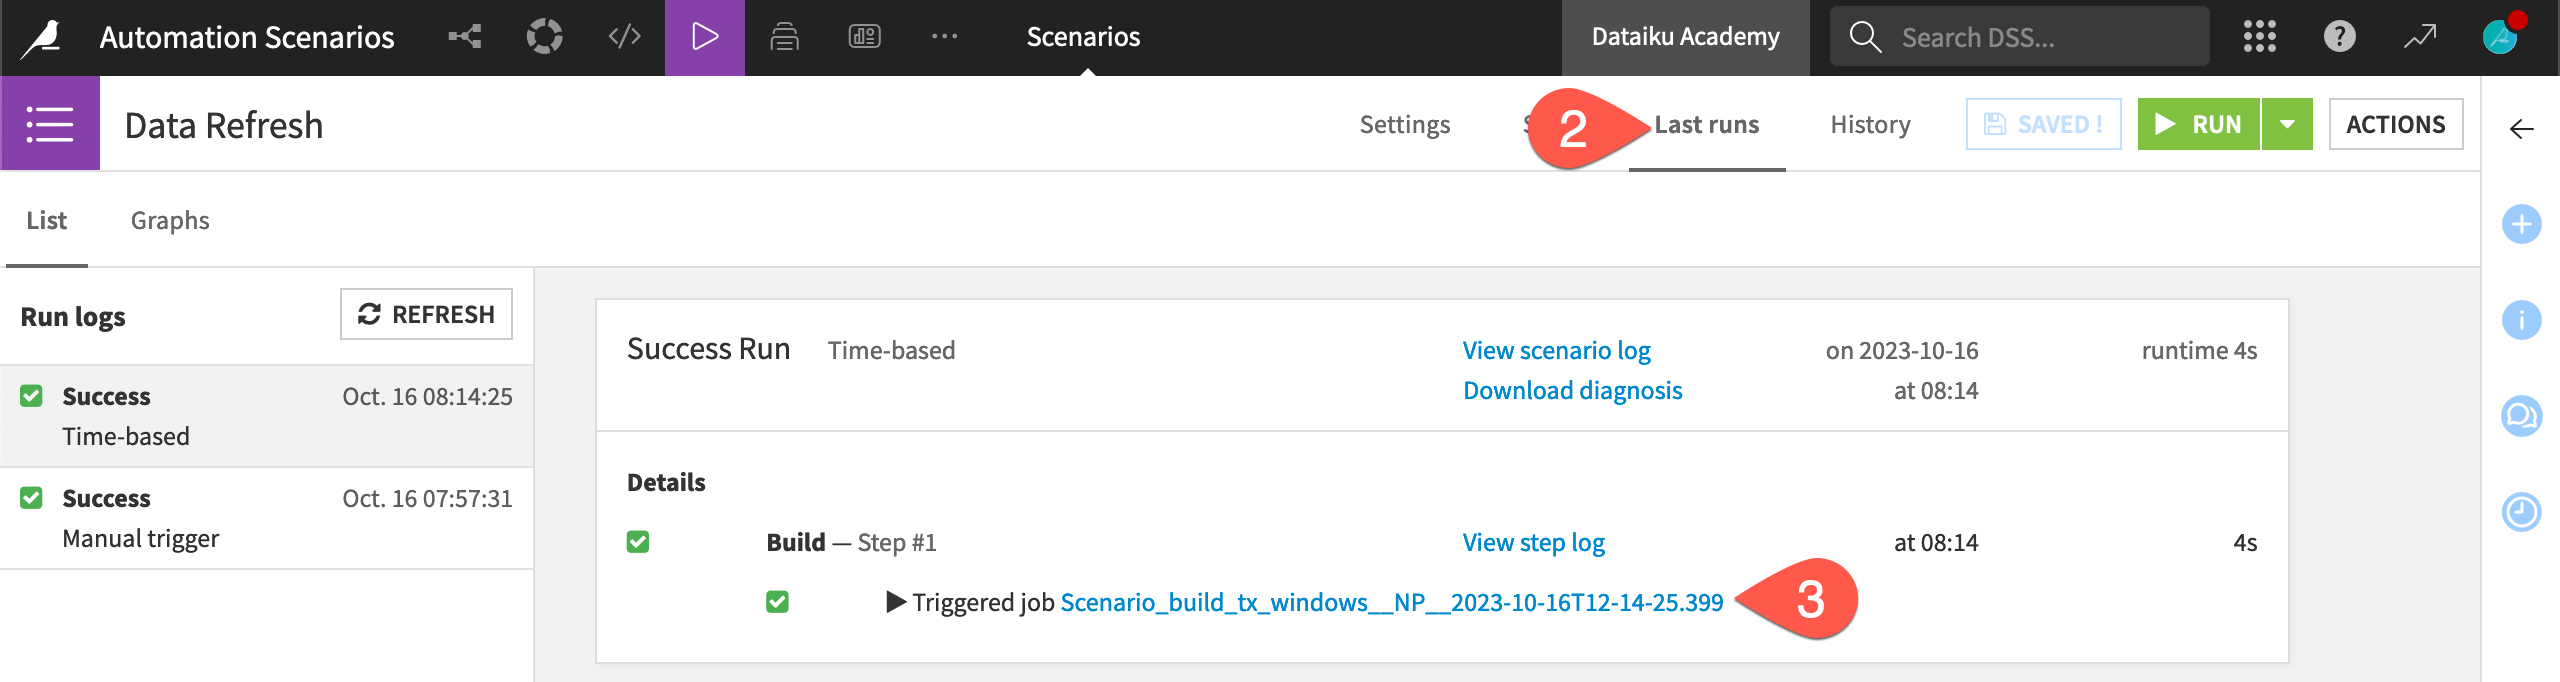
Navigate to the Last runs tab of the scenario.
With the most recent scenario run selected, click to view the job it triggered.
Important
You’ll see that there was nothing to do for this job. The short time-based trigger initiated the scenario run, but there was no actual work for the scenario to do. If you return to the Steps tab, you’ll see that the build mode is Build dependencies then these items. With no upstream changes, the scenario required no action to complete.
Add a dataset change trigger#
Caution
Not all user profiles have access to triggers on dataset changes. If these triggers aren’t available to you, skip ahead to Control the execution of scenario steps.
For other use cases, you may want to initiate actions based on dataset modifications. Let’s demonstrate how this works first for filesystem datasets and then (optionally) for SQL datasets.
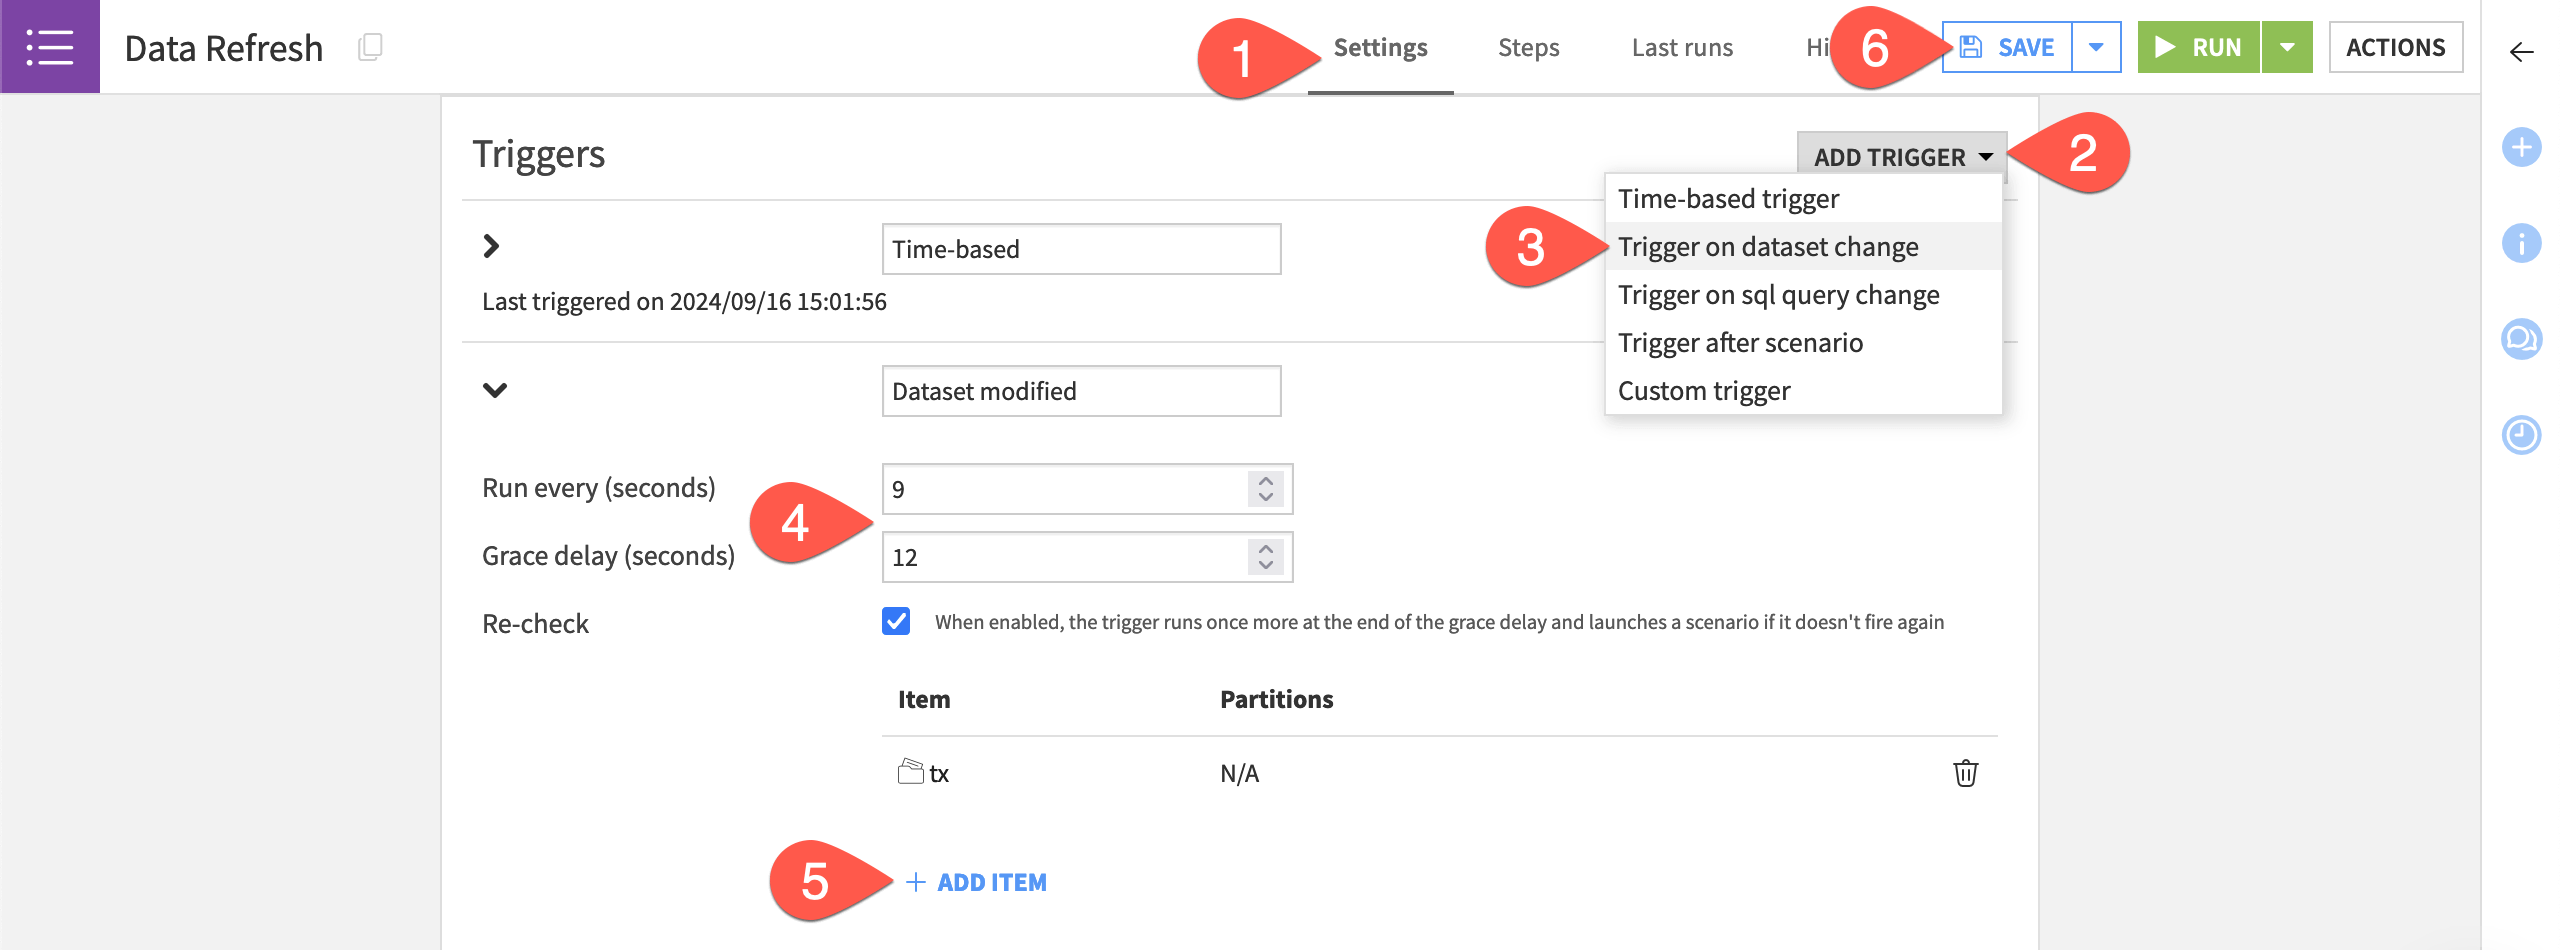
Return to the Data Refresh scenario, and navigate to the Settings tab.
Click Add Trigger.
Choose Trigger on dataset change.
For quicker feedback during this test, change it to run every
9seconds with a grace delay of12seconds.Click + Add Item > Dataset > tx > Add.
Click Save (or
Cmd/Ctrl+S).
Now, simulate a change to the upstream dataset on which you’ve added the trigger.
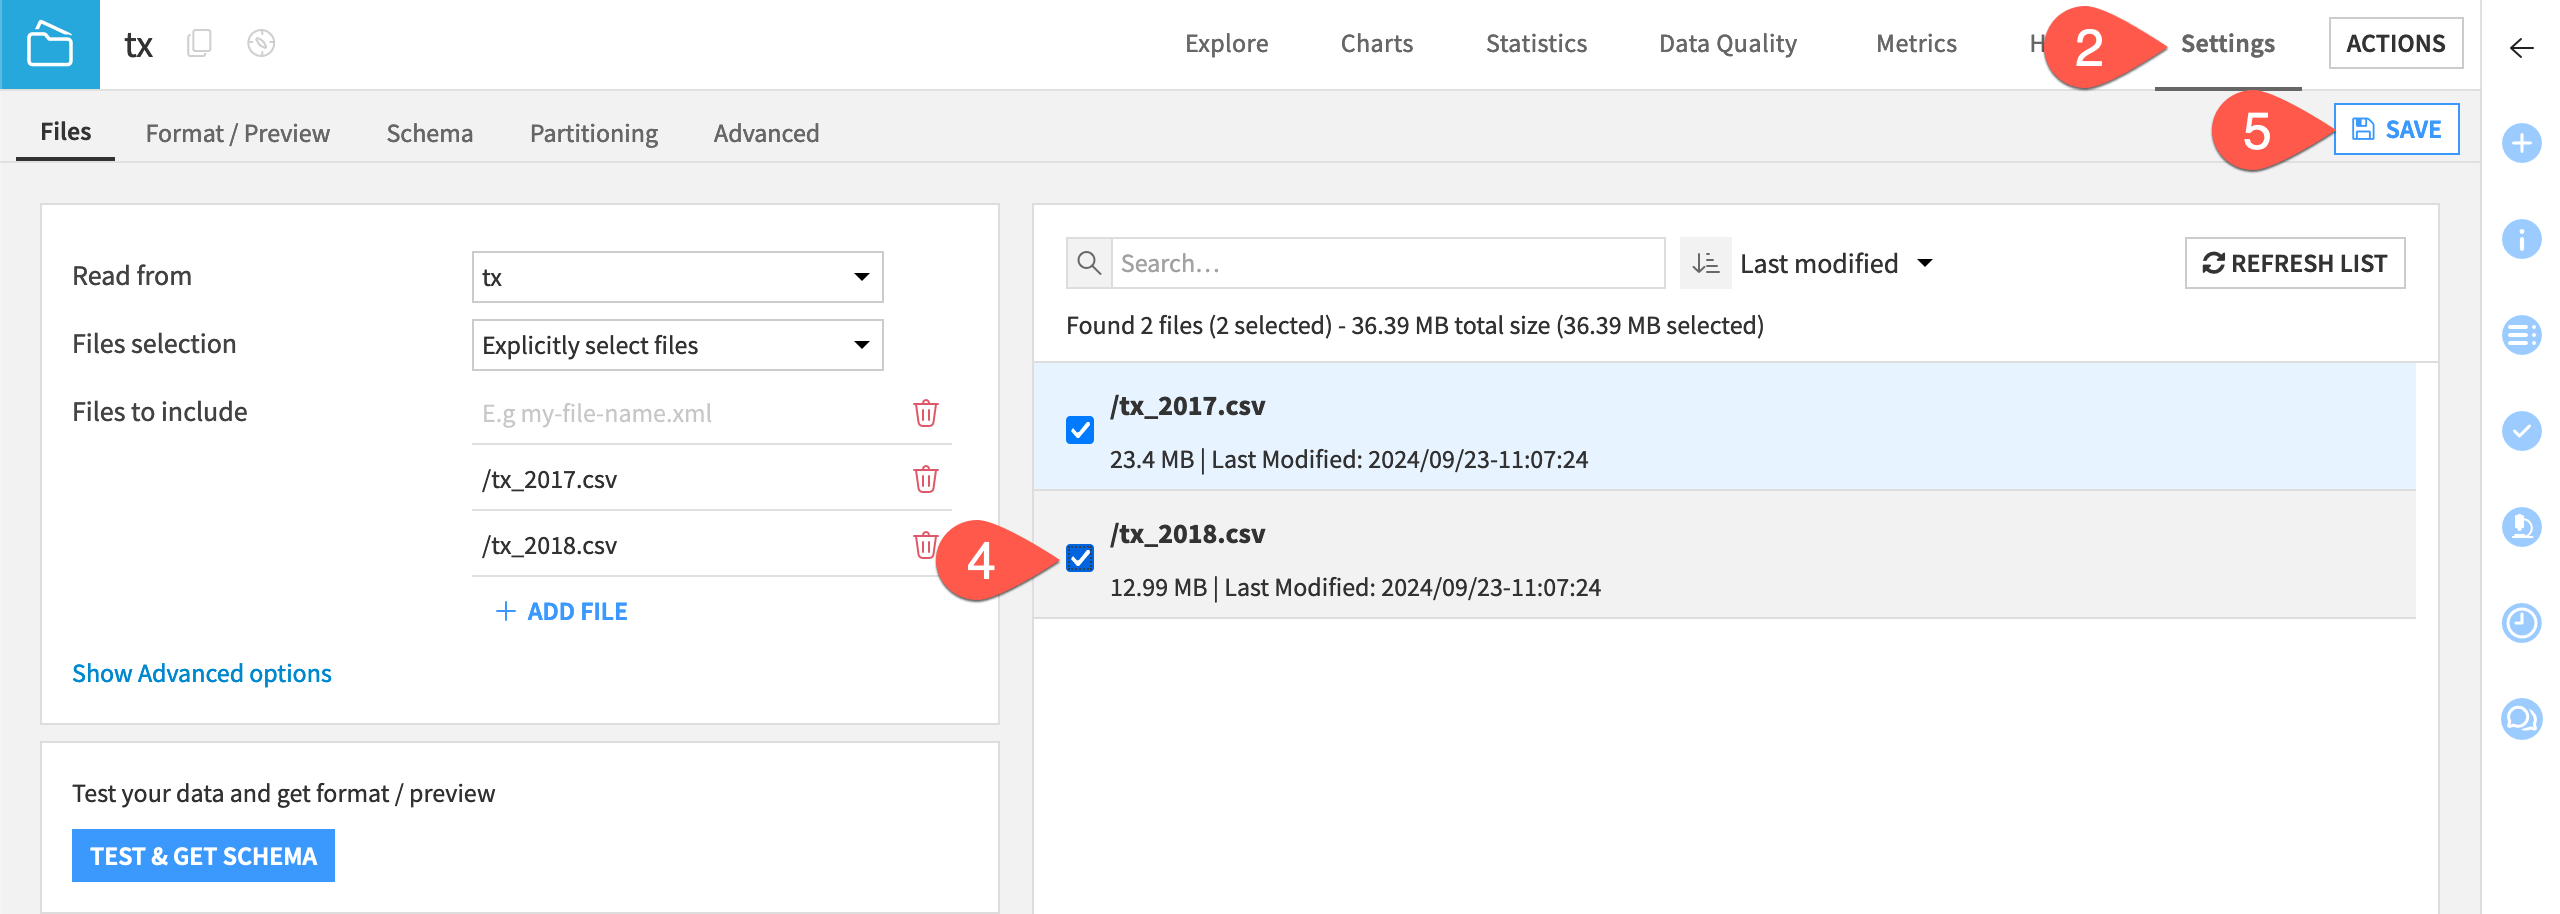
Go to the Flow, and open the tx dataset.
Navigate to the Settings tab.
Click List Files.
Check the box next to /tx_2018.csv to include both files in the tx dataset.
Click Save (or
Cmd/Ctrl+S).
This should set off a new run shortly!
Navigate back to the Last runs tab of the Data Refresh scenario.
Find the run log triggered by the dataset modification.
Once one run has finished, return to the Settings tab.
Toggle the dataset modification trigger to Off.
Click Save.
Optional: Trigger on SQL query change
The Trigger on dataset change option only reads the dataset’s settings (not the actual data). Accordingly, it doesn’t detect changes in SQL tables managed outside of Dataiku. Therefore, a SQL query trigger must be used instead. If the output of the query changes, the trigger sets off the scenario run.
For example, let’s trigger the scenario if the latest purchase date in the transactions dataset changes.
From the Flow, create and run a Sync recipe to move the tx dataset to an SQL connection.
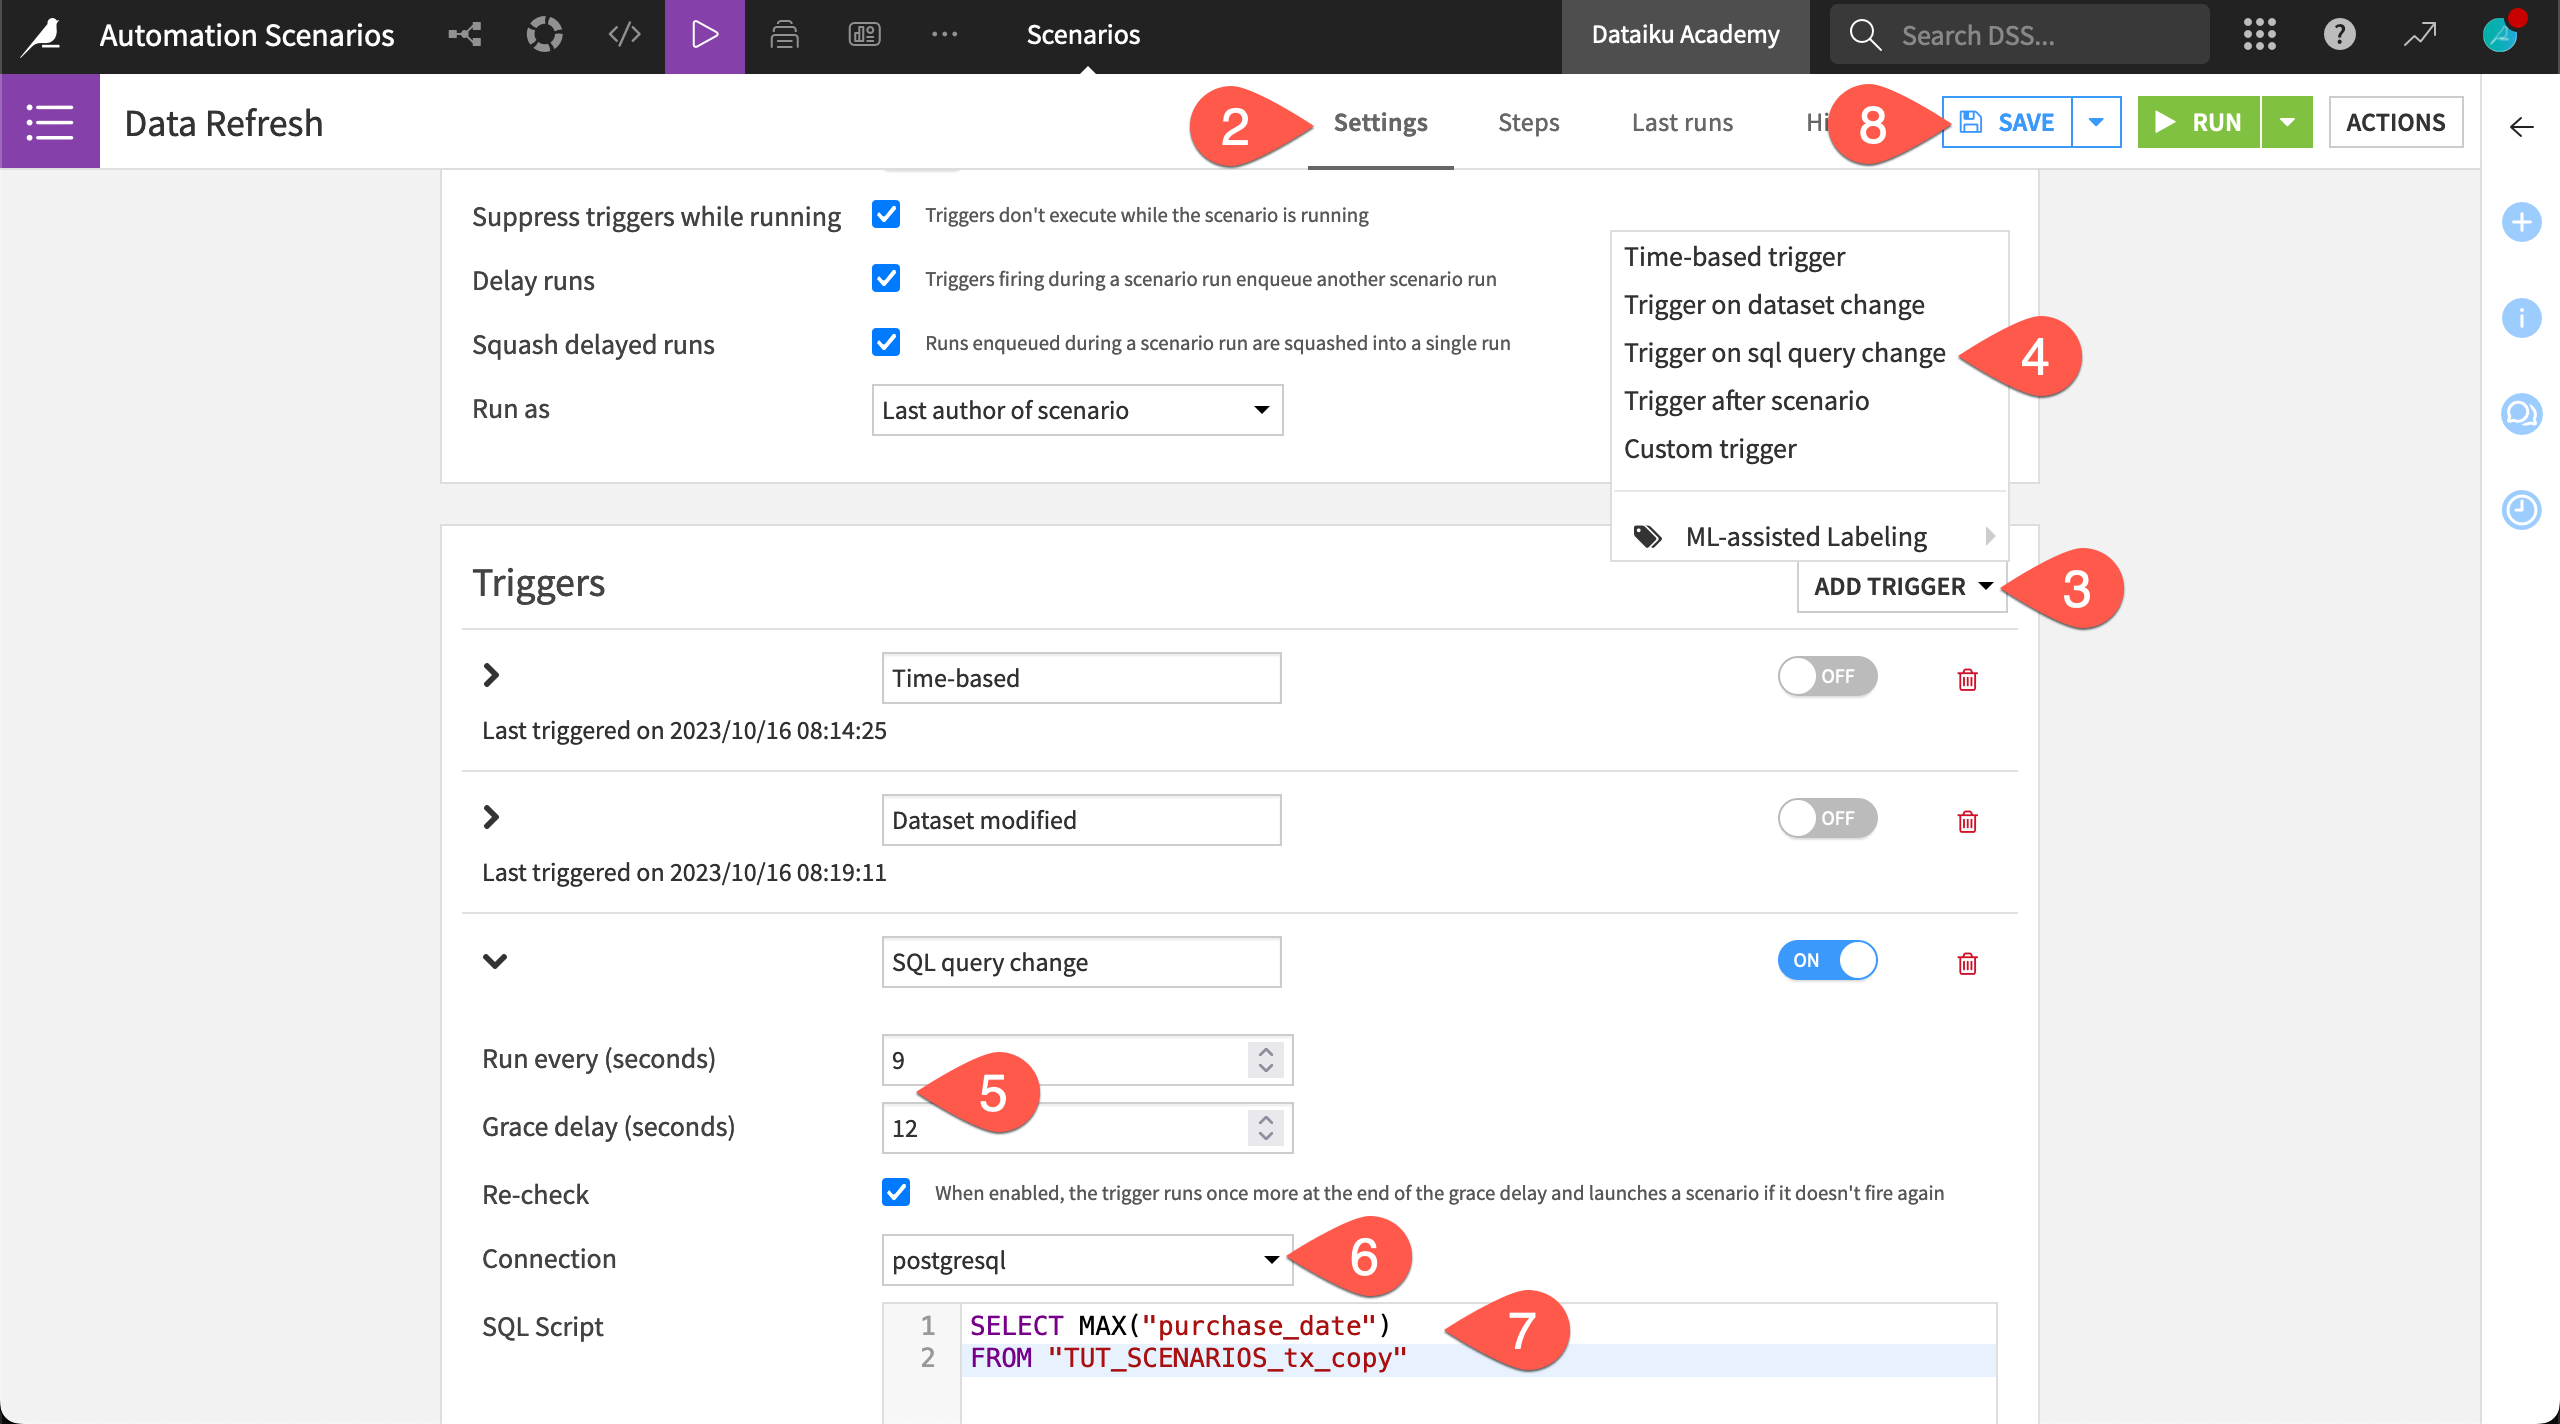
Navigate to the Settings tab of the Data Refresh scenario.
Click Add Trigger.
Choose Trigger on SQL query change.
For quicker feedback during this test, change it to run every
9seconds with a grace delay of12seconds.Select the connection holding the synced transactions data (tx_copy).
For the SQL script, copy-paste the following block, making any necessary changes to your project key and table name in the
FROMclause.SELECT MAX("purchase_date") FROM "TUT_SCENARIOS_tx_copy"
Warning
Workshop this query first in an SQL notebook. Dataiku Cloud users, for example, will need to include instance information in the
FROMclause.Click Save.
As before, simulate a dataset change to set off the trigger.
To force a new maximum purchase date value, return to the Settings tab of the tx dataset.
Click Show Advanced options, change which files to include, and then Save.
Build the tx_copy dataset to simulate a change in the dataset tied to the SQL trigger.
When the Sync recipe finishes running, switch back to the Last runs tab of the Data Refresh scenario to see the log run triggered by the SQL query change.
Optional: Custom Python trigger
Although you could achieve this functionality with the standard time-based trigger, try this custom Python trigger that would run every first Friday in a month.
Navigate to the Settings tab of the Data Refresh scenario.
Click Add Trigger.
Choose Custom trigger.
Name it
Every first Friday.Copy-paste the following code block, and then Save.
from dataiku.scenario import Trigger
from datetime import date

t = Trigger()

today = date.today()
dayofweek = today.isoweekday()
day = today.day

if dayofweek == 5 and day <= 7:
    t.fire()
See also
See the Developer Guide for more on Python-based scenarios.
Turn off auto-triggers#
Now that you’ve finished testing triggers for this scenario, remember to switch them off to avoid unwanted runs. At this point, you’ve seen two levels of control:
The On/Off switch for an individual trigger.
The On/Off switch for auto-triggers at the scenario-level. No individual trigger will fire if automatic execution for the scenario is turned off.
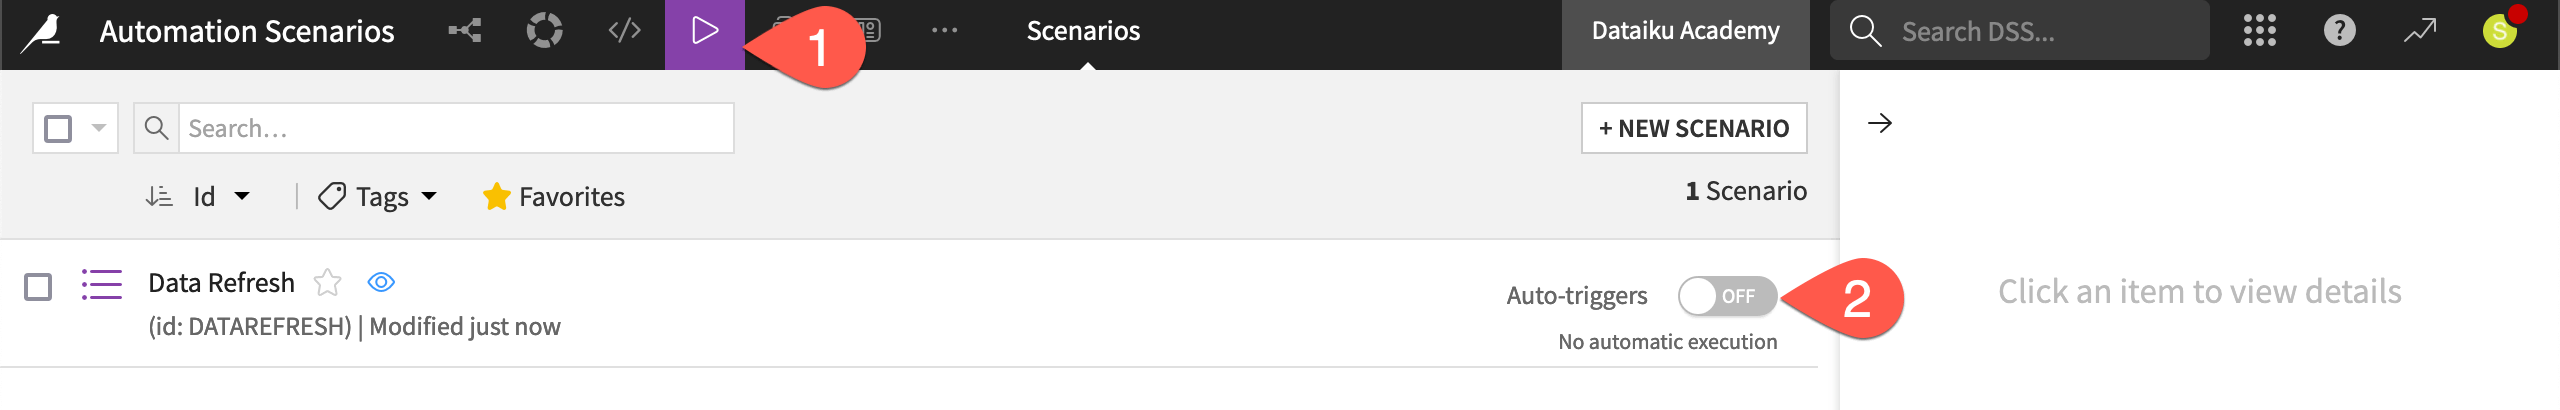
Turn off auto-triggers for the scenario.
Open the main Scenarios page (or the Settings tab of the Data Refresh scenario).
Toggle auto-triggers to Off.
Control the execution of scenario steps#
Triggers grant control over when scenarios run. On top of this, step-based execution controls how scenarios run, once triggered. For example, a scenario may have a weekly trigger. However, if only a small number of new records are available, you may want steps within the scenario to behave differently.
By default, scenarios steps run in order until complete unless an intermediate step fails. However, you can alter this behavior to run steps only if certain conditions are met. Metrics, checks, and data quality rules are important tools in this process.
Let’s demonstrate how a data quality rule can cause a build step in a scenario to fail.
Important
Dataiku introduced Data quality rules in version 12.6. If using a pre-12.6 version of Dataiku, you’ll be able to achieve the same functionality shown here with metrics and checks.
Introduce a failing data quality rule#
This project already has data quality rules (or checks) in place on the tx_prepared dataset.
From the Jobs (
) menu of the top navigation bar, select Data Quality (or g+q).Click tx_prepared to view the status of this dataset’s rules.
On this page, review the rules or checks already in place. If not already computed, click Compute All.
The current dataset status happens to be a warning. Force a failure for the purpose of demonstration.
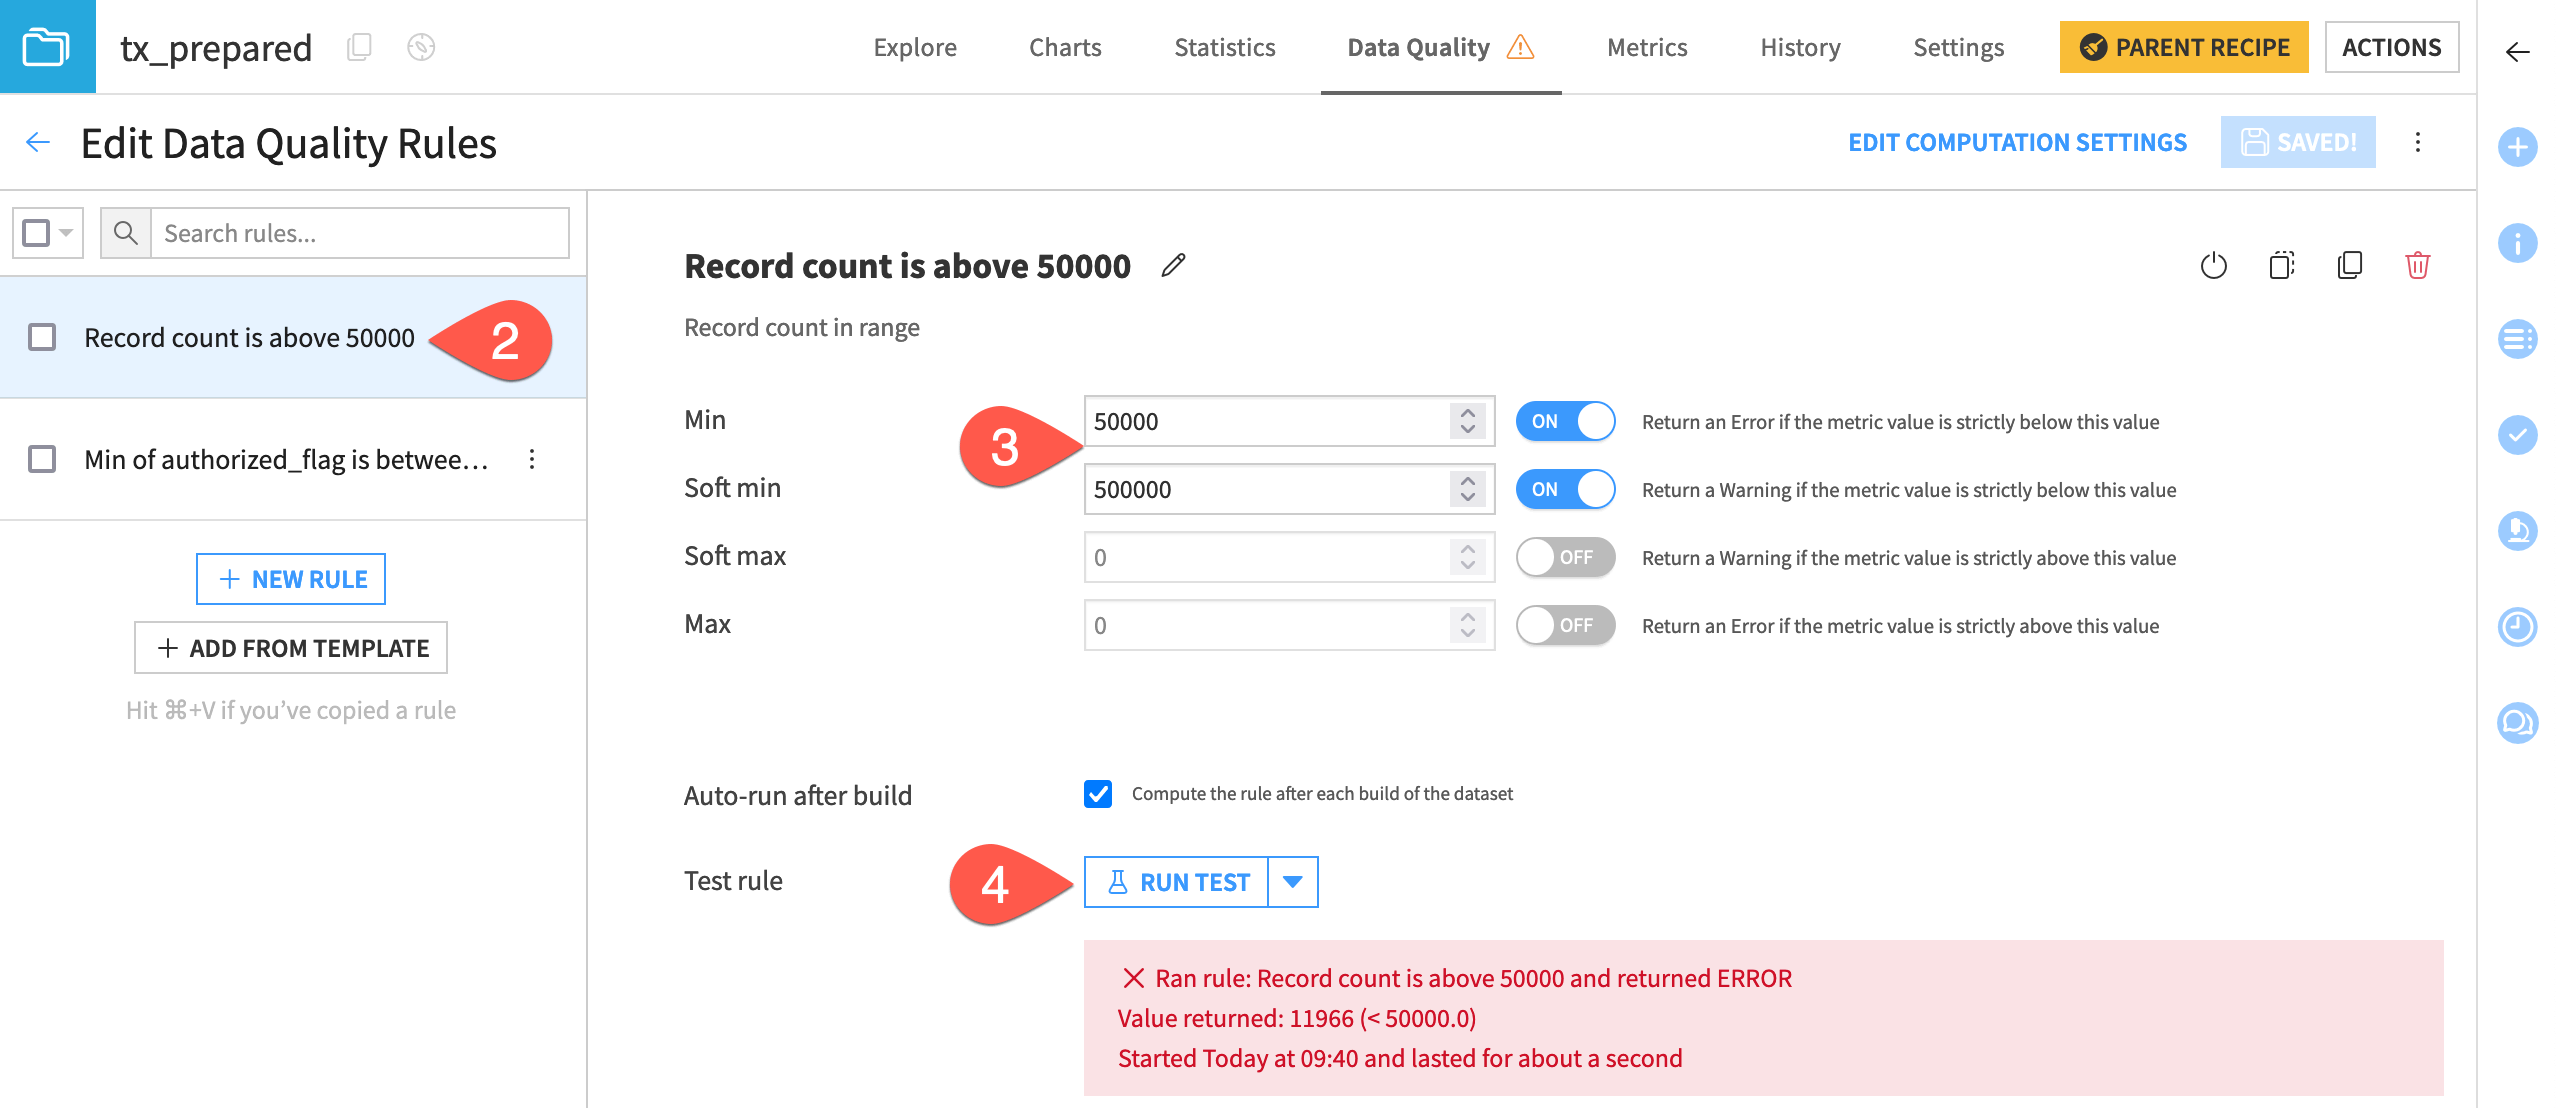
From the Data Quality tab of the tx_prepared dataset, click Edit Rules.
Select the Record count rule.
Increase the min to 50k (
50000) and soft min to 500k (500000) so that it returns a failure.Click Run Test to confirm the error.
Run a scenario with a failing data quality rule#
Run the scenario again—this time with a failing data quality rule on a dataset included in the build pipeline.
Open the Data Refresh scenario.
Click Run.
Navigate to the Last runs tab.
Click to view the job that the most recent run triggered.
Important
Are you surprised that the scenario succeeds? Remember that the build step is set to build required dependencies. The datasets and the recipes in the pipeline haven’t changed. Accordingly, even though a data quality rule has changed, this scenario still had no work to do.
Try to run the scenario once more—this time with an empty Flow and a failing data quality rule.
Repeat the steps to clear the Flow datasets. Remember not to clear the initial tx, cards, and merchants datasets.
Return to the Data Refresh scenario.
Click Run.
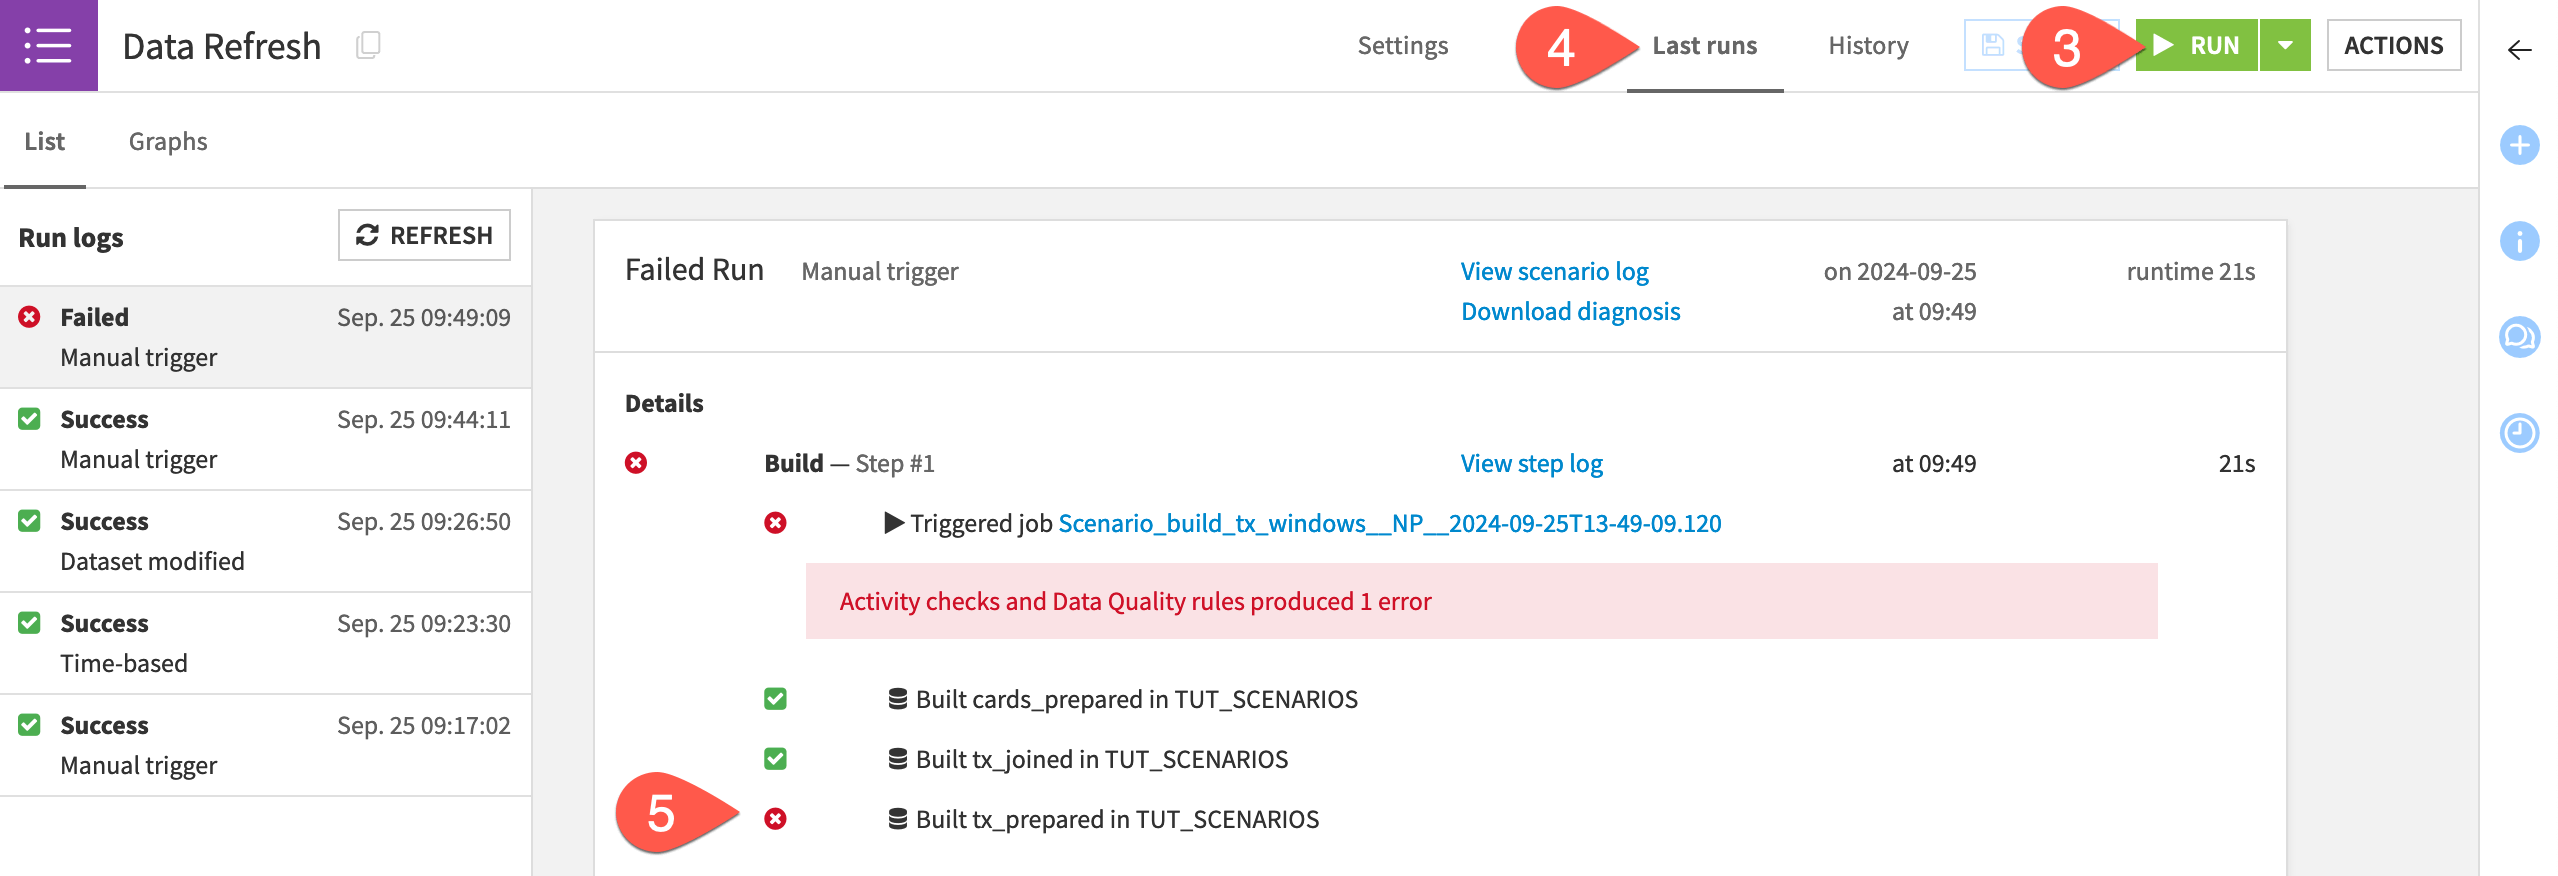
Navigate to the Last runs tab to observe the results of the most recent run.
Confirm that, although the initial activities succeed, the scenario fails when it builds the tx_prepared dataset. The error from the data quality rule interrupts the scenario’s execution. It doesn’t continue building the downstream outputs.
Tip
One reason for this outcome is that the data quality rules on tx_prepared are set to Auto-run after build. This means that you didn’t have to explicitly request their computation in the scenario.
Next steps#
Congratulations on creating a scenario to automate a routine action in Dataiku! Once you have mastered these basic building blocks, you can explore other built-in scenario steps, such as those that automate exports or execute code.
Caution
If you haven’t already done so, be sure to turn off any Auto-triggers in the Data Refresh scenario!
A common next step would be to add a reporter to the scenario to communicate activities through various messaging channels.
Try that in Tutorial | Scenario reporters!
See also
See the reference documentation to learn more about Automation scenarios.