
Concept | Partitioned datasets#
Watch the video
When interacting with a partitioned dataset, Dataiku displays options specific to partitions in the tabs of the dataset and when viewing the Flow. Let’s look at the options available in more detail.
Explore tab#
In Dataiku, the Explore tab displays a sample of the dataset. With a partitioned dataset, we can configure the sample to include some or all partitions so that we can perform computations on the selected partitions.
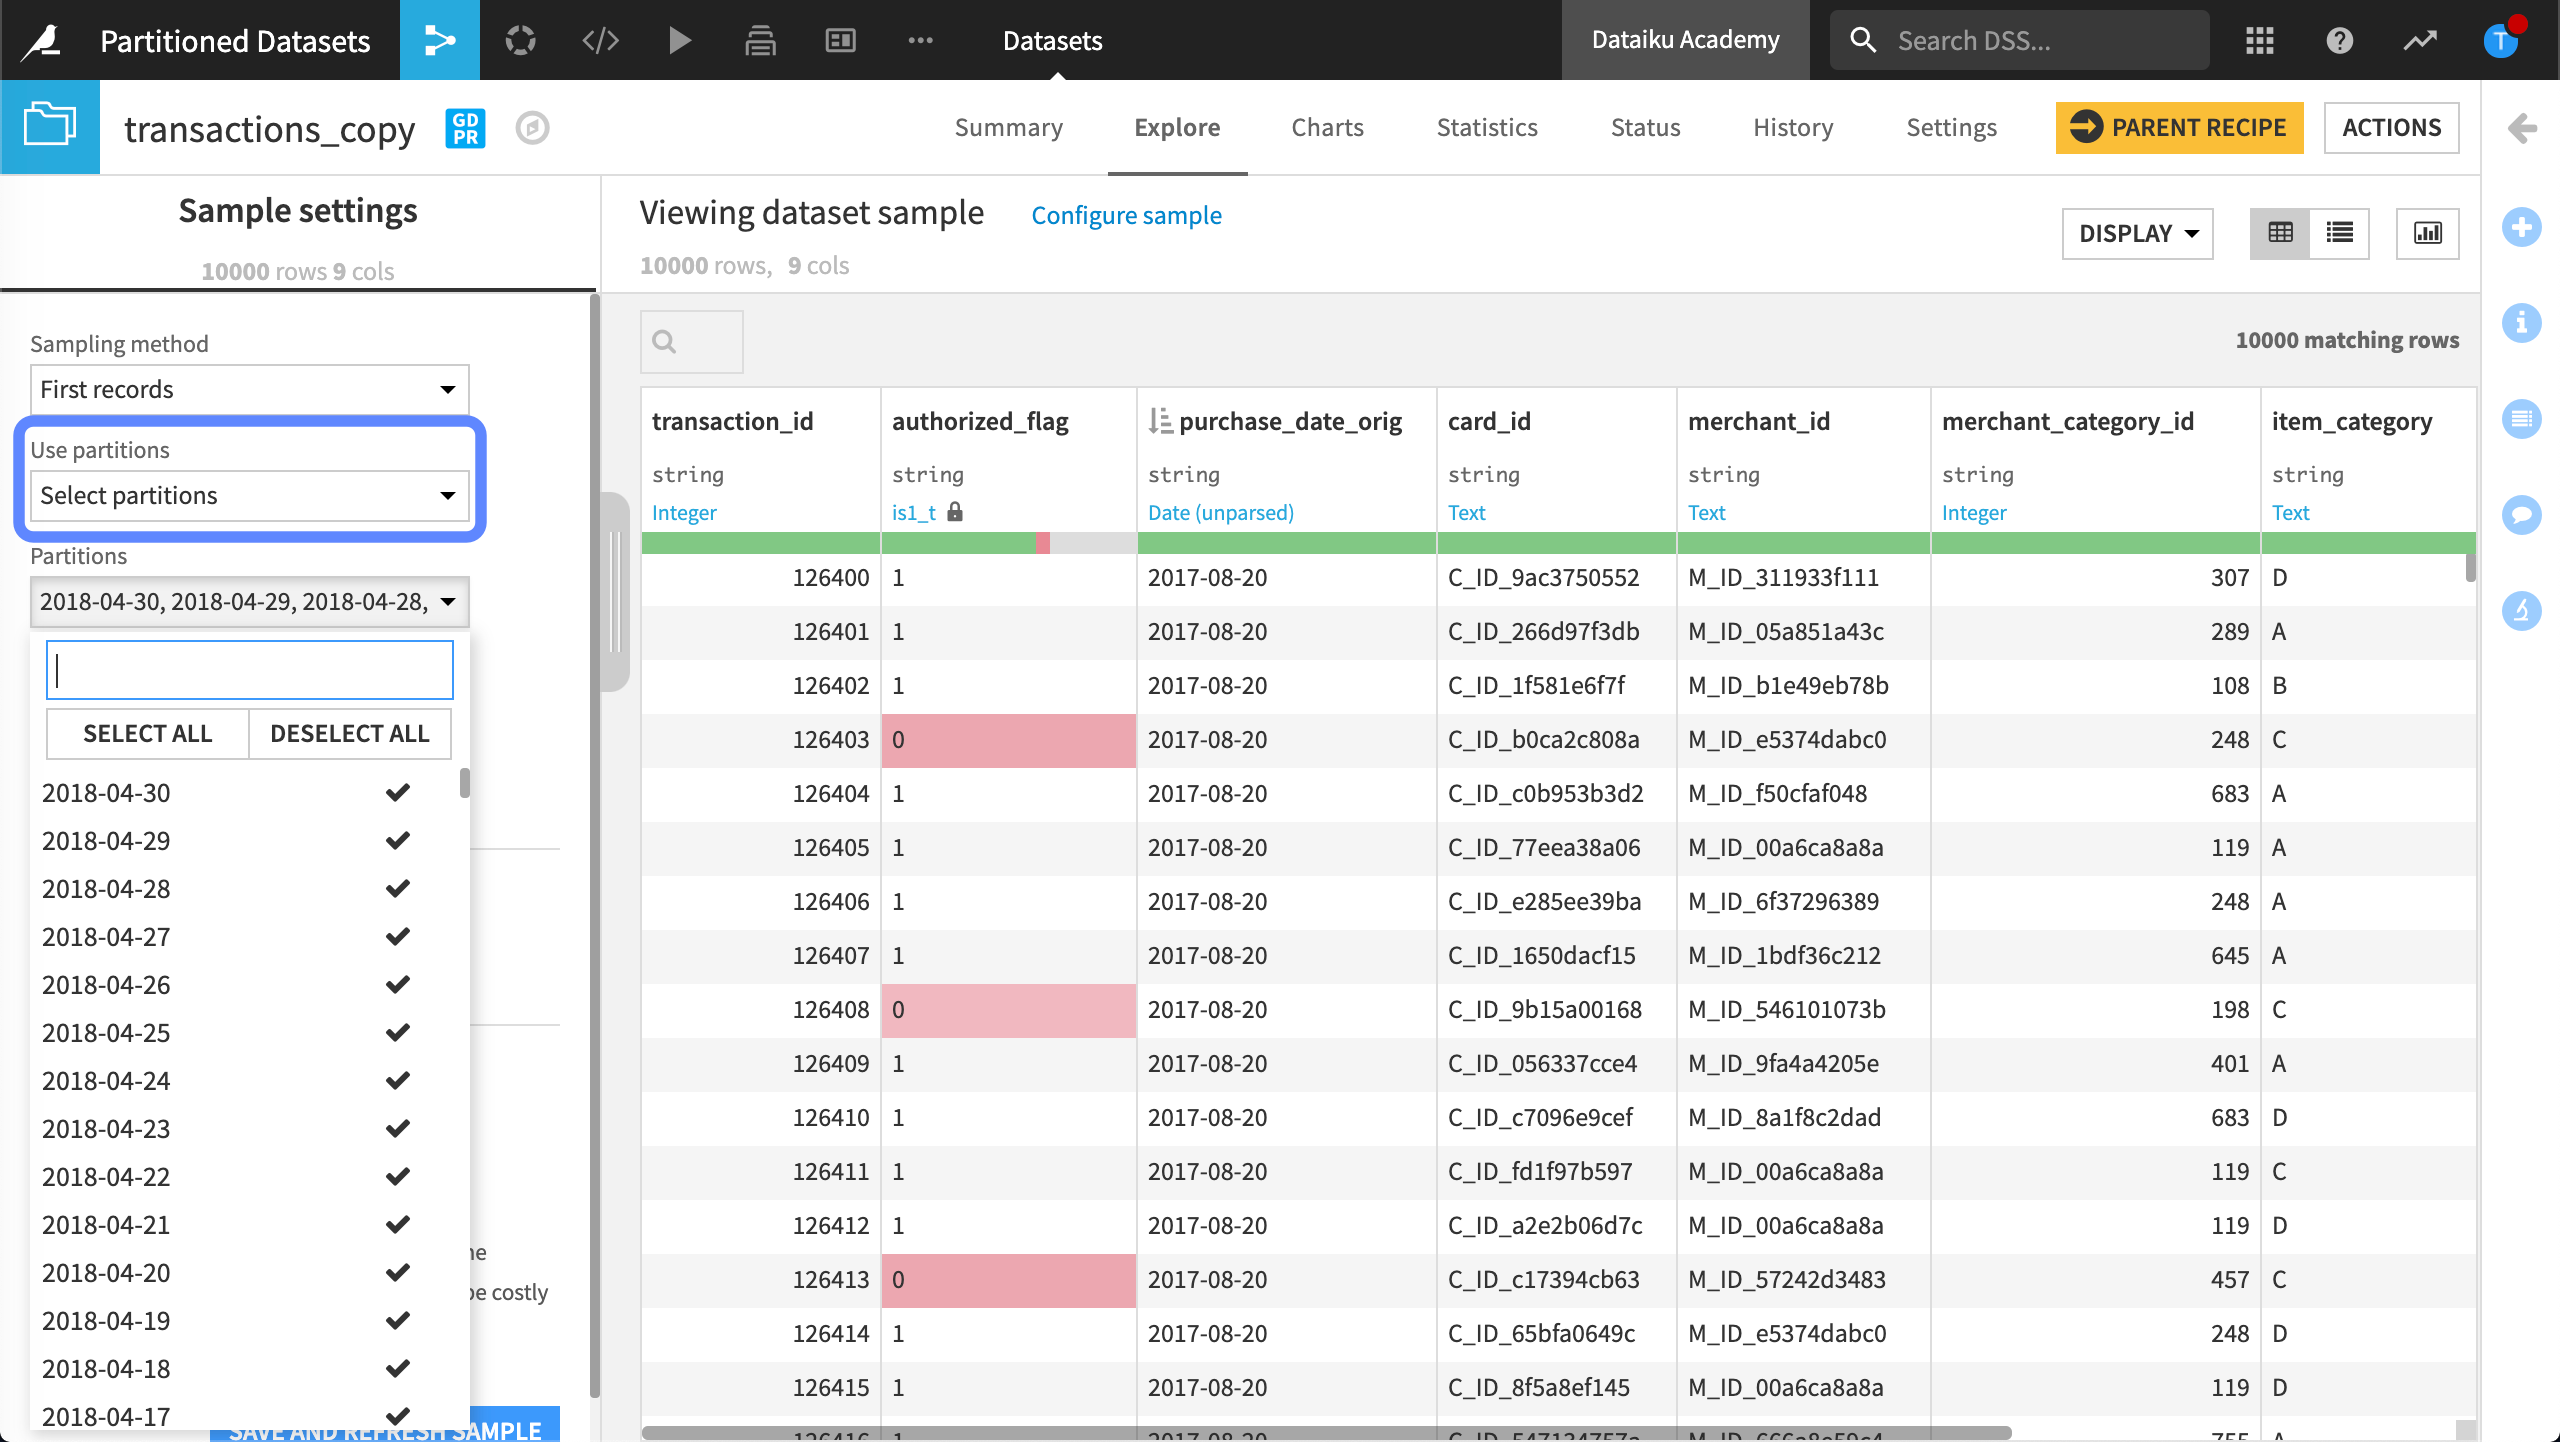
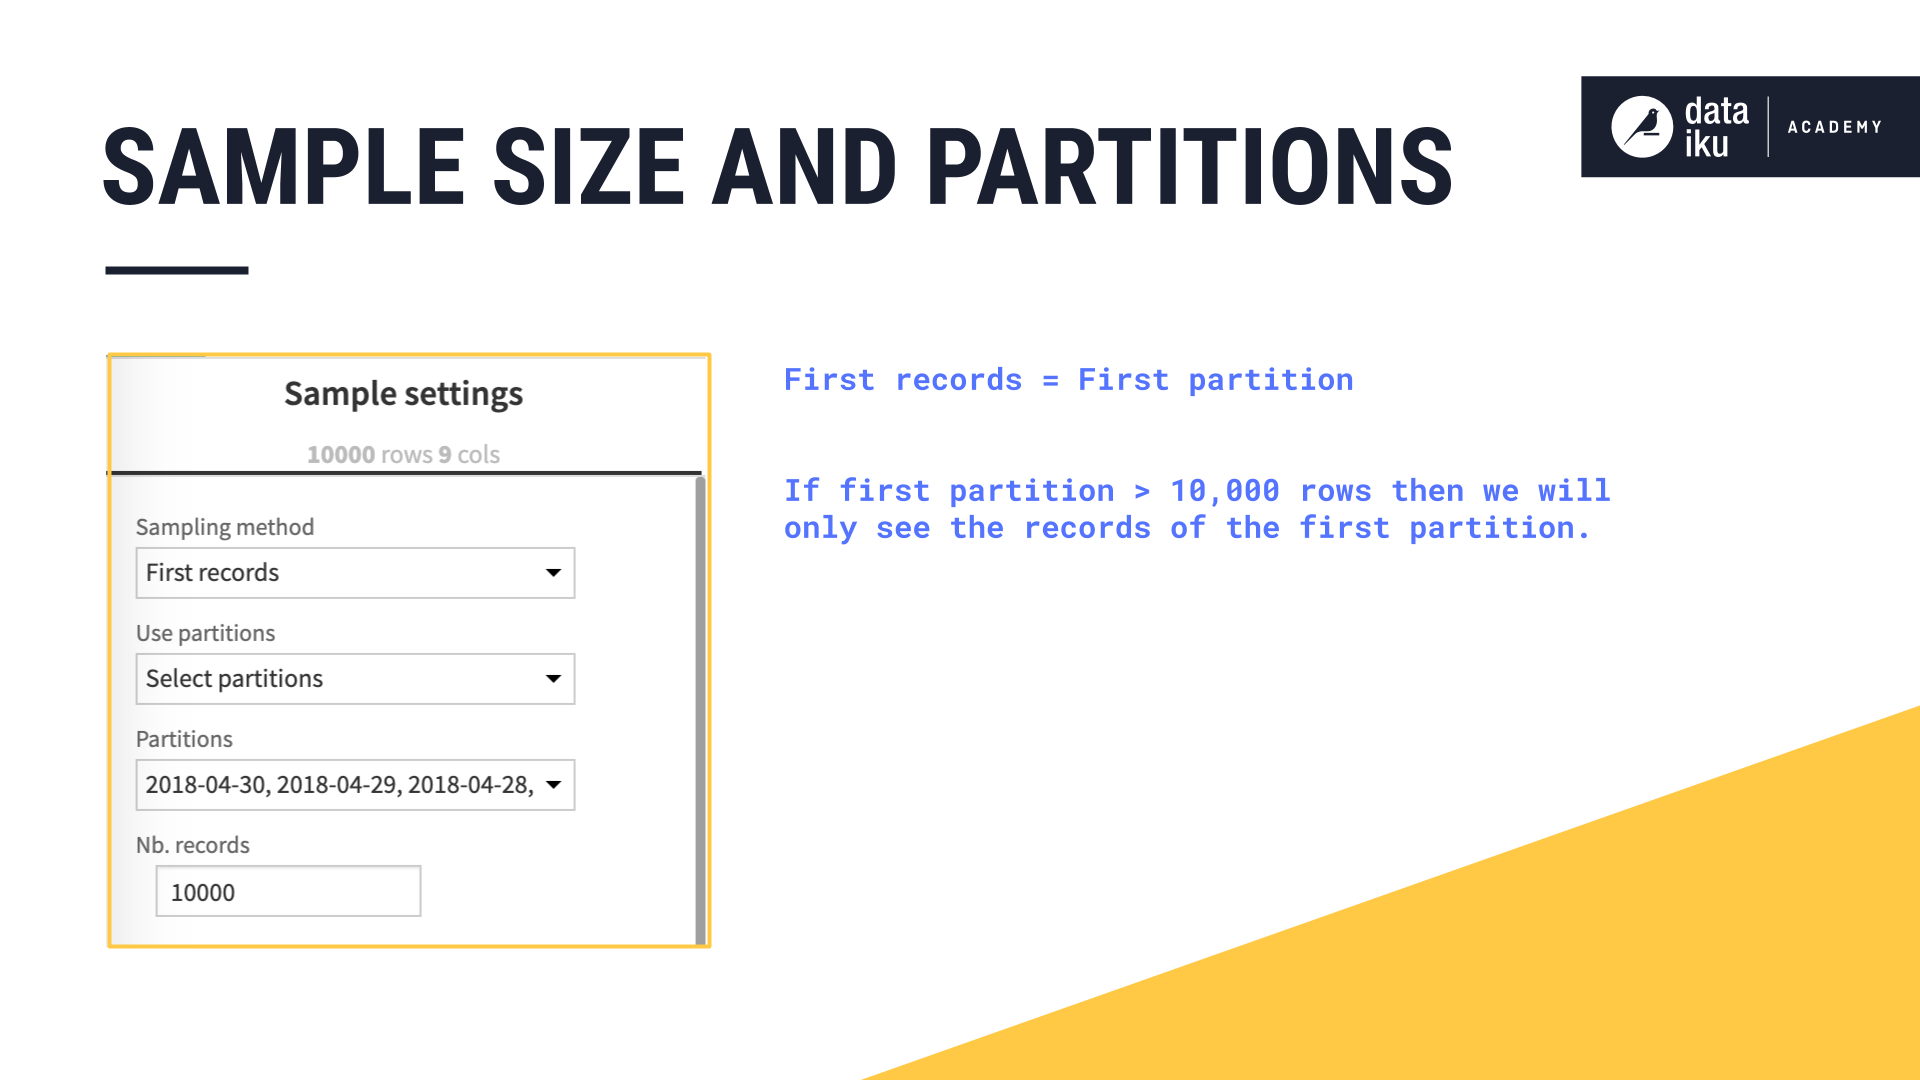
Sample size and partitions#
By default, Dataiku creates the sample using all partitions. The default sample size is 10,000 rows. This is the same as with a non-partitioned dataset.
If we use the First records sampling method, and our first partition contains less than 10,000 rows, we will see at least two partitions in our sample, or as many partitions as needed to reach the sample size of 10,000 rows. However, if our first partition contains more than 10,000 rows, then we will only see the records of the first partition.
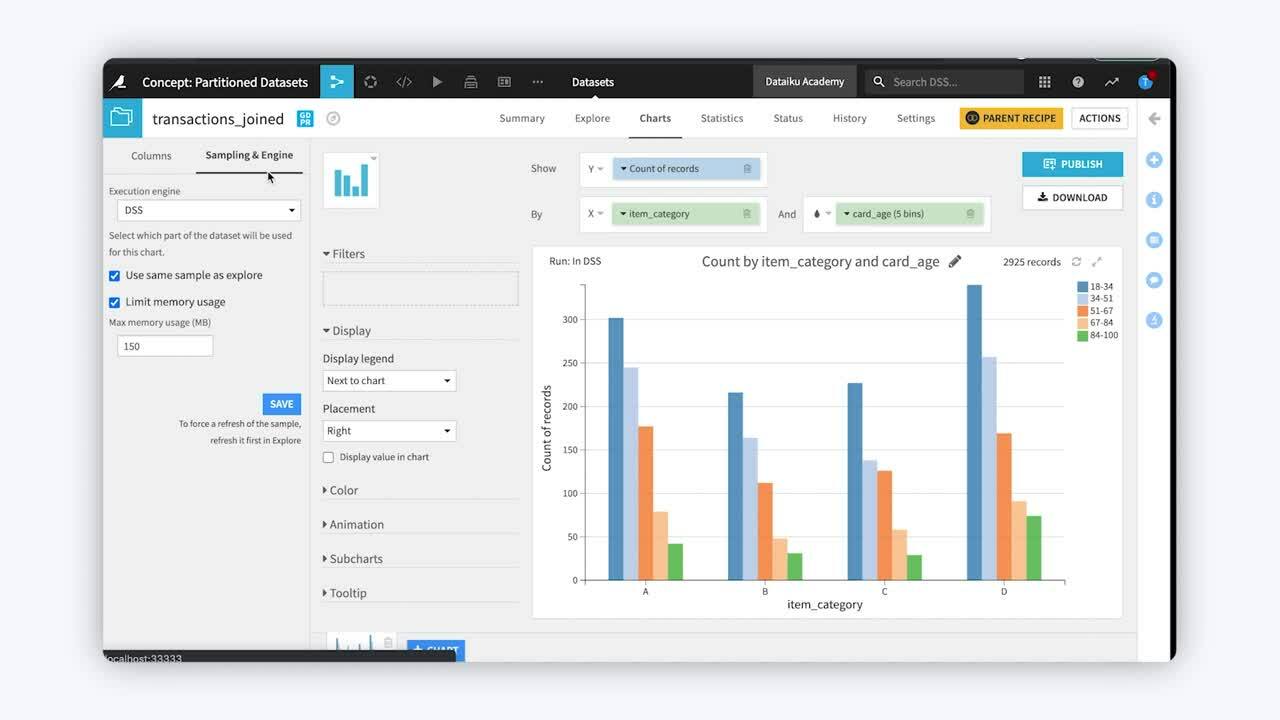
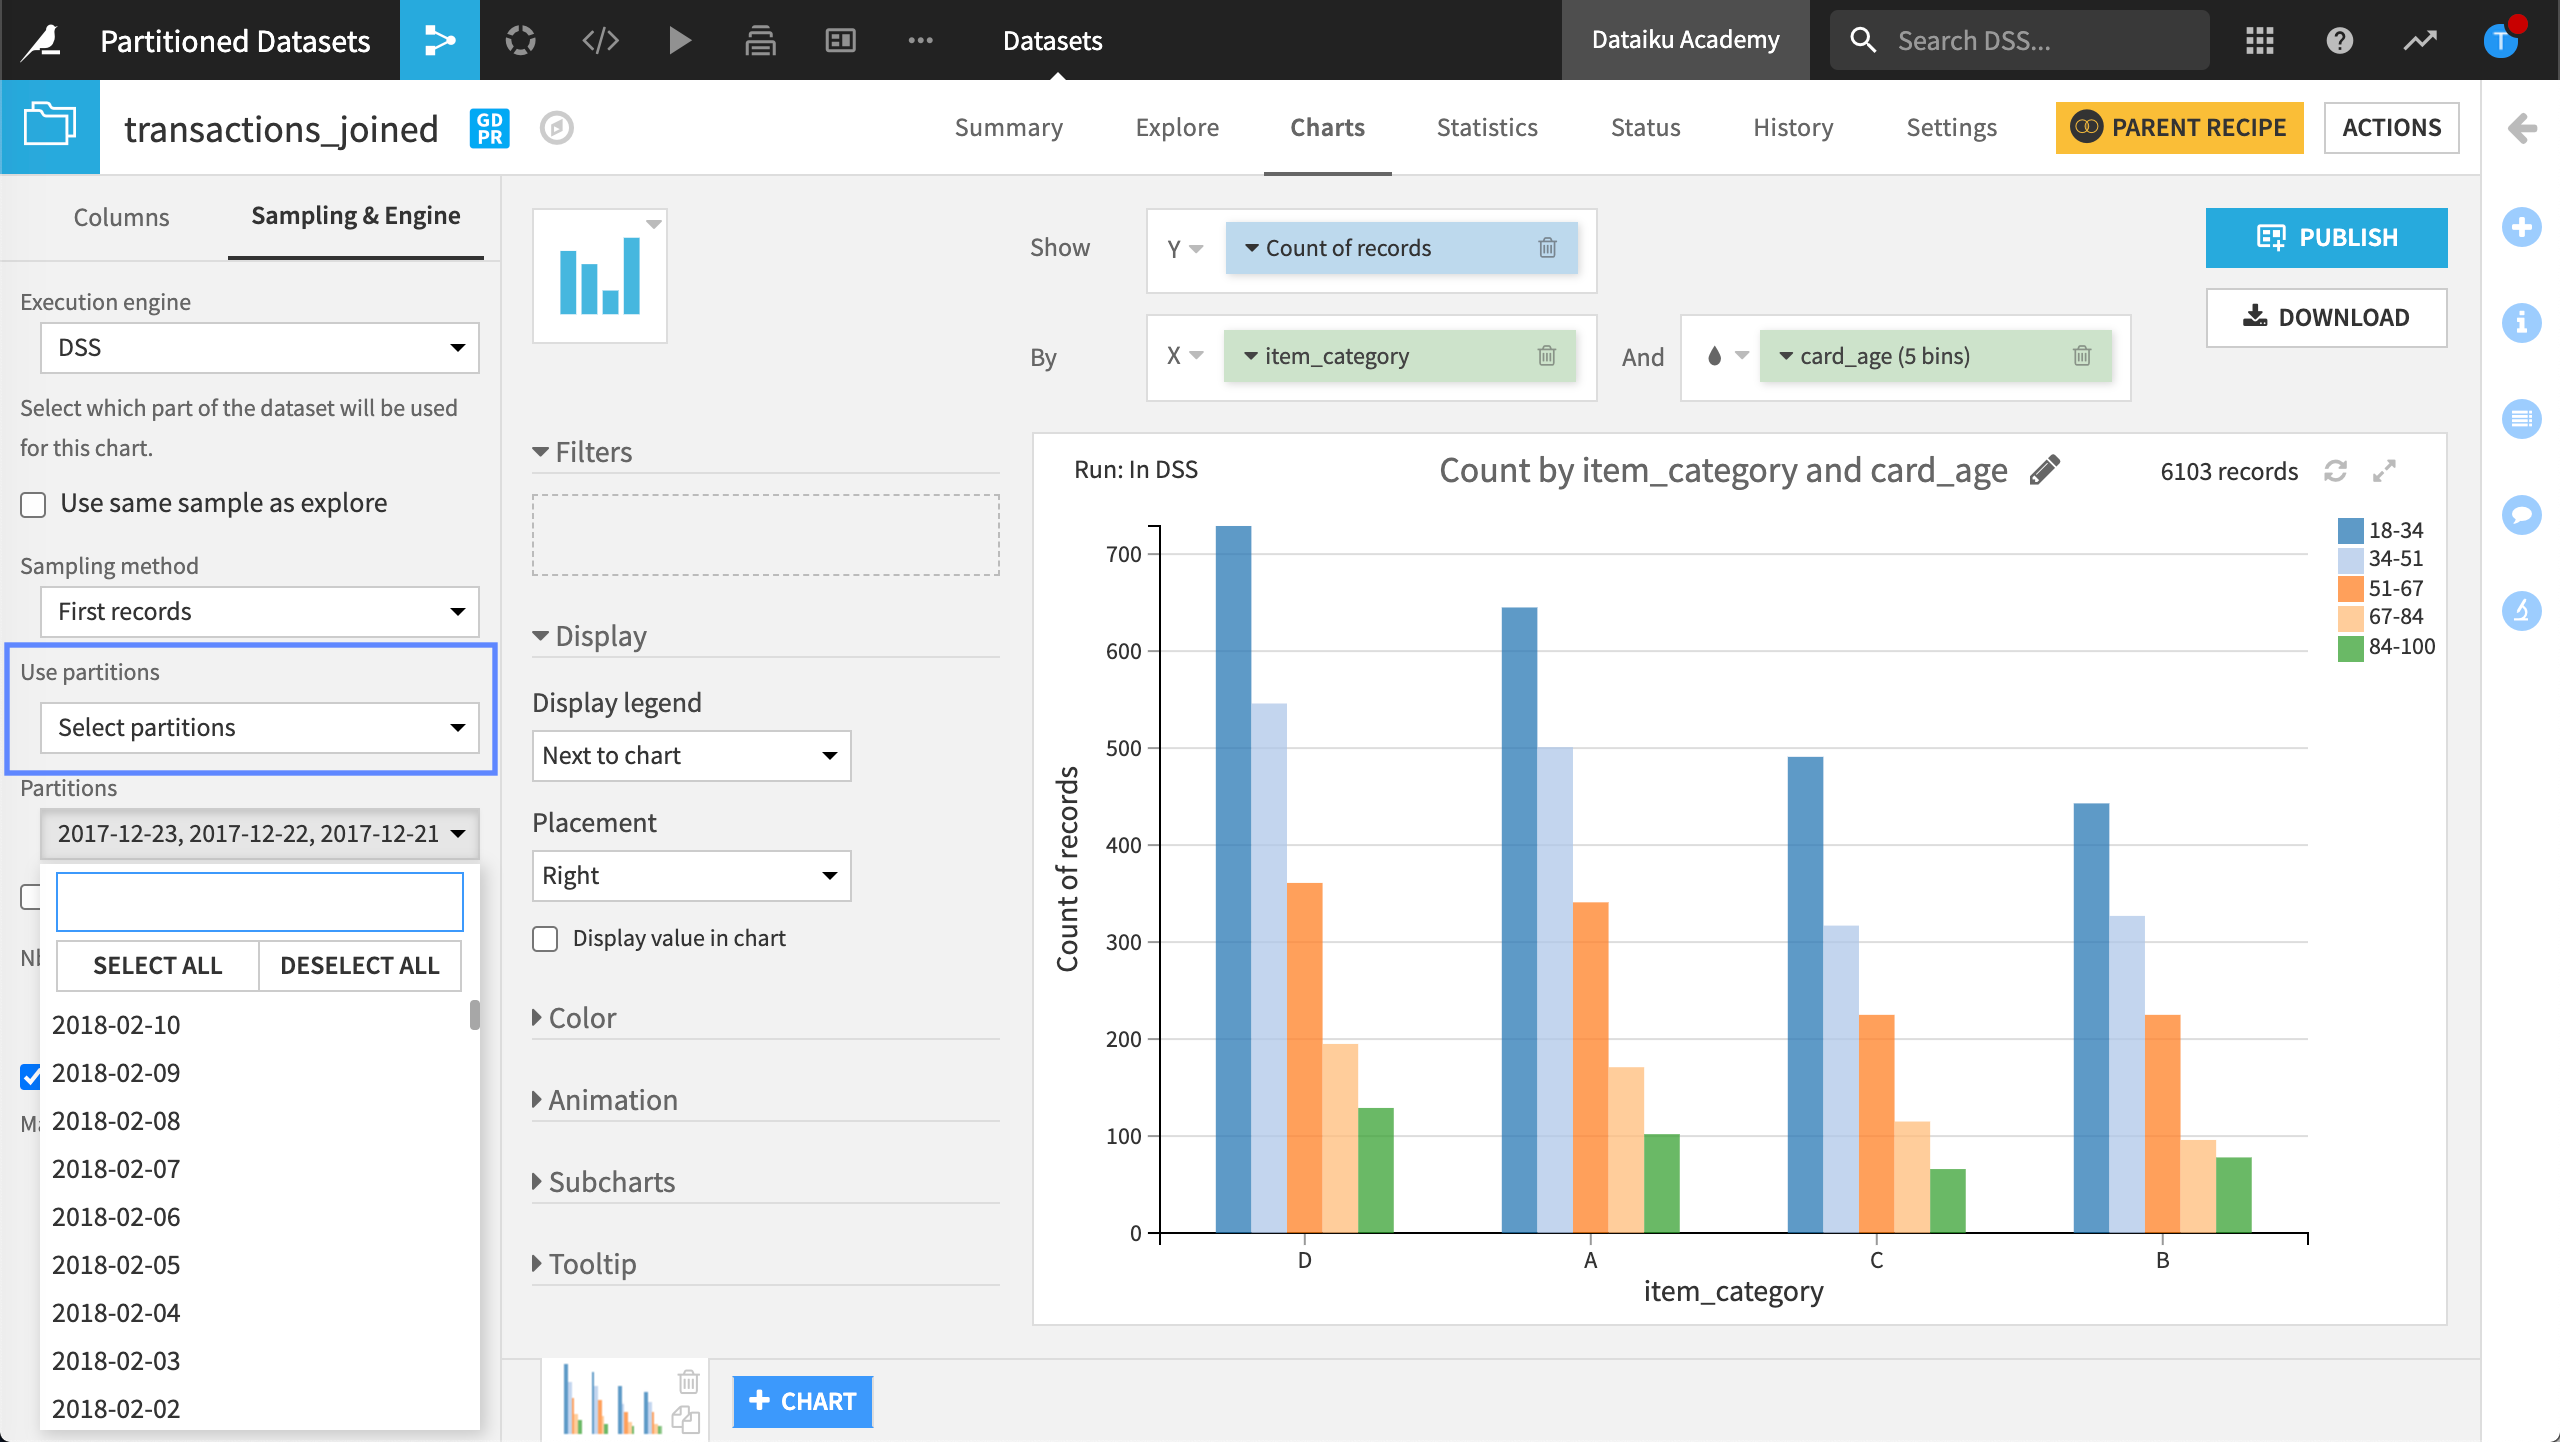
Charts tab#
By default, charts build visualizations over the same sample defined in the Explore tab of the dataset. We can change the sample used for creating the charts to target a specific partition or partitions of the data.
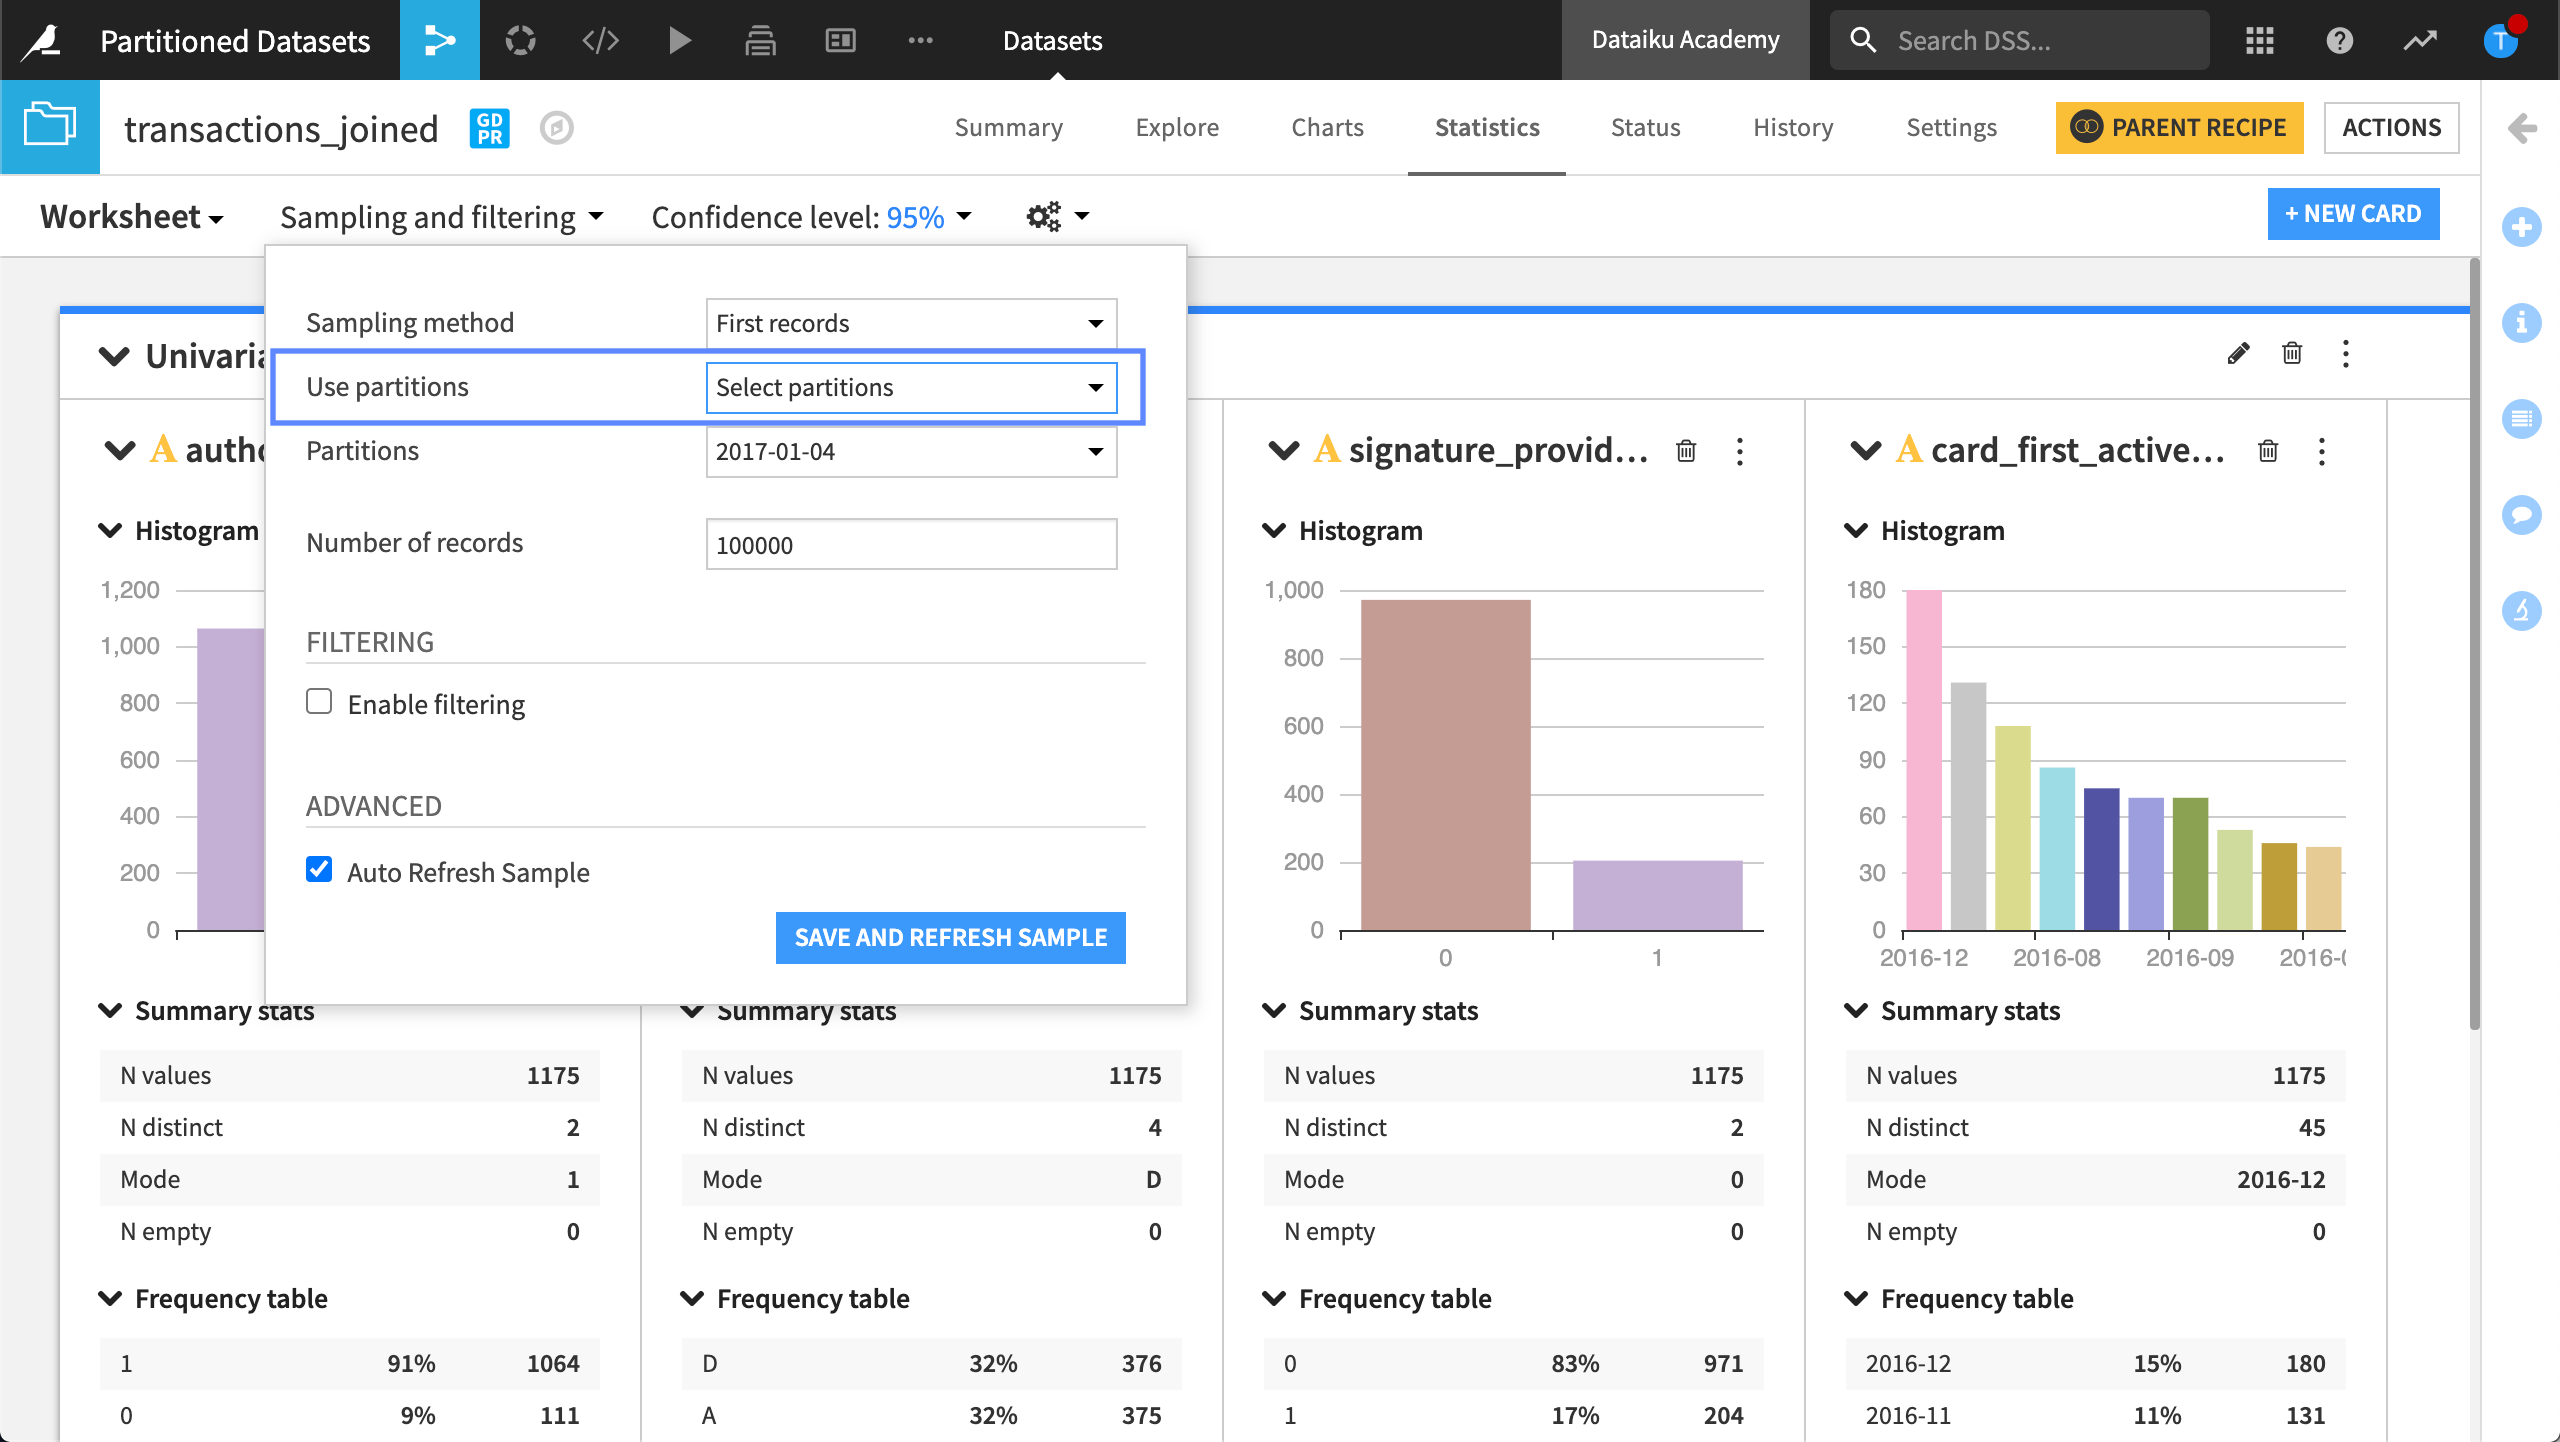
Statistics tab#
By default, Dataiku uses all available partitions when creating a statistical analysis. When creating an analysis, we can target a specific partition, or partitions, rather than all available partitions. For example, we can select the partition we want to use in each card.
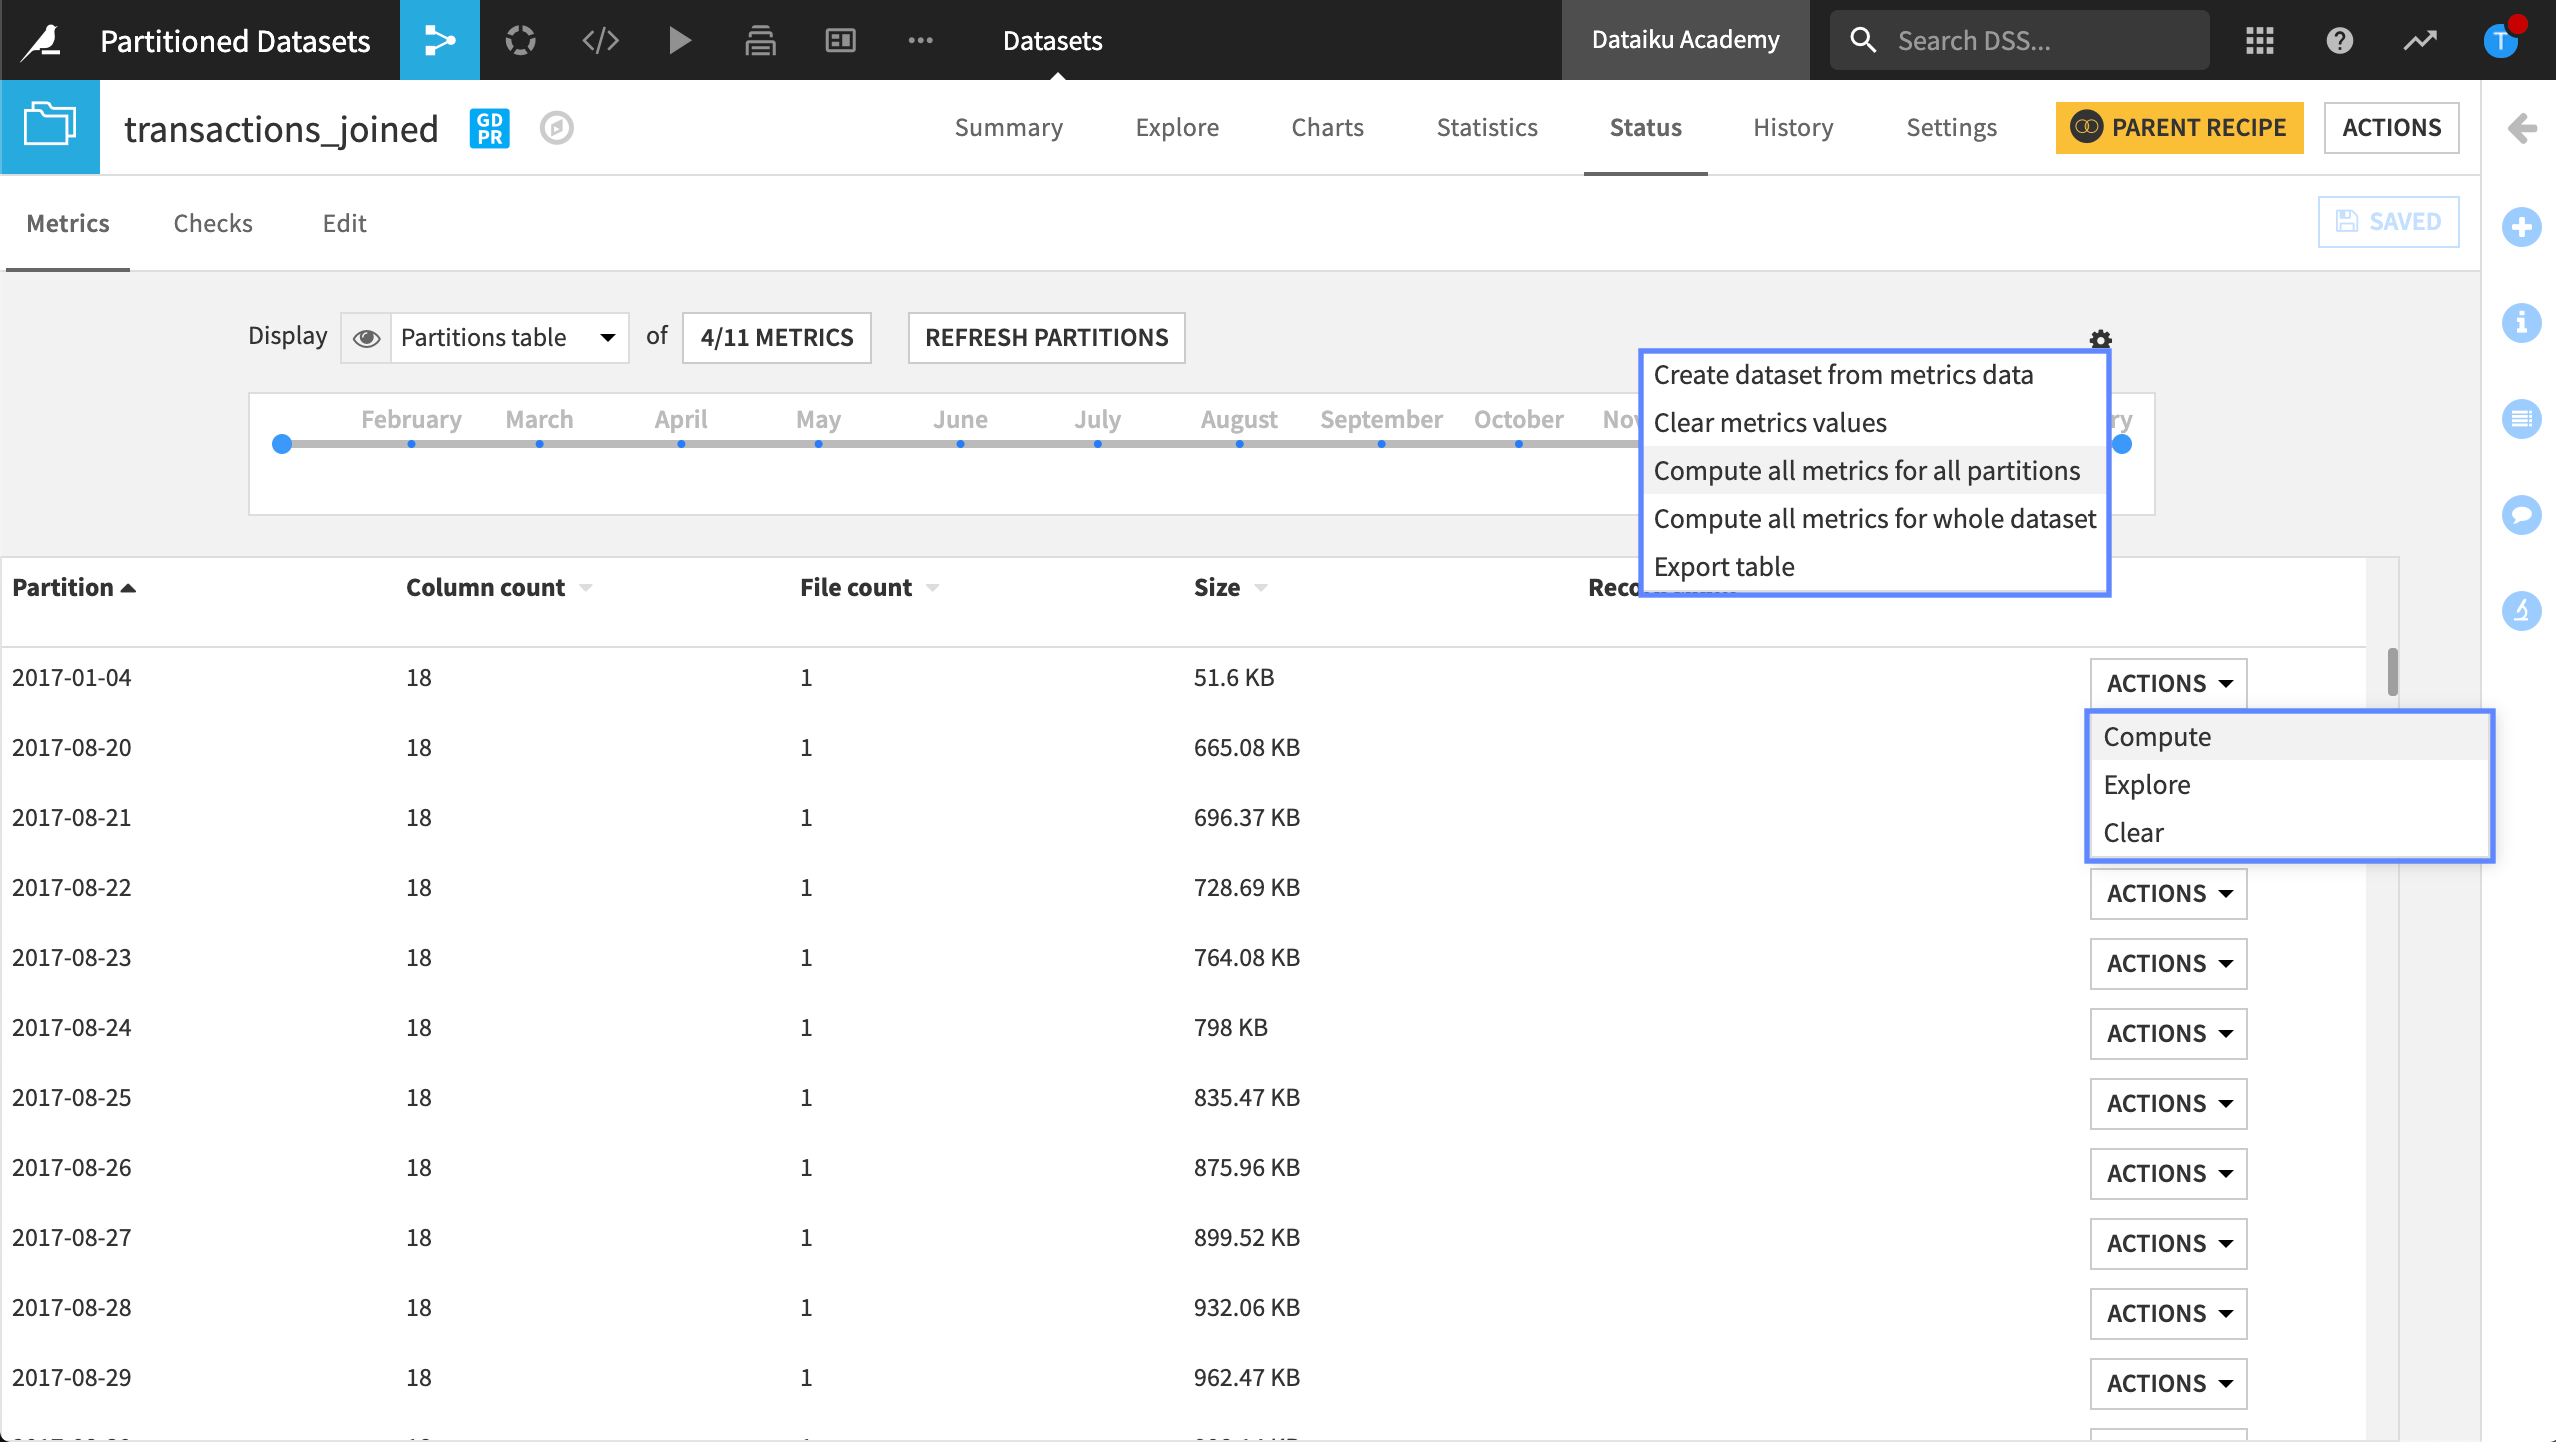
Status tab#
The Status tab of a dataset lets us compute metrics, or metadata, about our dataset. Once our dataset is partitioned, the options for computing expand. While we can still compute metrics for the whole dataset, we can also select to compute metrics at the partition level.
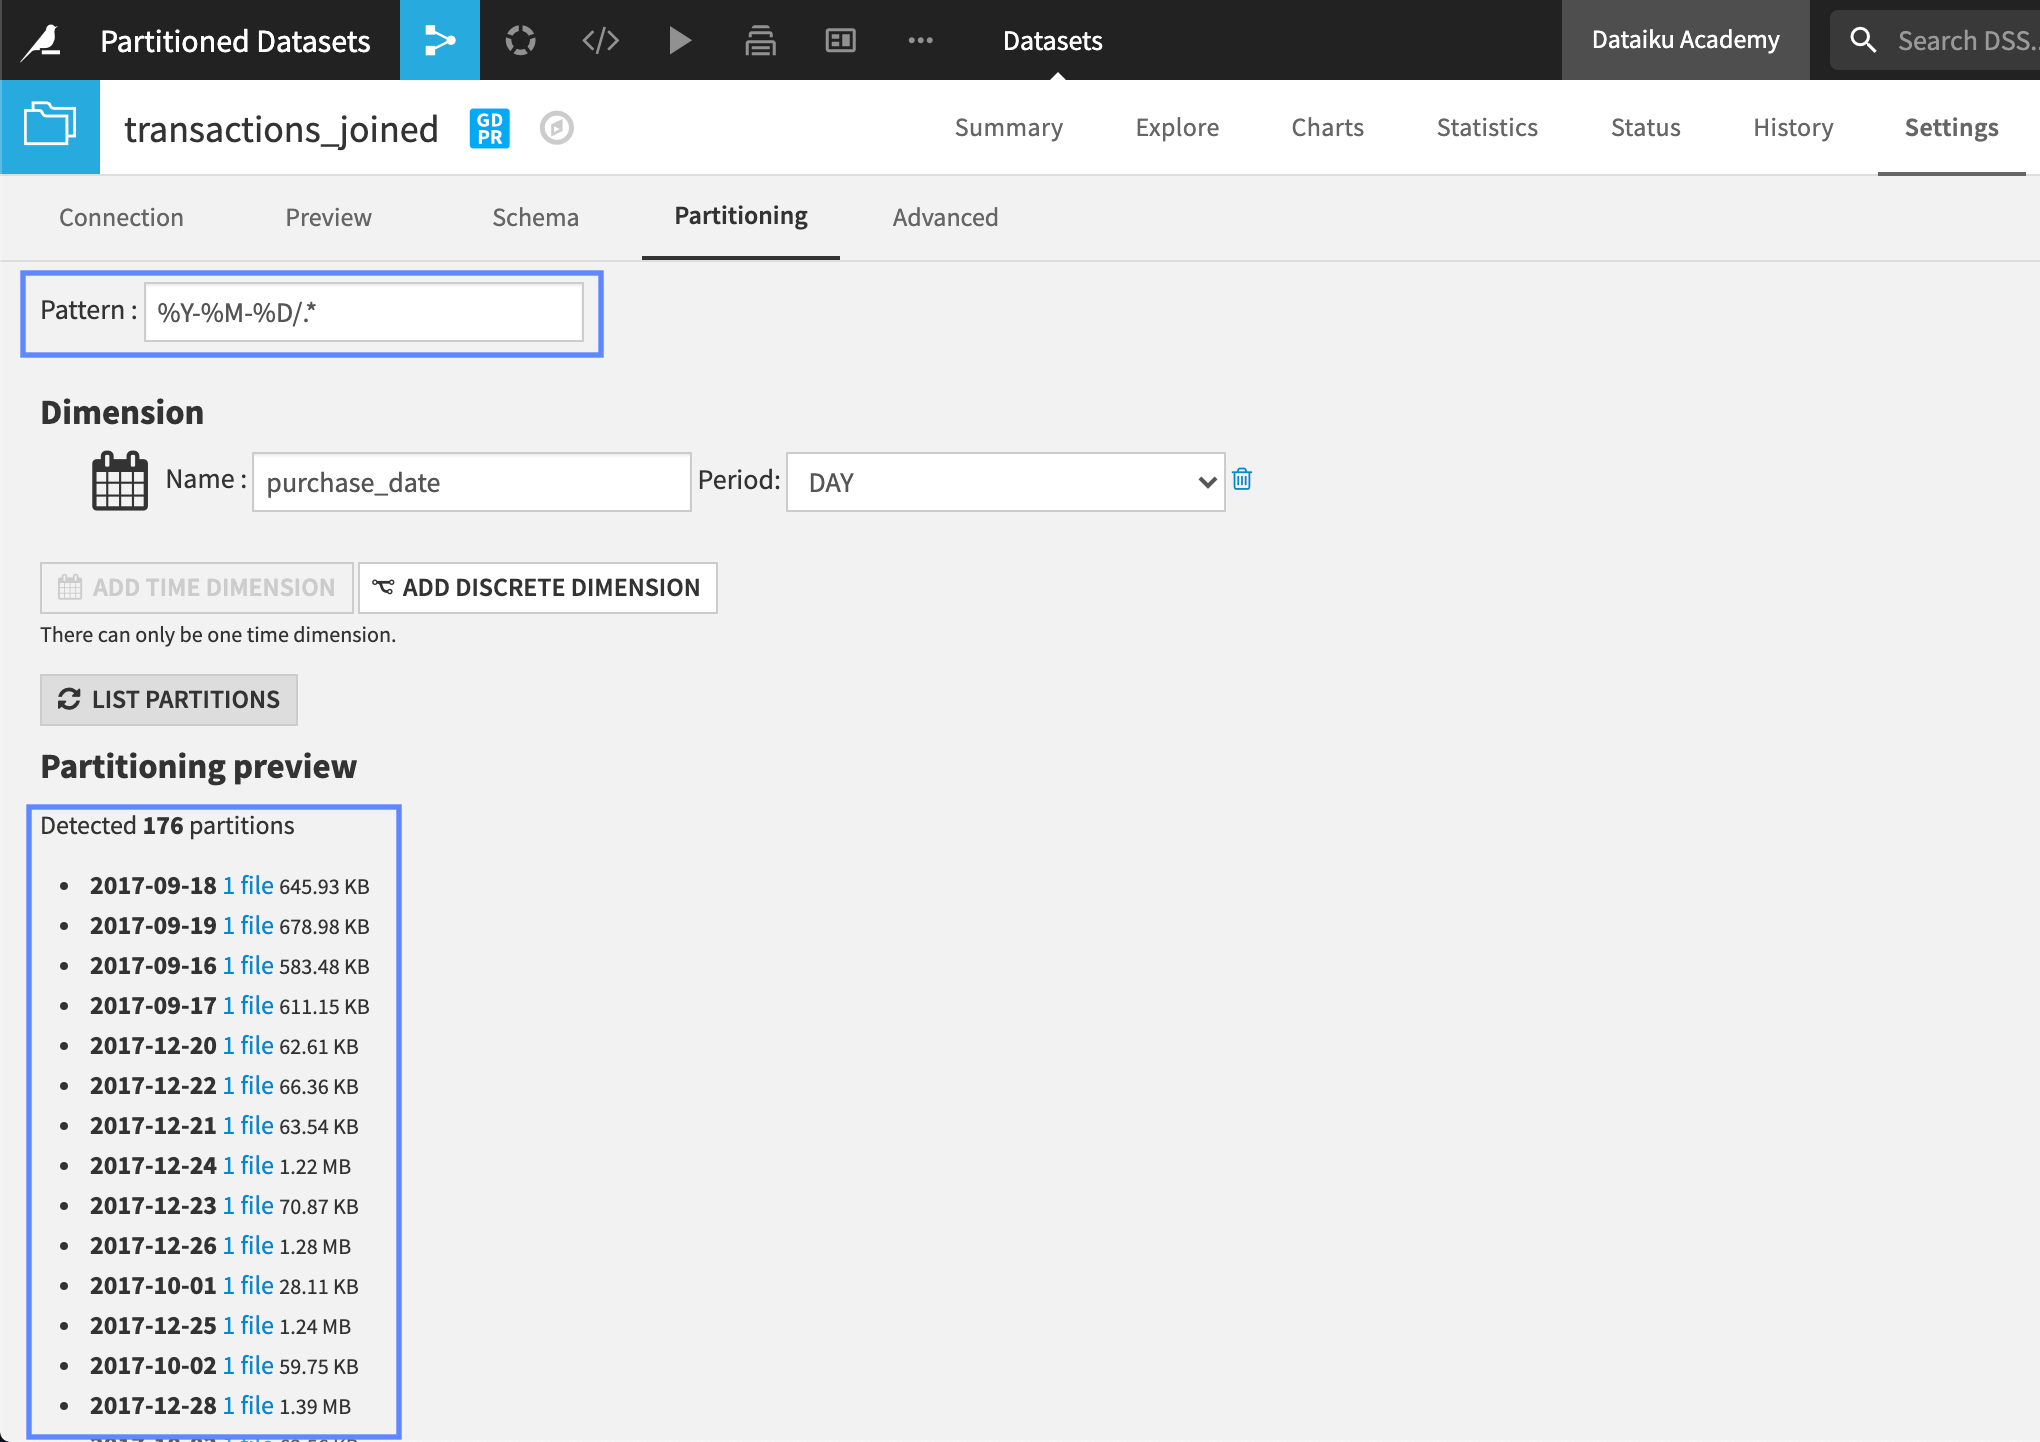
Settings tab#
We can also interact with partitioning from the Partitioning tab of the Settings page. For file-based partitioning, where partitioning is defined by the layout of the files on disk, we can list all partitions and preview how the files are stored on the Dataiku server.
The preview displays the number of partitions and includes a link to the corresponding file for the partition. Whenever we ask Dataiku to perform a computation on a partition, it starts by reading the corresponding file. To discover the pattern used to store the data in each partition, we can look at the Pattern field.
For SQL-based, or column-based, partitioning, the “Partitioning” tab displays a section dedicated to the configuration of our partitioning dimension.
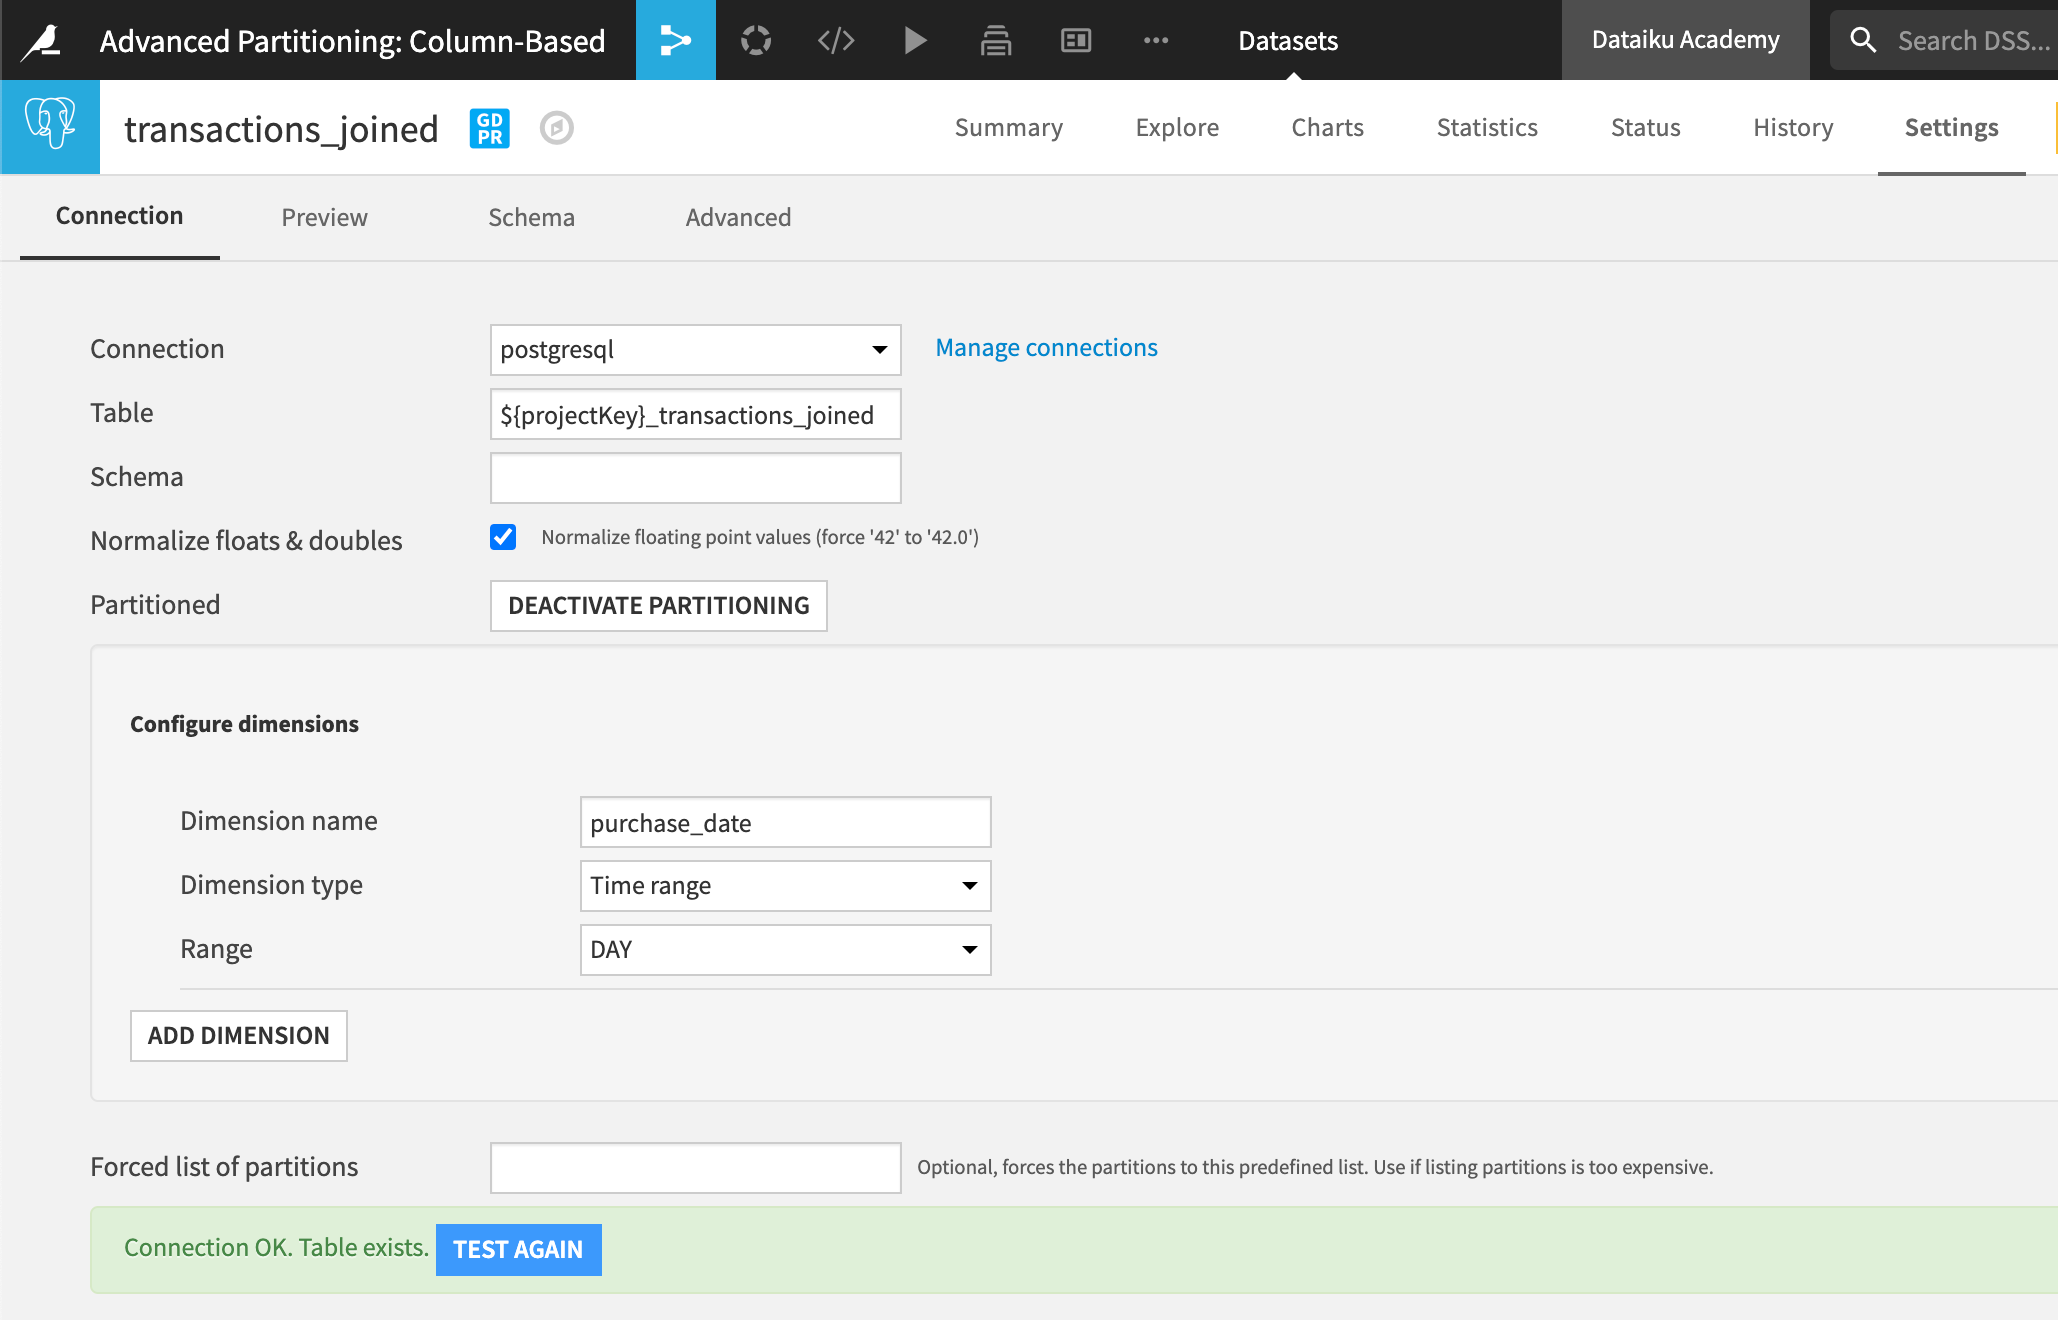
If we make changes to this section once our partitioning dimension is already set up and propagated across the Flow, then we would need to update the dataset dependencies for each dependent dataset in the Flow.
Flow views#
Using Flow Views, we can see where we’ve configured partitions in our Flow.
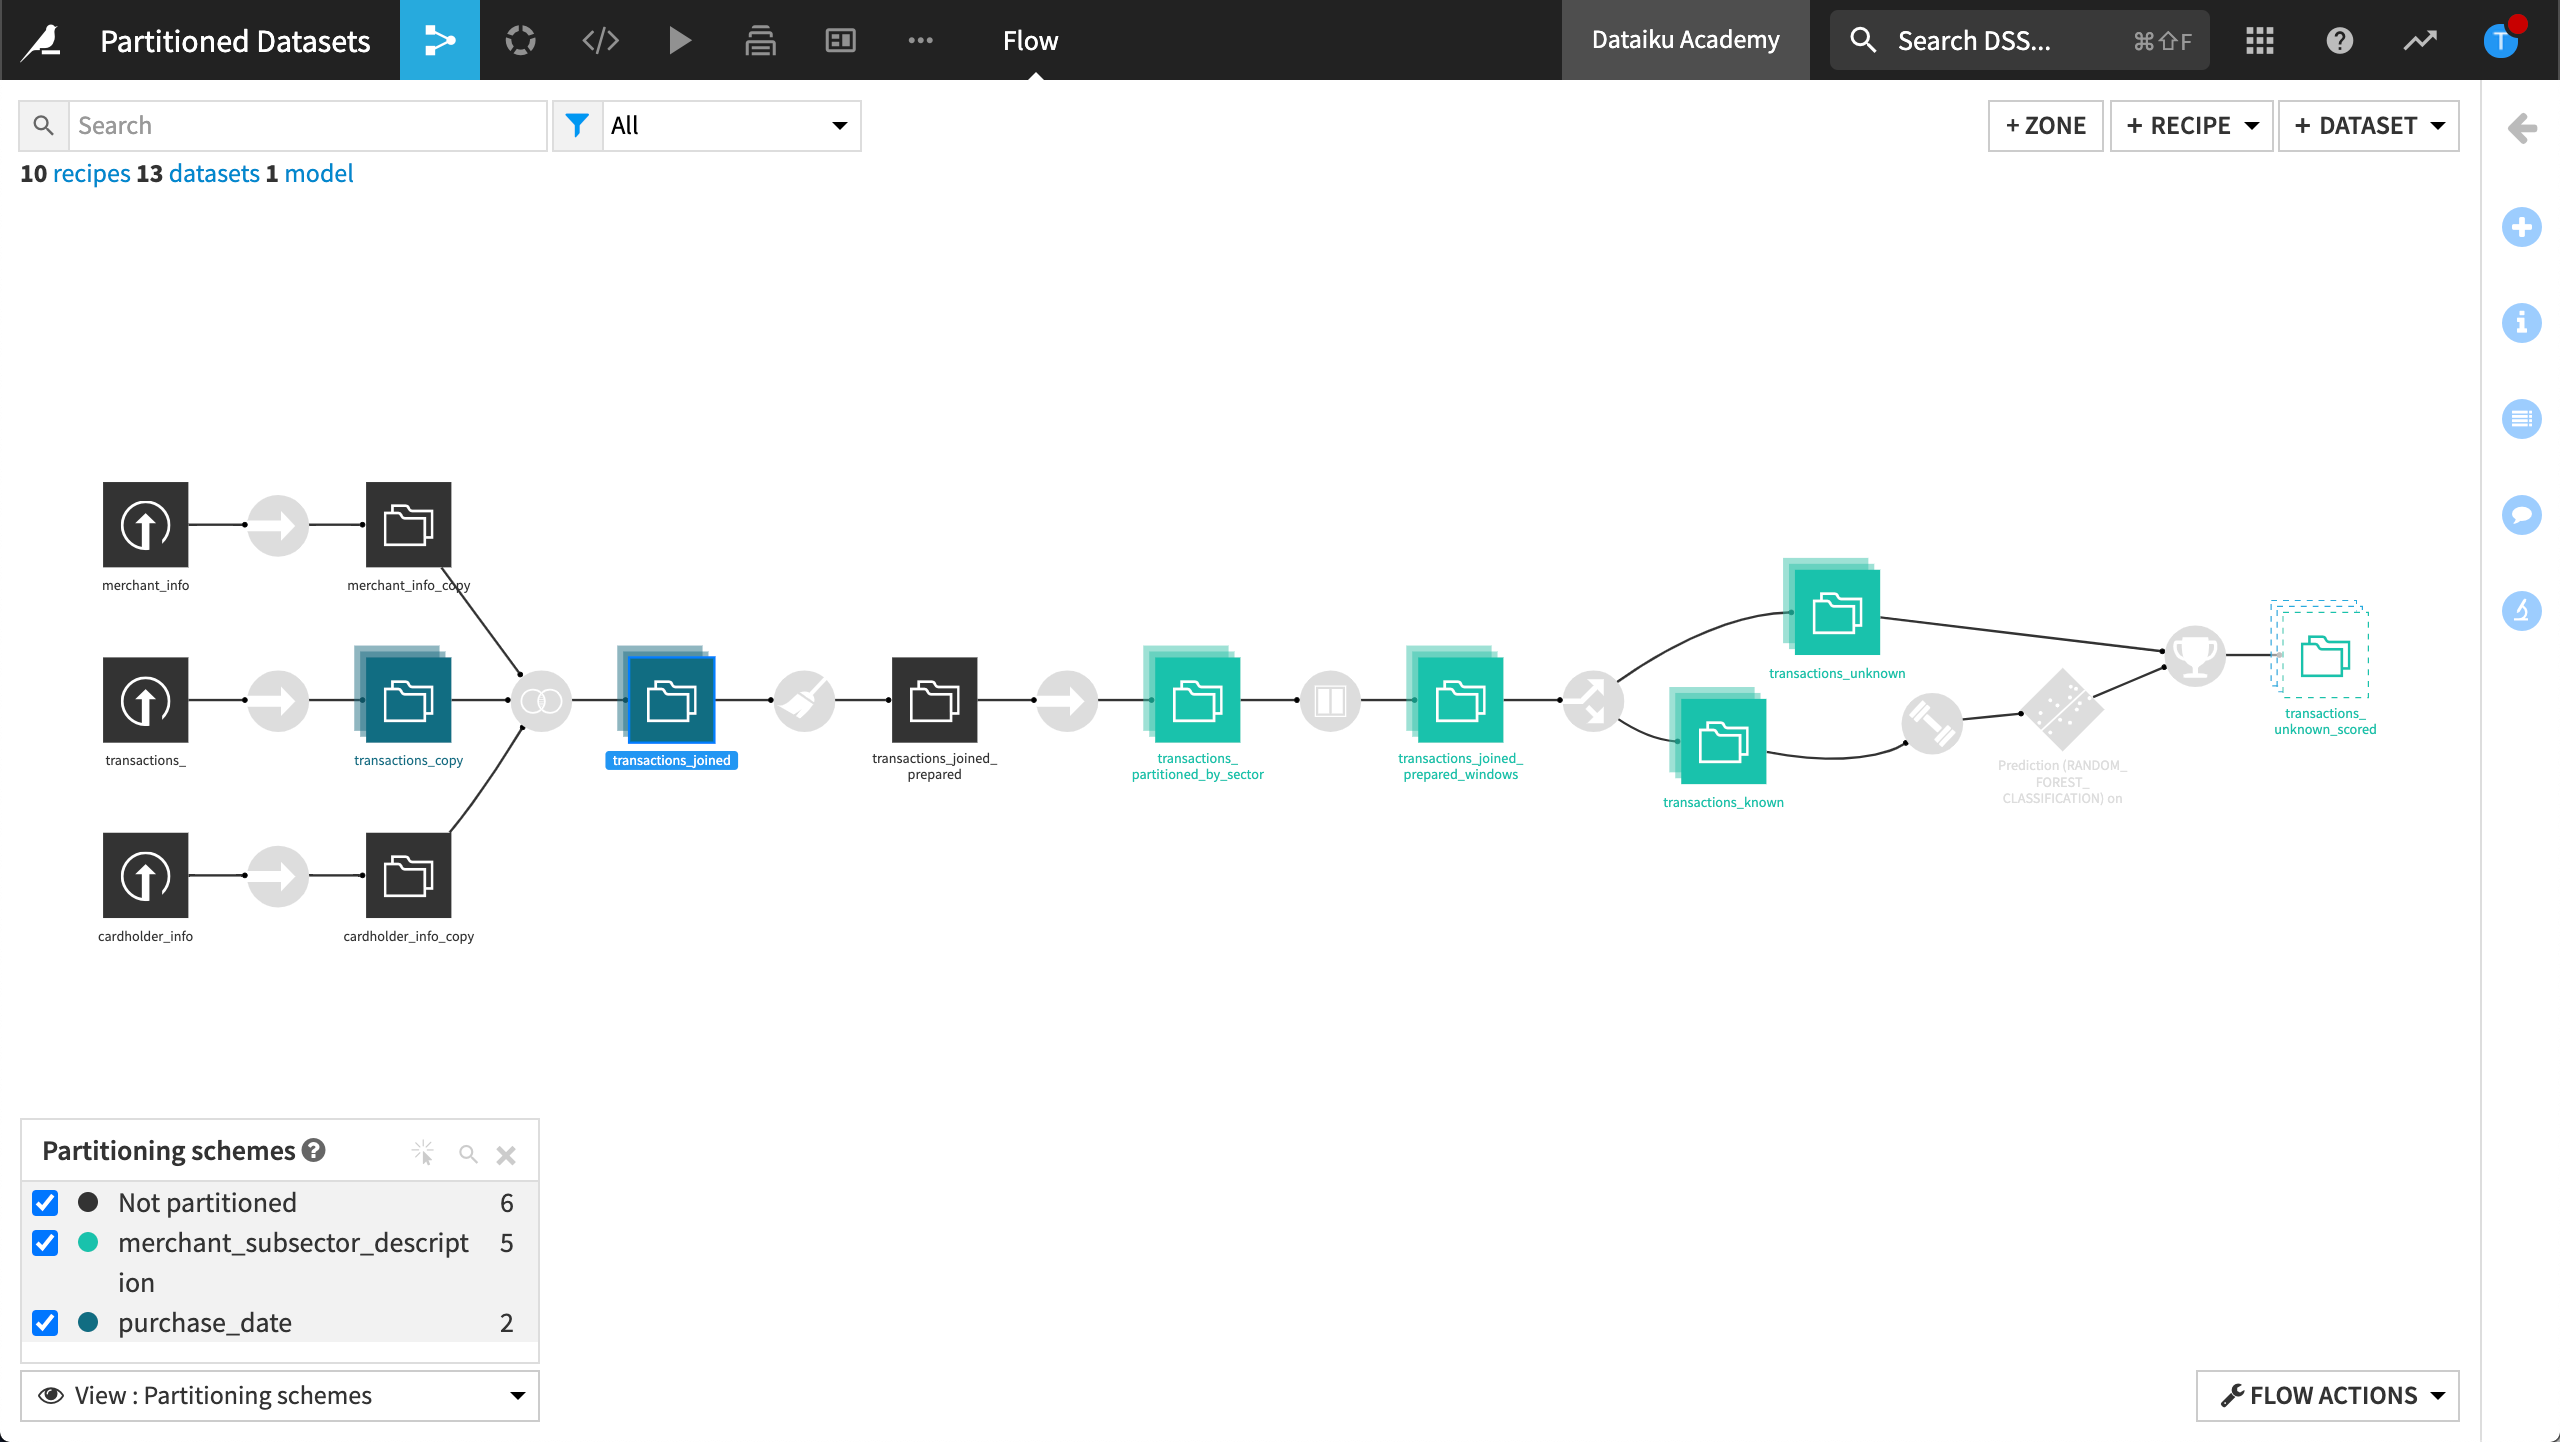
Partitioning schemes#
By selecting Partitioning schemes, Dataiku visually identifies the parts of the Flow where we’ve used partition dimensions. This gives us a visual way to validate our partition configuration.
Partitions count#
By selecting Partitions count, Dataiku visually identifies the number of partitions available on each dataset. This gives us a visual way to validate the consistency of our partitions among the entire Flow.
Next steps#
In this summary, we looked at some of the available options when interacting with a partitioned dataset. You can try out these options in the tutorials in the Partitioning course.