Generate features#
Before making any models with the joined dataset, let’s create a few more features that may be useful in predicting failure outcomes.
Because we’re still designing this workflow, we’ll create a sandbox environment that won’t create an output dataset—yet. By going into the Lab, we can test out such transformations, plus much more. Nothing is added back to the Flow until we’re done testing!
Note
See the Concept | Visual analyses in the Lab and Tutorial | Visual analyses in the Lab articles to learn how steps in an analytics workflow can move from the Lab to the Flow.
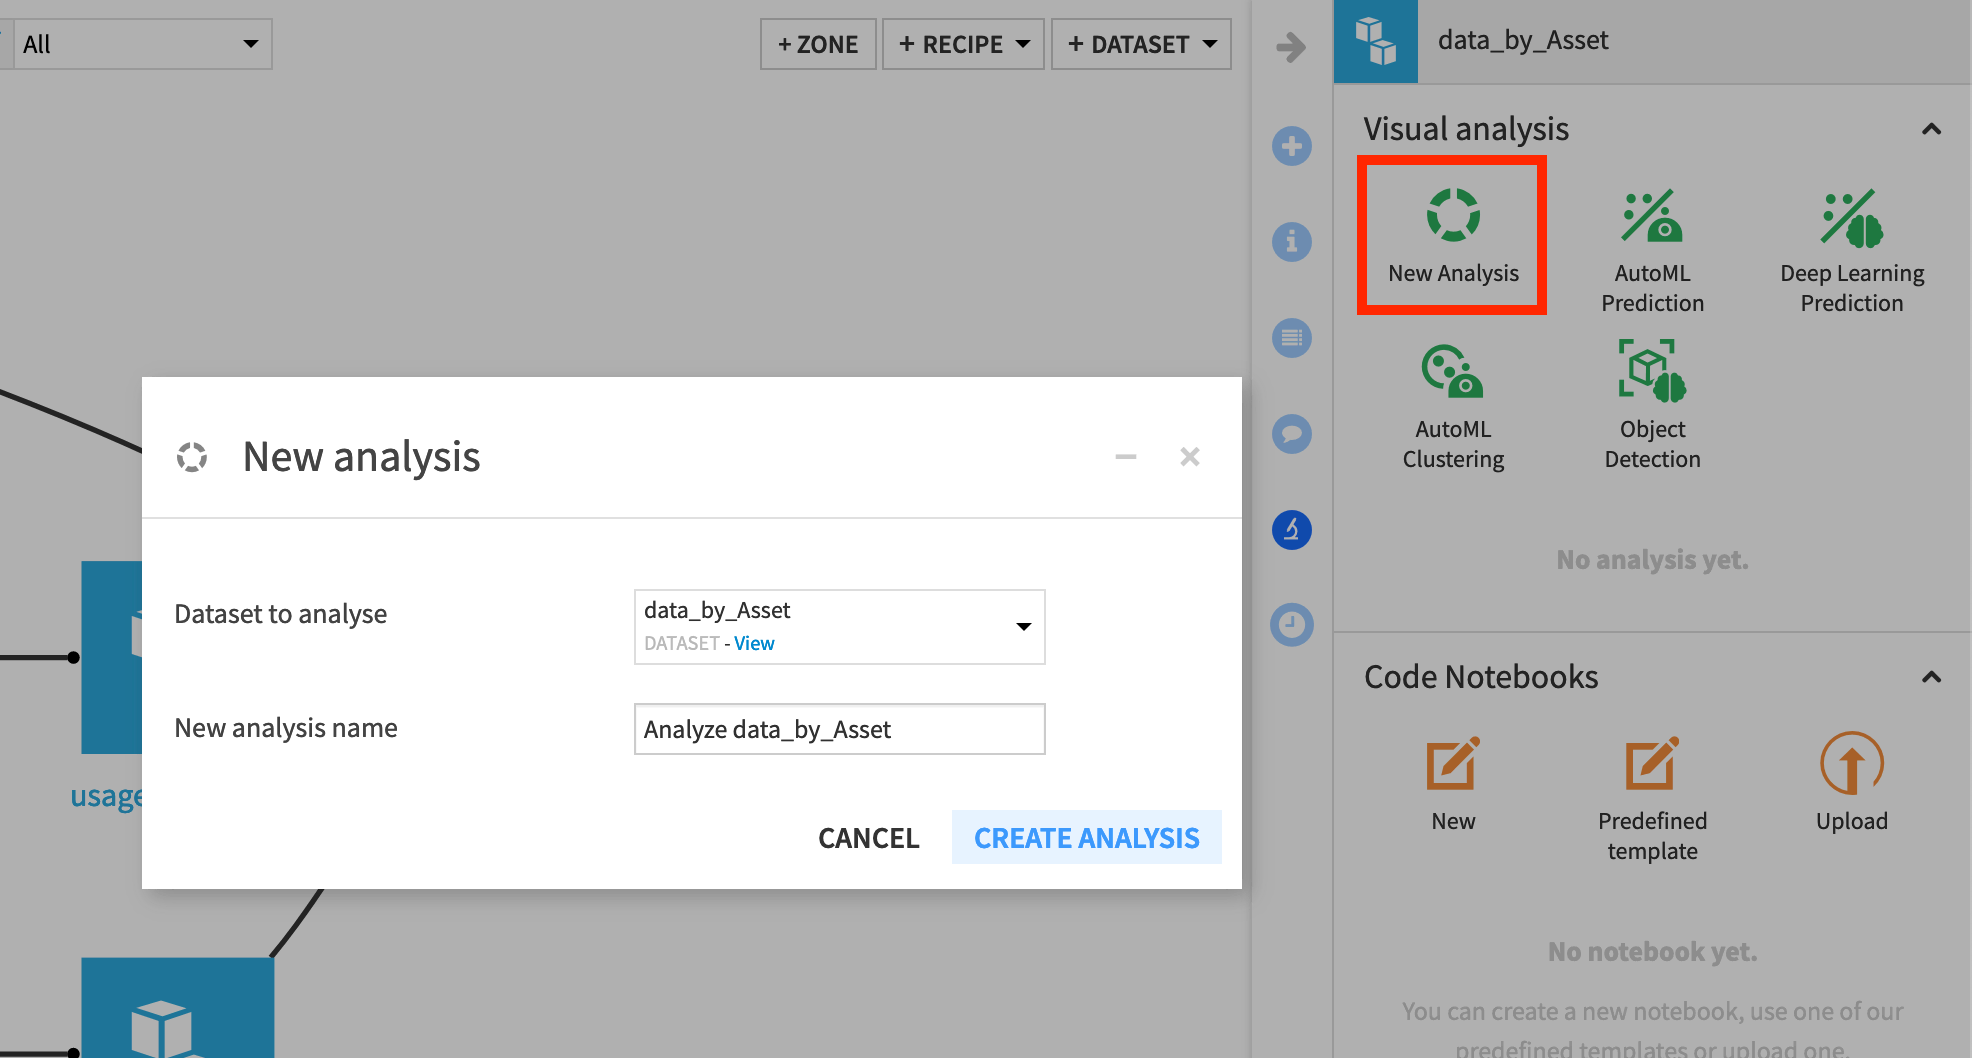
With the data_by_Asset dataset selected, navigate to the Lab in the right panel.
Create a New Analysis, and accept the default name
Analyze data_by_Asset.

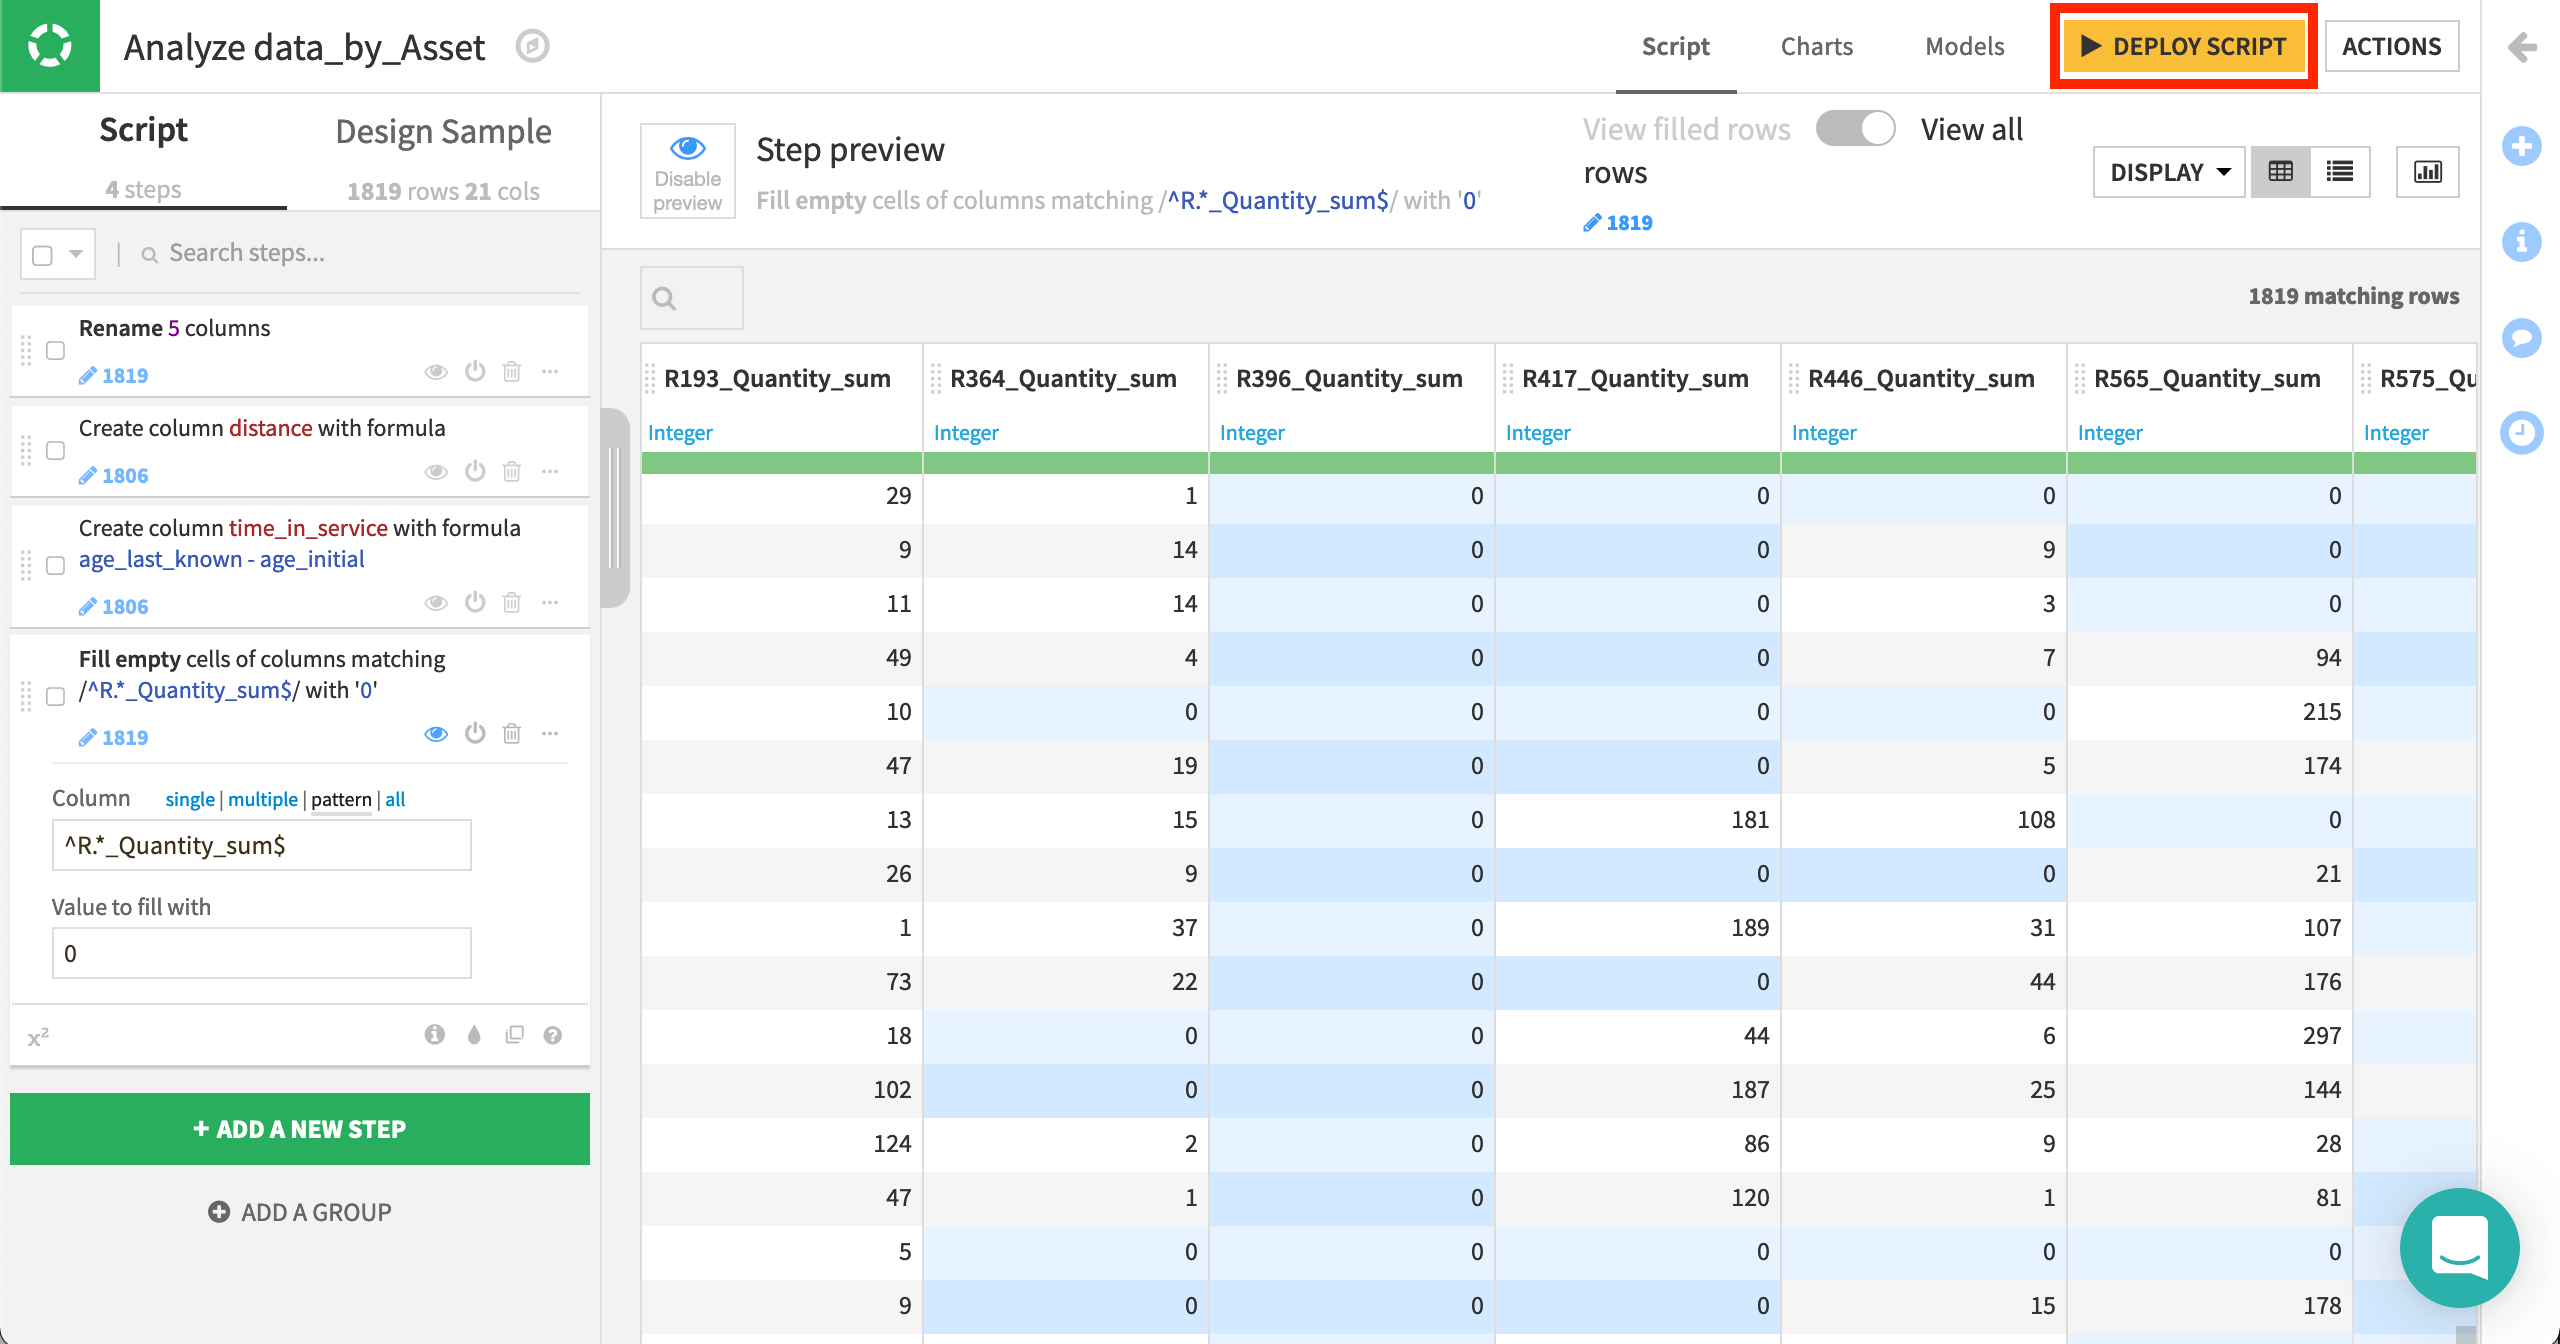
In the Script tab, which looks similar to a Prepare recipe, let’s first use the “Rename columns” processor to rename the following 5 columns.
Old name |
New name |
|---|---|
count |
times_measured |
Time_min |
age_initial |
Time_max |
age_last_known |
Use_min |
distance_initial |
Use_max |
distance_last_known |
Create two new features with the Formula processor.
distancefrom the expression,distance_last_known - distance_initialtime_in_servicefrom the expression,age_last_known - age_initial
Use the Fill empty cells with fixed value processor to replace empty values with 0 in columns representing reasons. The regular expression
^R.*_Quantity_sum$is handy here.

Once we’re satisfied with these features, we can deploy the script of the visual analysis as a Prepare recipe so all collaborators can see these data preparation steps in the Flow.
From the Script tab of the visual analysis, click the yellow Deploy Script button at the top right.
Accept the default output name, and click Deploy.
Then click to Run the Prepare recipe.
Note
Here we’ve taken the approach of deploying the Lab script to the Flow as a Prepare recipe. It’s also possible though to keep these data preparation steps within the visual analysis as part of the model object (which we’ll see). This can be helpful in some situations, such as deploying model as prediction endpoints.

