Explore the data#
Once you’ve imported a dataset, you’ll want to start exploring it through the Explore and Charts tabs!
The Explore tab of a dataset provides a tabular view of your data where you can start to examine it.
The Charts tab has a drag-and-drop interface for data visualizations.
Objectives#
In this section, you will:
Learn about the sampling method for a dataset.
Compute the row count of a dataset.
Analyze a column.
Visualize your data using charts.
Dataset sampling#
When working with large datasets, Dataiku doesn’t show all the data at once. Instead, it displays a smaller sample to ensure smooth and responsive interactions.
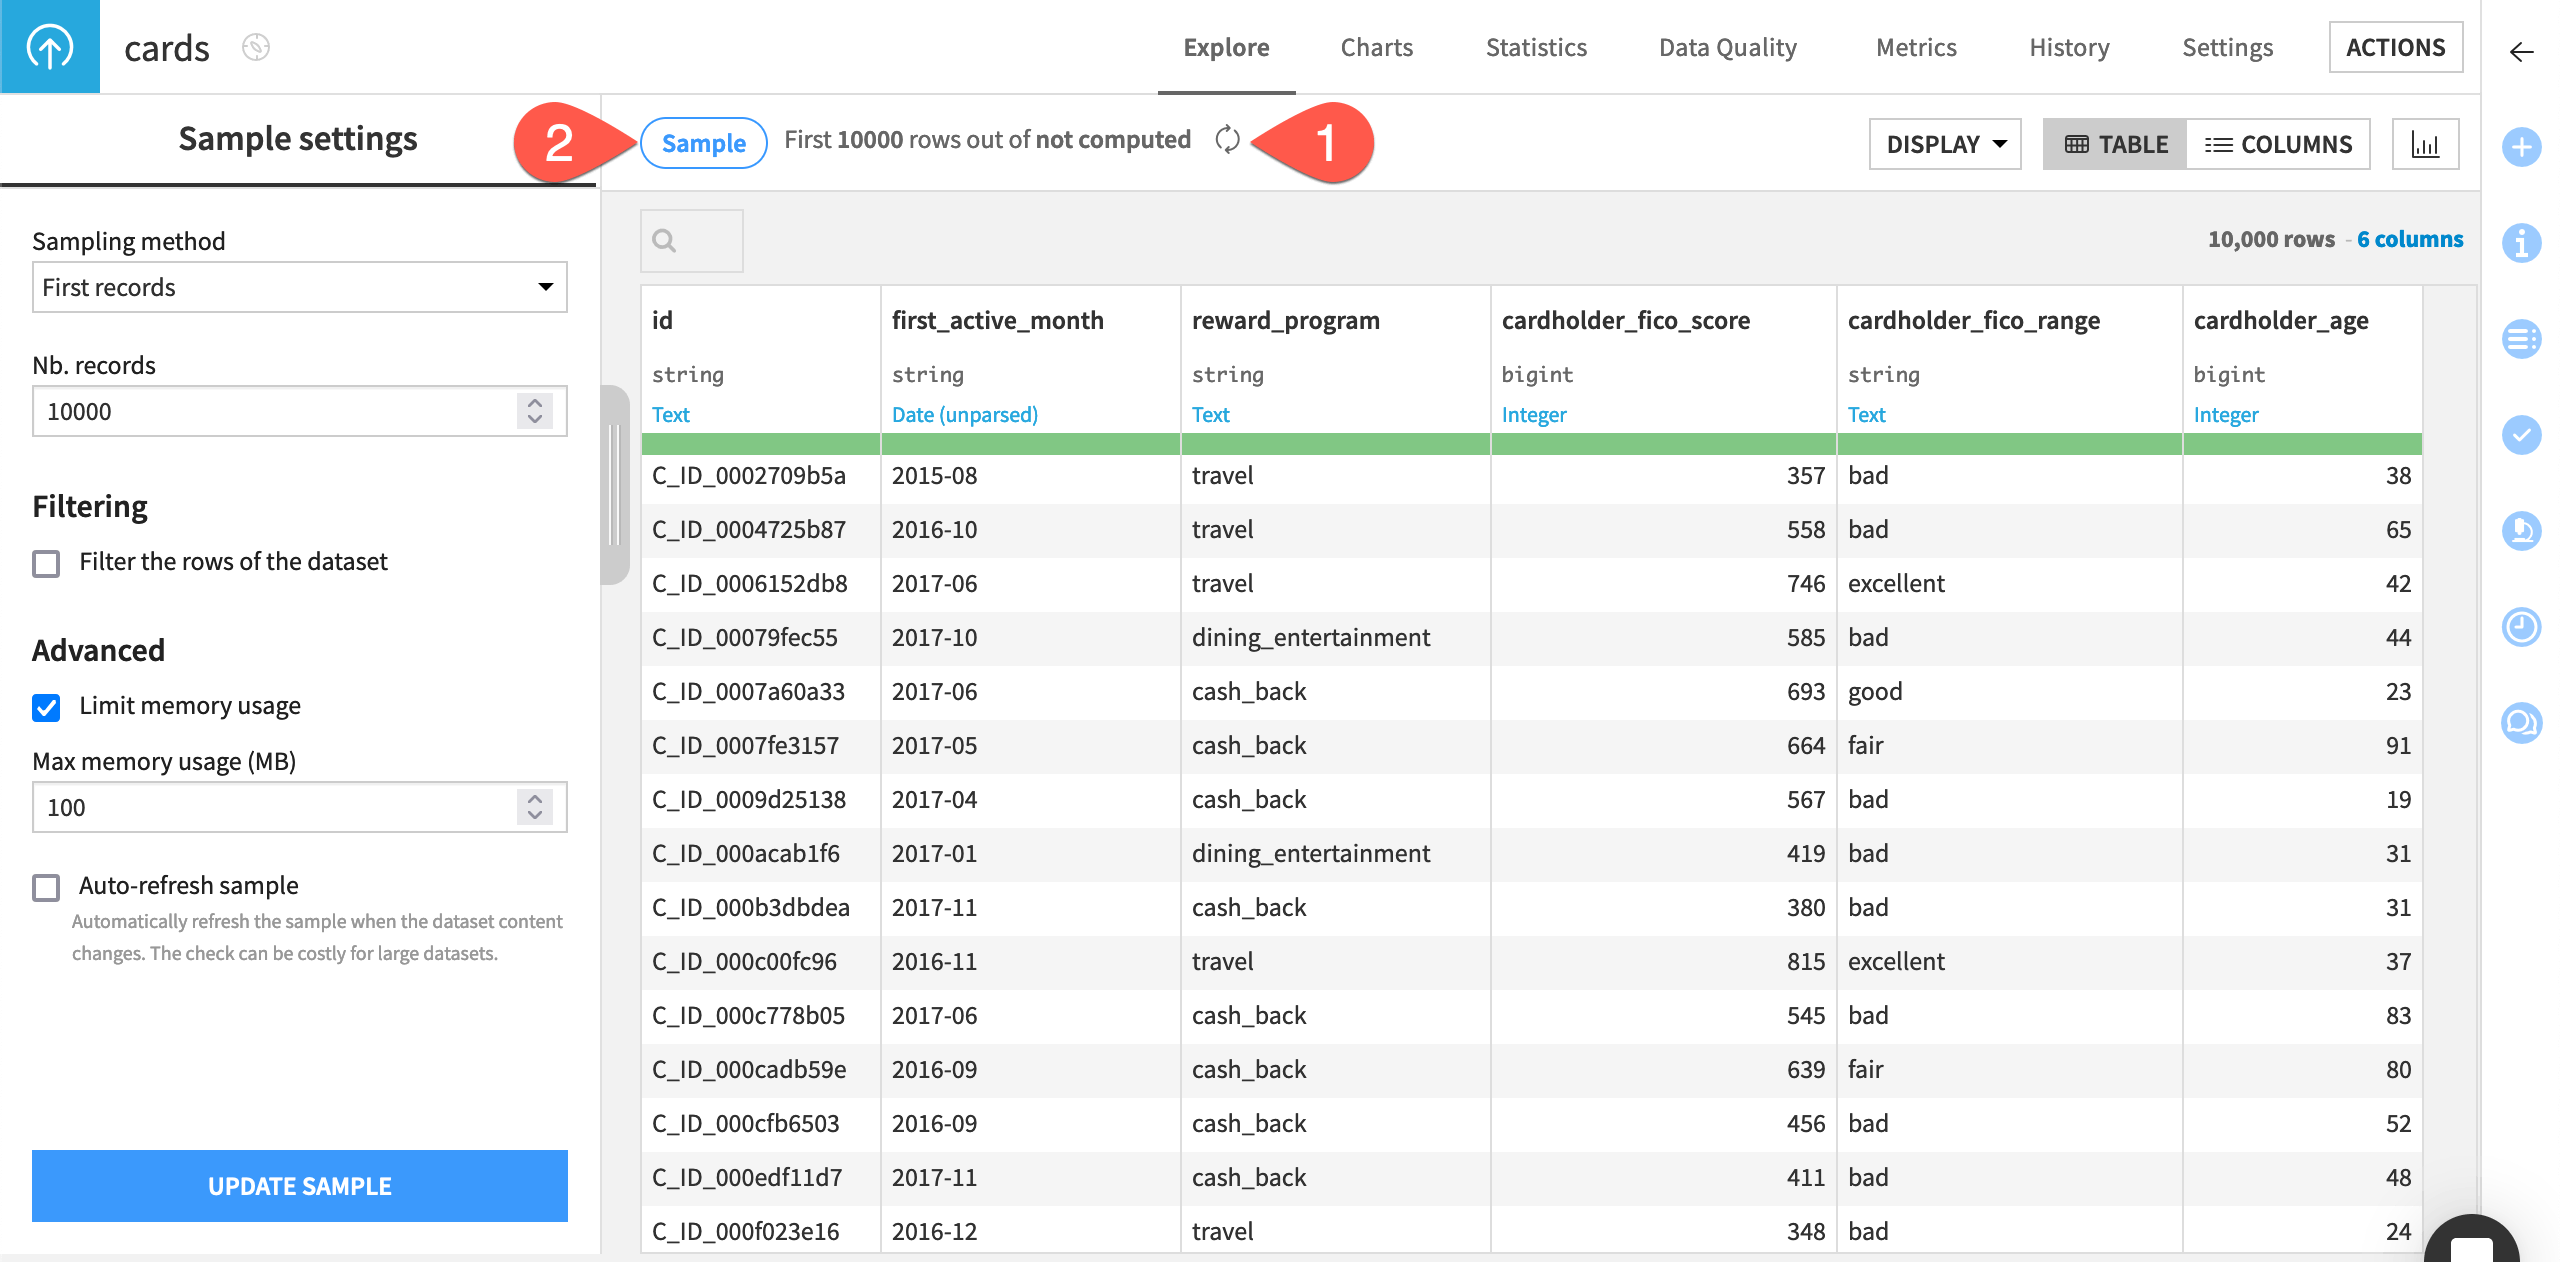
You can see the sampling method in the top left of the Explore tab. By default, the sample includes the first 10,000 records of the dataset.
To view the total row count of your dataset, select Compute row count (the cyclic arrows icon).
To change the sample settings of a dataset, select the Sample badge, which opens a panel on the left.
See also
For more information, see the Sampling article in the reference documentation.
Storage type and meaning of dataset columns#
In the dataset, beneath each column name, Dataiku indicates:
The storage type (in gray)
The meaning (in blue)
Here, Dataiku detects a meaning of text for the id column, based upon the fact that most values in the sample for customer_id are strings.
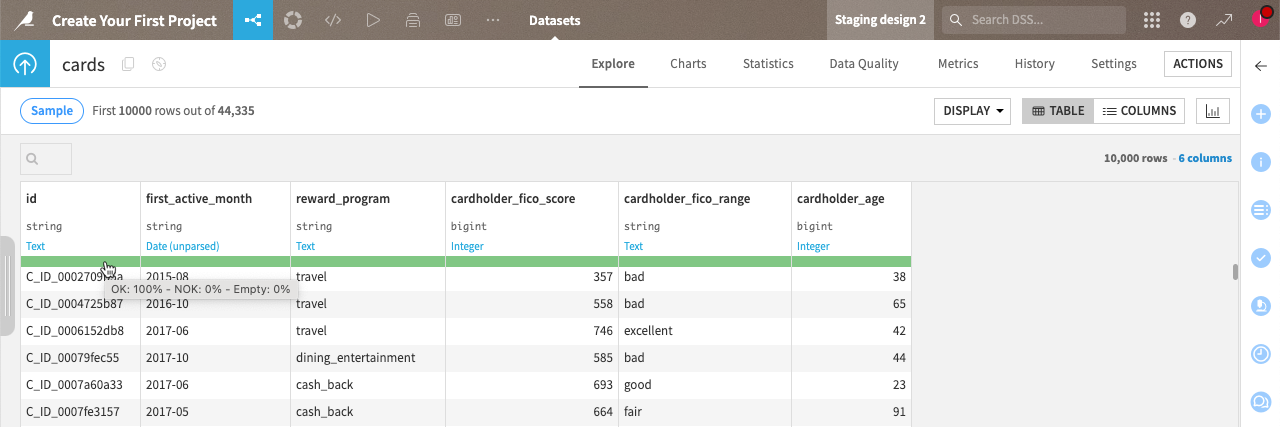
The data quality bar shows green for all columns, which means that all rows are valid.
Note
This dataset doesn’t have any NOK (Not OK) or missing values. But if it did:
NOK values appear red in both the data quality bar and column cells.
Missing values appear gray in both the data quality bar and column cells.
See also
For more information, see the Schemas, storage types and meanings article in the reference documentation.
Analyze window#
You can analyze the content of each column using the Analyze window. Let’s analyze the content of the cardholder_fico_range column. To do so:
Click on the column name cardholder_fico_range, and select Analyze from the dropdown menu.
The Analyze window opens, showing the analysis of the data sample.
To extend the analysis to the whole data, select Whole data instead of sample in the dropdown next to the column name, then click Save and Compute.
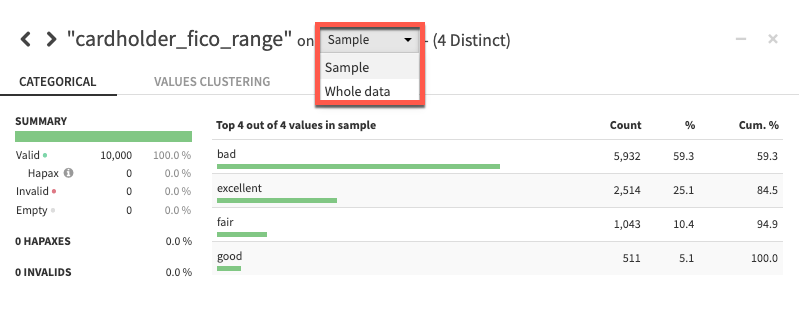
Click the arrows next to the column name to switch from one column to another.
Important
When analyzing a whole dataset, click Compute again at the top of the window to display the analysis for the whole data of the new column. It would be automatically computed if just looking at the sample.
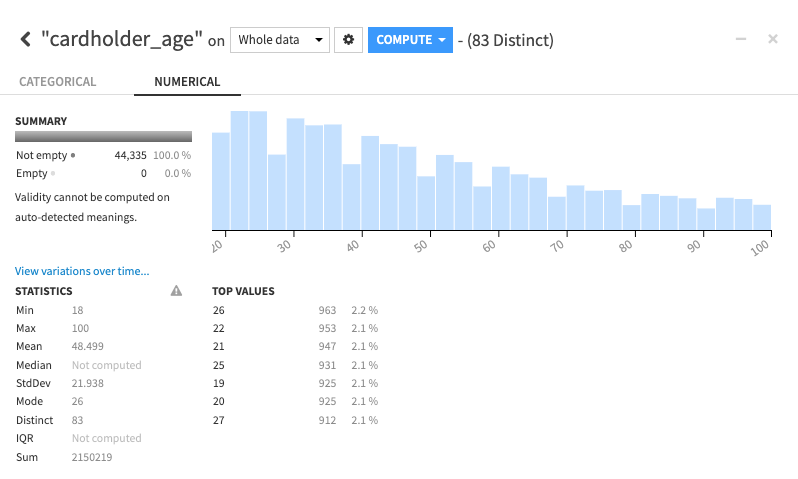
Close the window when you’re done with the analysis.
Charts#
You can use charts to explore a dataset. For example, we might want to know which reward program is the most frequent for specific age ranges.
Here, you’ll use a bar chart and a pie chart to explore two different perspectives.
Add a vertical bars chart#
Click on the Charts tab (or use the keyboard shortcut
g+v).From the Data panel, drag:
Count of records to the Y variable.
reward_program to the X variable.
cardholder_age to the color droplet field.
The chart reveals that the cash_back reward program is the most popular, whatever the age of card holders.
Important
The Sample badge at the top of the chart indicates that the chart, like the dataset, is also a sample. Clicking on the badge allows you to change the sampling method if needed.
Open the dropdown menu of the cardholder_age variable and check the Adjust bin size for nicer bounds option to have five nicer bins for the age of card holders.
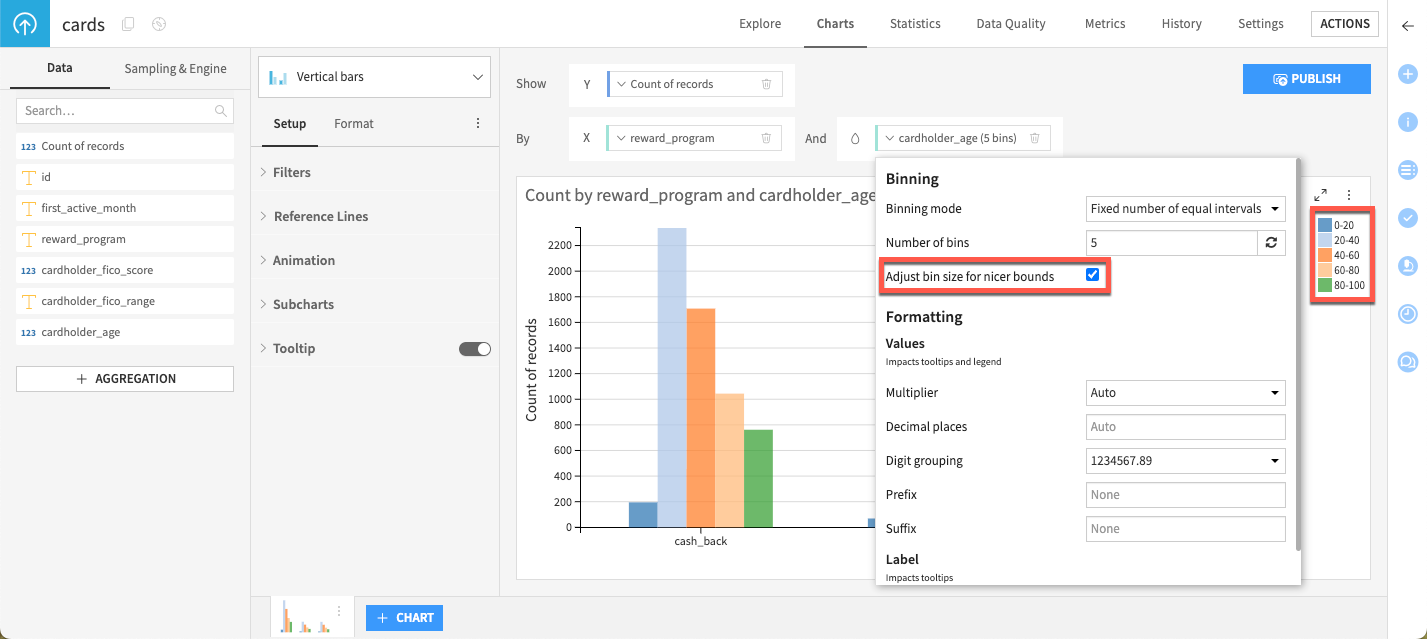
On the chart, hover over any of the orange bars to filter on card holders aged between 40 and 60. Once the menu appears, click on the bar to keep the menu on, and select the drill down icon (the down arrow) at the right of the cardholder_age variable.
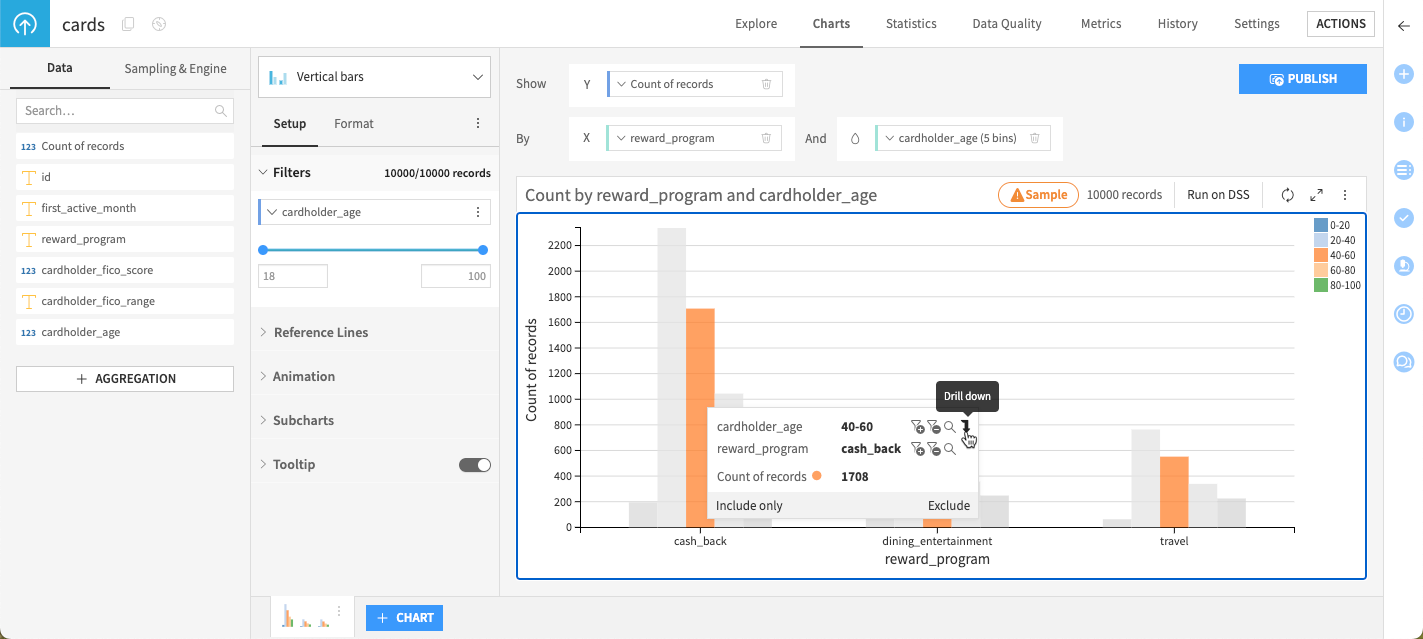
This action adds a filter to the Filters section of the Setup tab of the left panel.
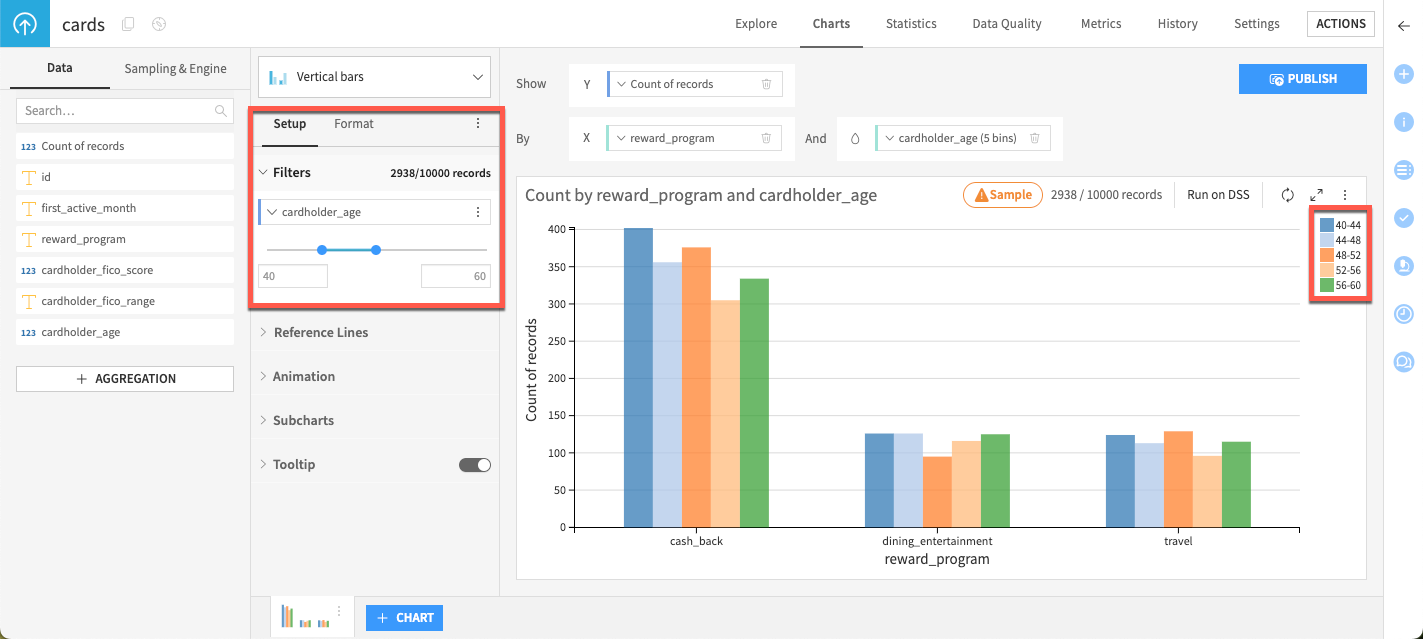
To go back to the default display, extend the age range from
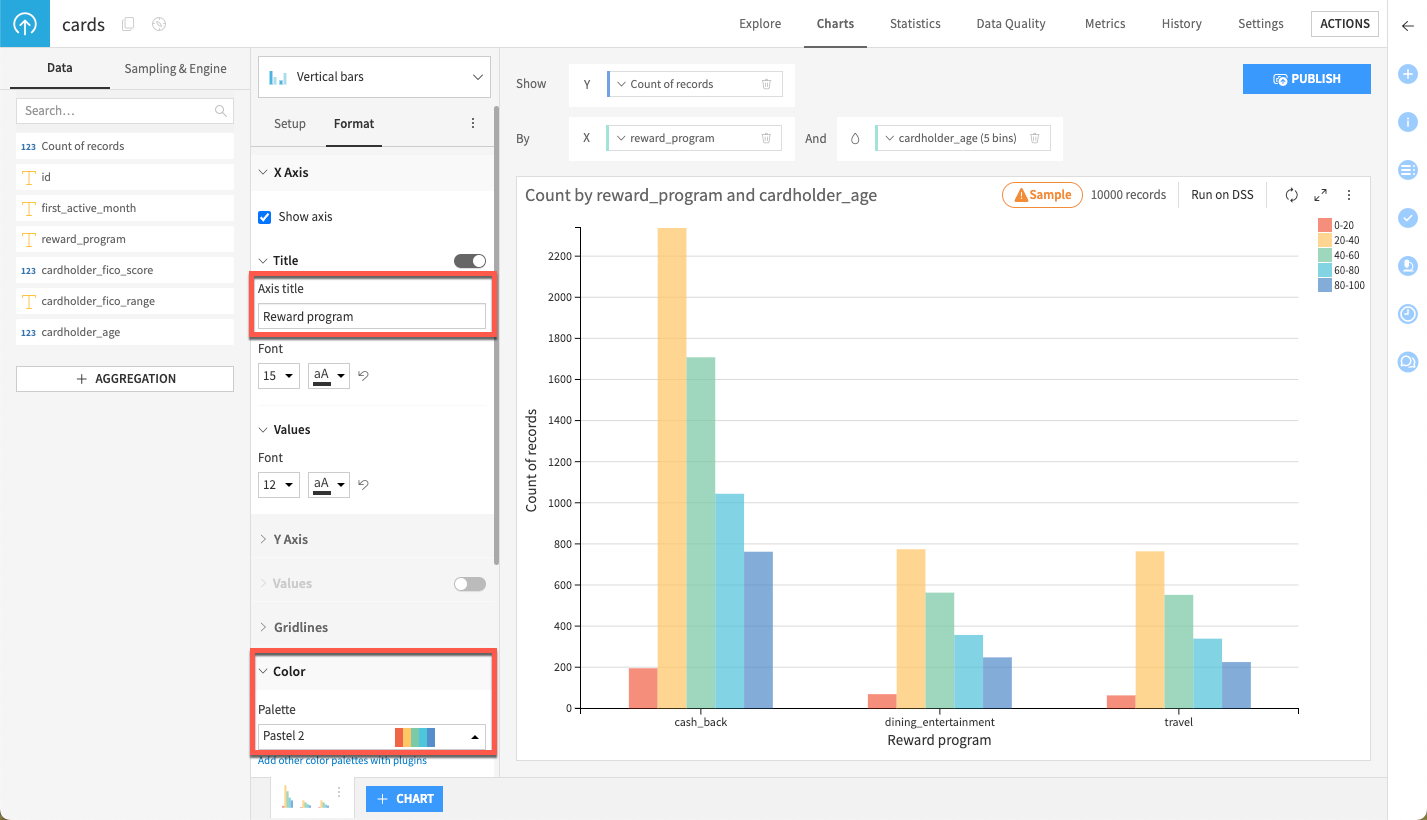
18to100in the Filters section of the Setup tab.In the left panel, go to the Format tab to customize the chart:
Under X Axis, open the Title dropdown, and enter
Reward programin the Axis title field.Under Color, select the built-in Pastel 2 palette.
Add a pie chart#
Let’s add a second chart.
At the bottom of the screen, click + Chart.
In the chart type dropdown, select Pie.
From the panel on the left, drag:
Count of records to the Show field.
reward_program to the By field.
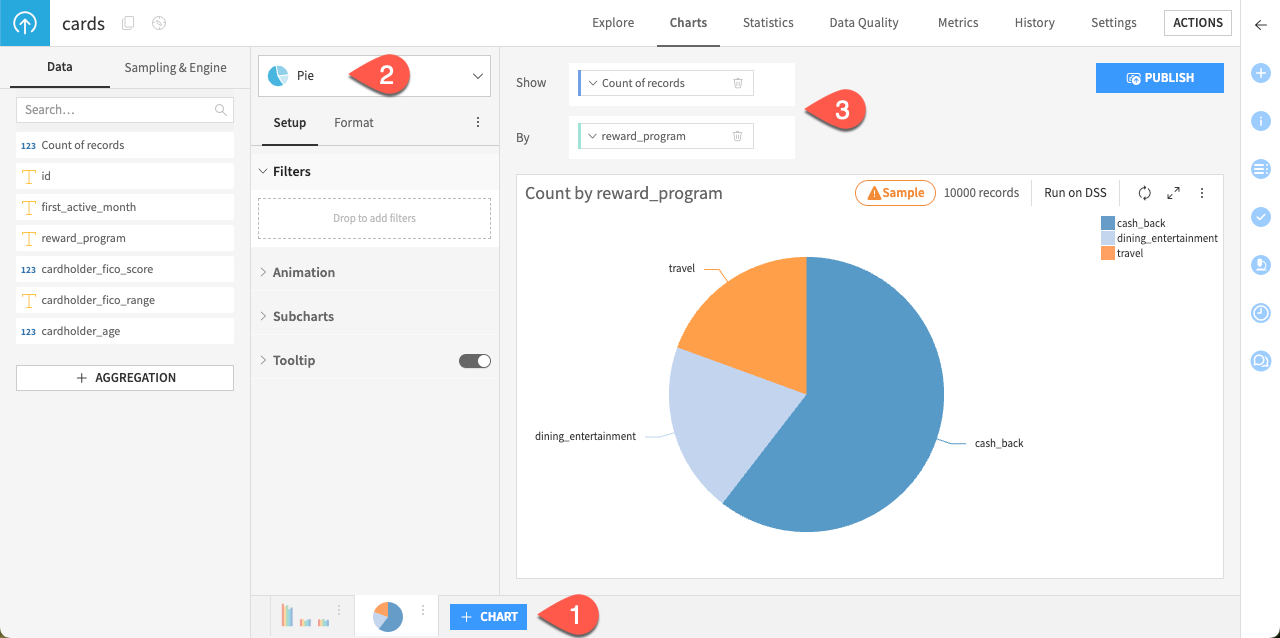
The chart confirms that the cash_back reward program is the most popular.
See also
For more information on additional chart options, see Tutorial | Charts, or learn how to summarize your data in Tutorial | Pivot tables.
Next steps#
Congratulations! You’ve created your first project, imported your first dataset, and built your first charts.
We recommend you to check the Tutorial | Join recipe, where we join the three datasets from this project to enrich each unique transaction with data about the information on credit card holders and merchants for that transaction.

