
Get started#
When deploying a model to production, monitoring is an important topic to tackle upfront. The first step is to actually define what you want to monitor, why, and with which consequences.
You’d do this using the usual methods: metrics, data quality rules, checks, scenarios.
Once you have a good understanding of your requirements, the next step is the implementation. At this stage, follow Dataiku’s resources on MLOps, such as the MLOps learning path, for a good understanding of the features at play.
However, the ML landscape within your organization might be heterogeneous. You might have models running in various contexts: some fully inside Dataiku’s ecosystem and others outside — through model exports or external deployments.
Nevertheless, even in contexts where model scoring happens outside Dataiku, model monitoring can still occur inside Dataiku.
Objectives#
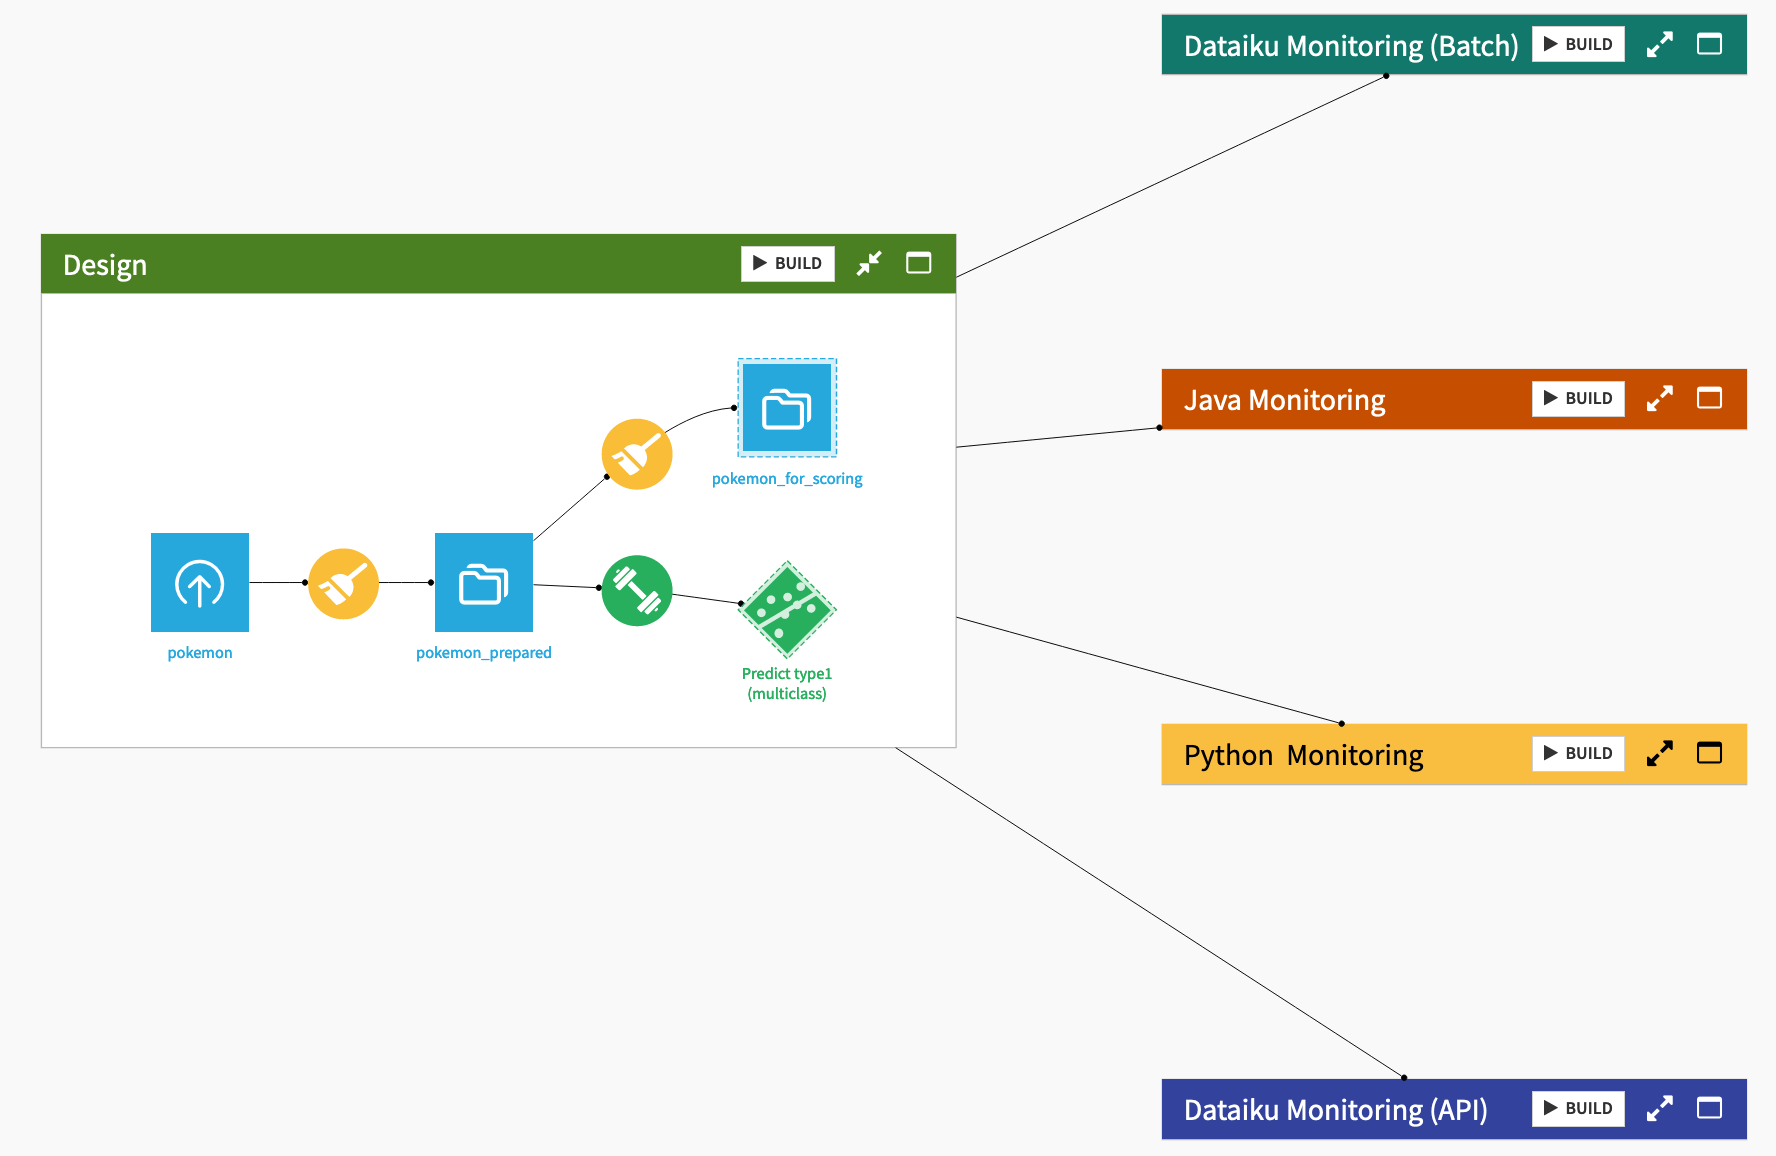
This tutorial explains how to design a model monitoring feedback loop in several different contexts.
The first two cases demonstrate model scoring and monitoring entirely within Dataiku:
A deployed model scored with a batch Flow
A deployed model scored as an API endpoint
The last two demonstrate model monitoring within Dataiku in situations where model scoring occurs outside Dataiku:
A model exported in Java
A model exported in Python
Prerequisites#
To focus on the choices of model monitoring in different contexts, this tutorial simplifies the configuration for these cases to the greatest degree possible.
For any of the above cases, you’ll need:
Dataiku 12.0 or later.
A Full Designer user profile on the Dataiku for AI/ML or Enterprise AI packages.
Broad knowledge of Dataiku (Core Designer + ML Practitioner level or equivalent).
Each of the cases listed above may have additional specific requirements found at the beginning of each section.
Create the project#
From the Dataiku Design homepage, click + New Project.
Select Learning projects.
Search for and select Model Monitoring Contexts.
If needed, change the folder into which the project will be installed, and click Create.
From the project homepage, click Go to Flow (or type
g+f).
Note
You can also download the starter project from this website and import it as a ZIP file.
Use case summary#
The starter project is based on the Kaggle Pokemon dataset. First review the Design Flow zone.
Every row in the pokemon dataset is a different Pokemon, with columns representing dozens of characteristics and abilities.
Every Pokemon belongs to one of eighteen different types (represented as type1 in the dataset), such as water, normal, grass, etc.
After some basic data cleaning in the Prepare recipe, the starter project includes a standard multi-class prediction model to predict the type of Pokemon using Dataiku’s AutoML tool, and then deployed it to the Flow.
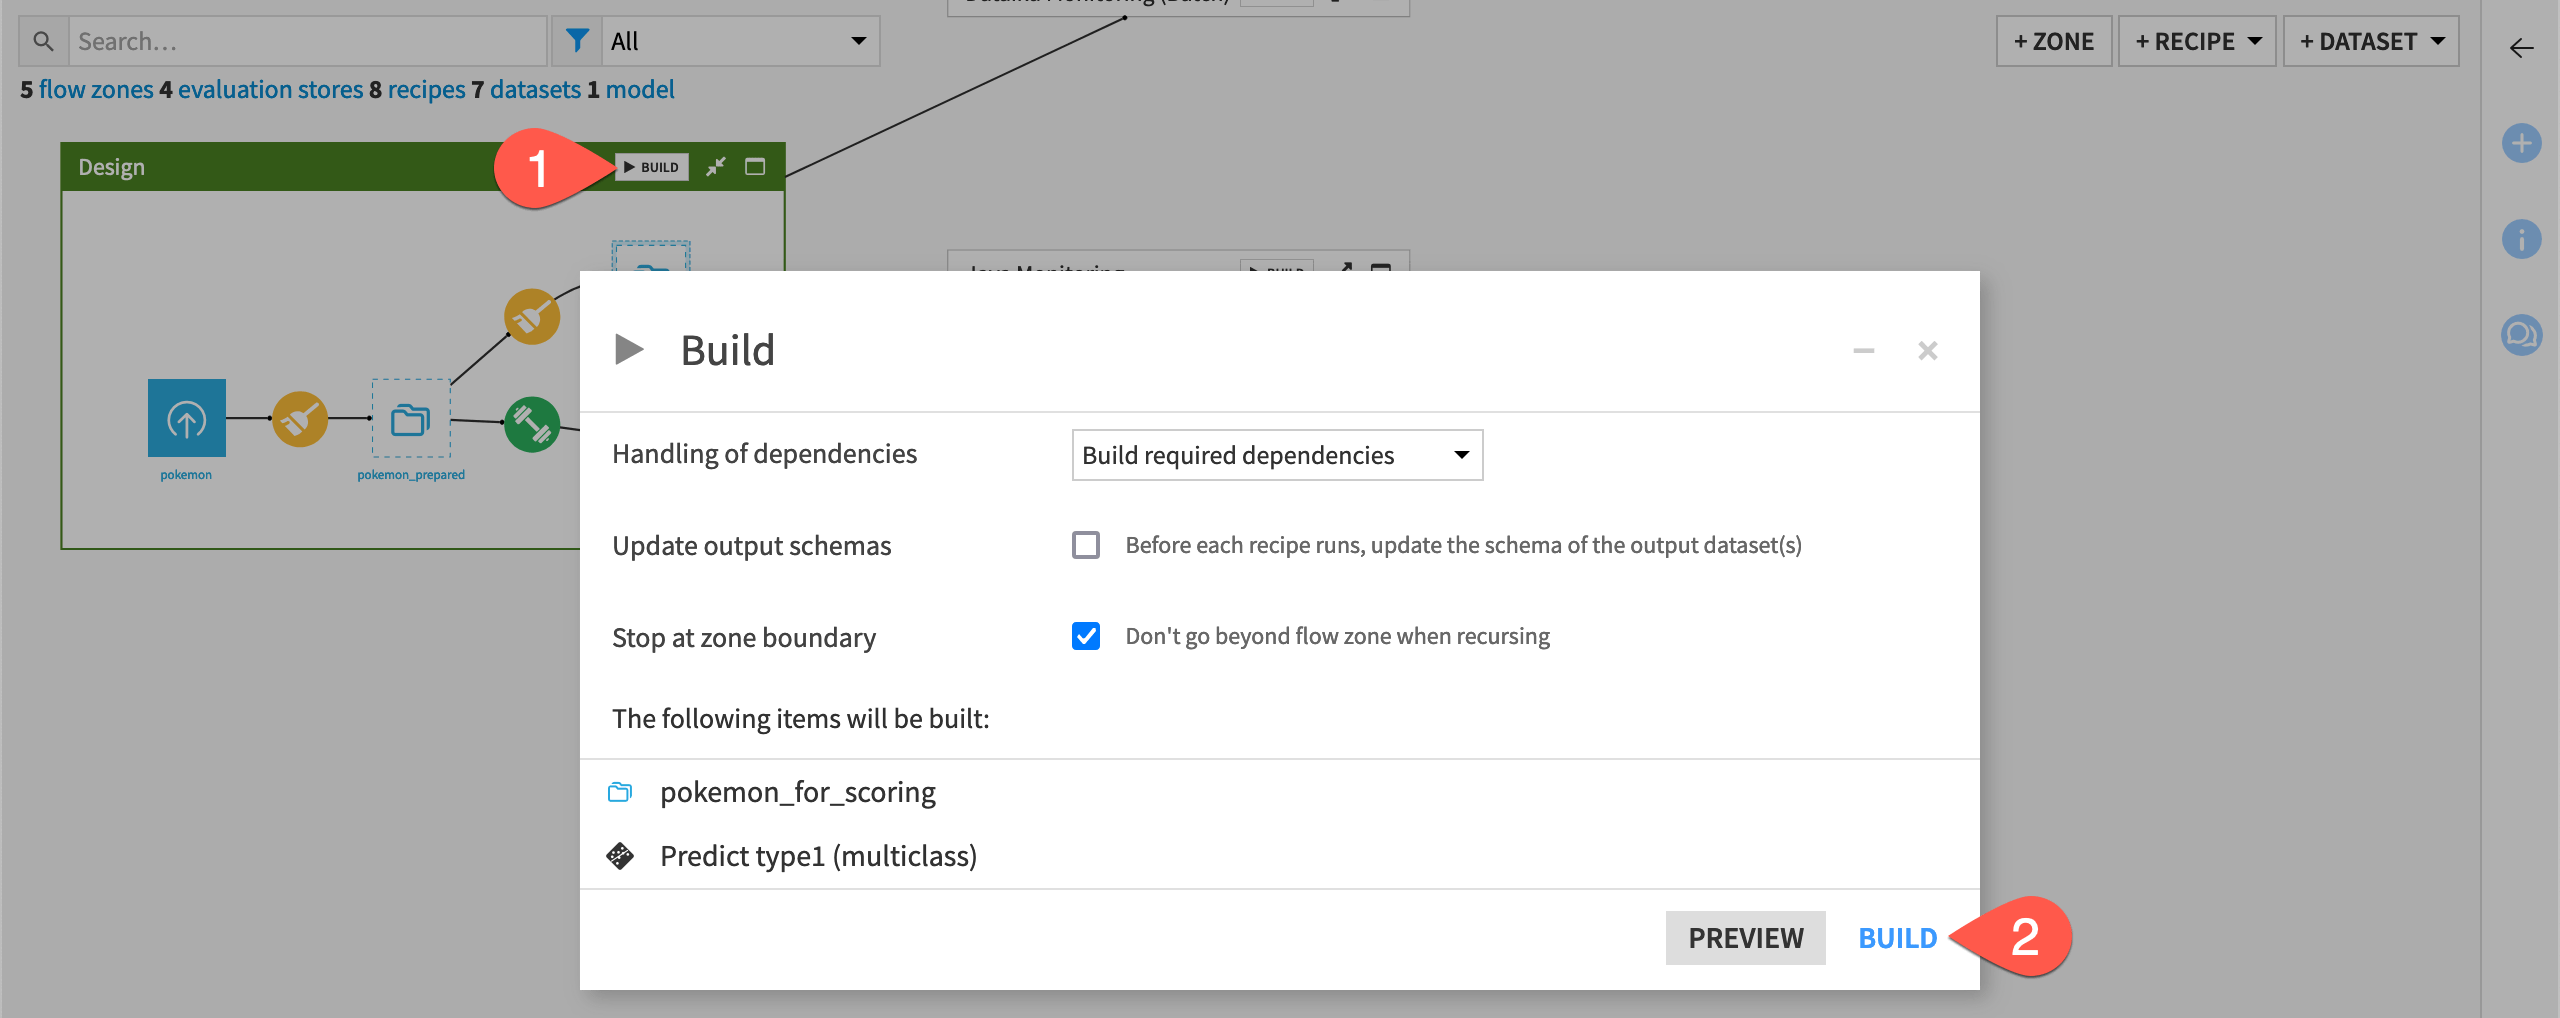
Once you understand the basic use case at hand, build the Flow before moving ahead to the monitoring instructions.
From the corner of the Design Flow zone, click Build.
Click Build once more to build the pipeline ending with the prediction model.
Ground truth vs. input drift monitoring#
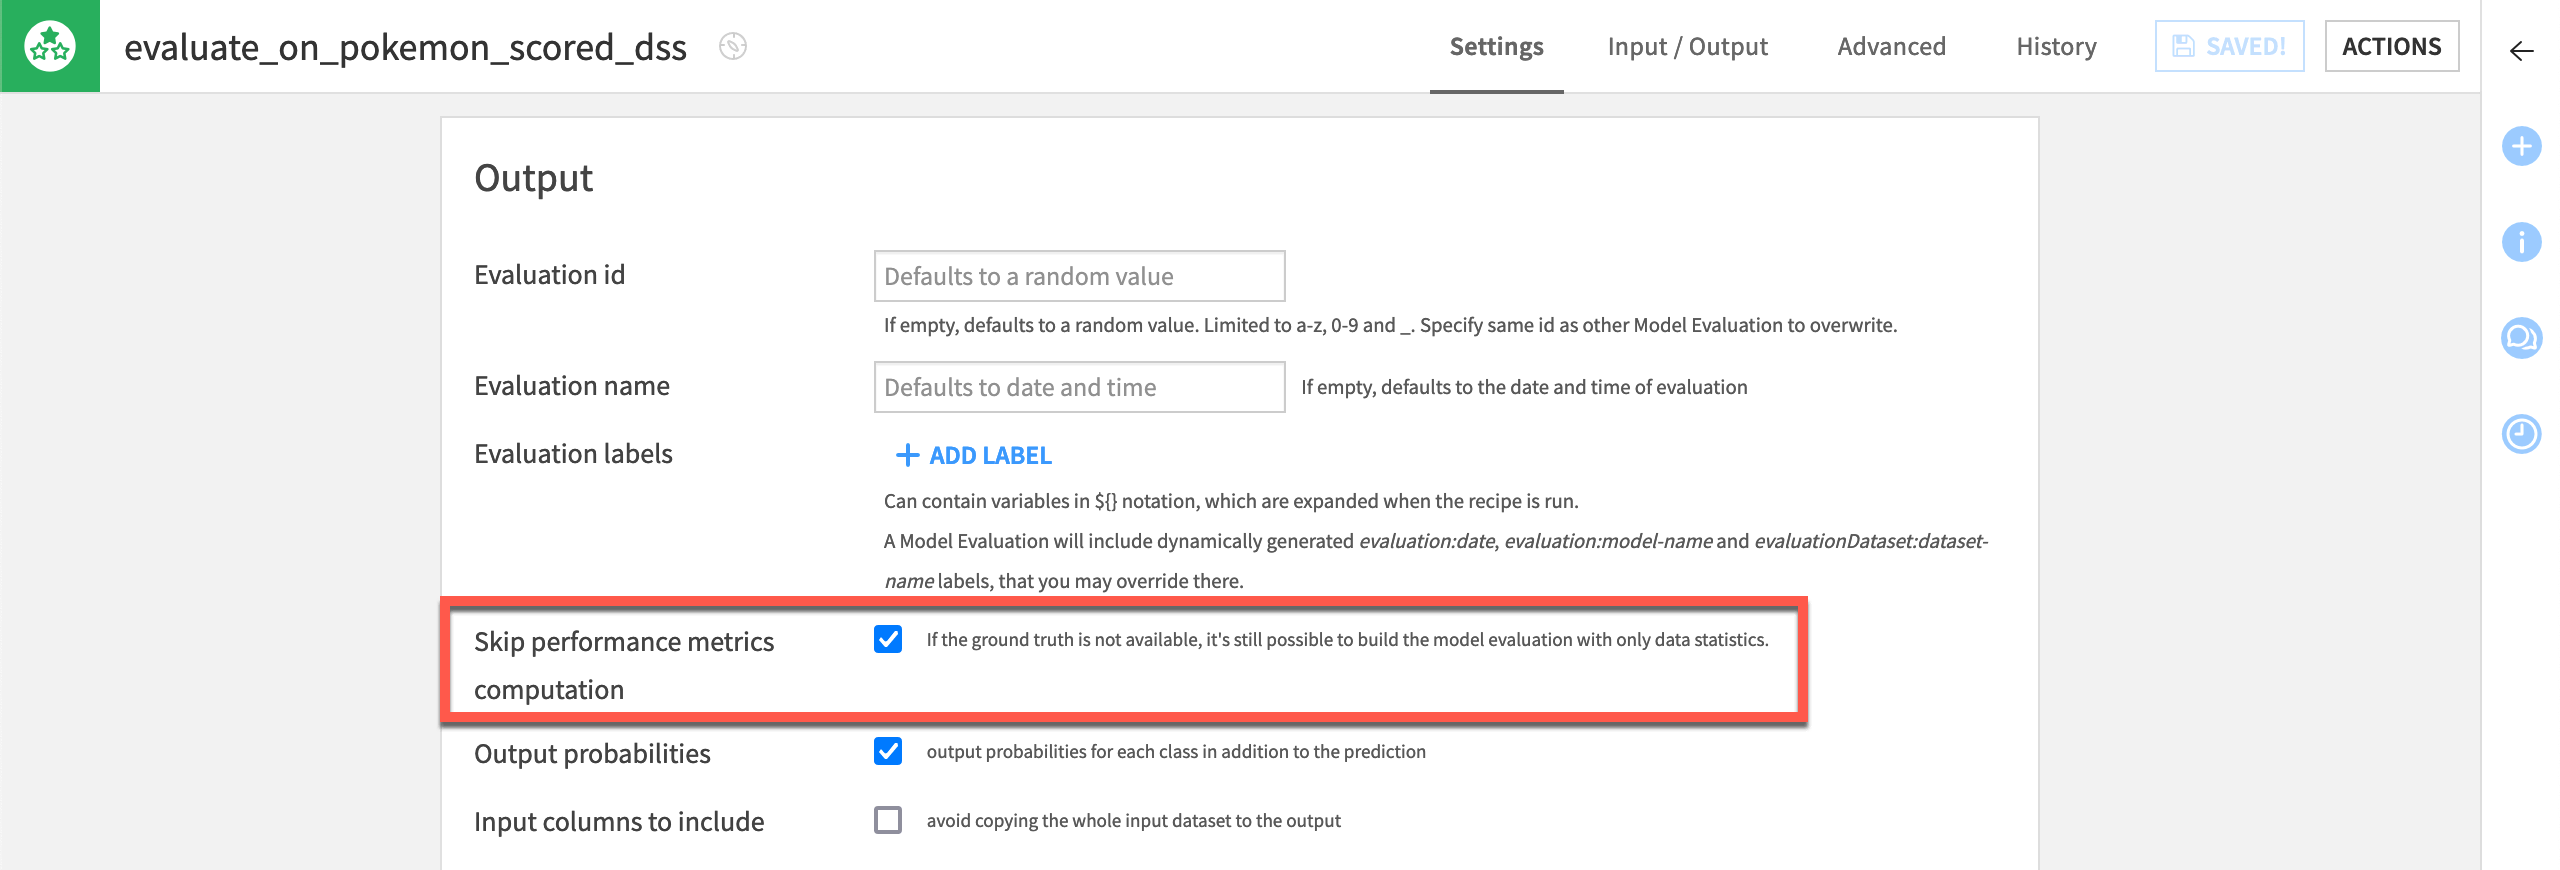
To simplify matters, in all monitoring contexts presented, the tutorial demonstrates input drift monitoring as opposed to ground truth monitoring.
If you examine the pokemon_for_scoring dataset, you’ll see that the Prepare recipe removes the target variable type1. The tutorial assumes the true answer of the model’s predictions is unknown. This is the hypothesis. Accordingly, all Evaluate recipes skip the computation of performance metrics.
Due to the differences between these two different types of monitoring, your Flow might build multiple model evaluation stores for a single model. For example:
One Flow zone builds a model evaluation store with only prediction logs that monitors only input data and prediction drift. This scenario might run every day.
In parallel, another Flow zone builds a model evaluation store with “ground truth-enriched” prediction logs that also monitors performance drift. Depending on the complications of reconciling ground truth, this data may have fewer rows or be older. This scenario might run every month.
See also
To gain experience computing both kinds of monitoring, see Tutorial | Model monitoring with a model evaluation store.
Model vs. data monitoring#
Although the focus here is model monitoring, you should recognize that model monitoring is only one leg of a robustly managed production project. You should also apply the same tools of metrics, data quality rules, checks, and scenarios to objects like datasets and managed folders. These are the upstream inputs to saved models and the Evaluate recipe.
See also
Learn more about Automation Scenarios in the Knowledge Base.
Deployment contexts#
Now that you have set up your project, move on to any of the following model monitoring examples based on your interests. You can complete them in any order independently of each other.