
Solution | Maintenance Performance and Planning#
Overview#
Business case#
Equipment reliability is crucial for manufacturers-—-ensuring responsible, safe, and consistent manufacturing processes. Maintenance is key to mitigating unplanned downtime and ensuring safe, continuous operation. However, finding the right time for maintenance is a challenge, as it requires balancing operational and cost objectives.
In many industries, maintenance is either reactive or driven by excessive time-based preventative routines. Both options are costly, erode asset performance, and decrease operational efficiency, costing manufacturers billions each year.
Time-based preventative maintenance and reactive firefighting represent two default strategies that no longer need to be the norm. Using AI and ML, manufacturers can refine their maintenance tactics by leveraging service history and equipment attributes. Techniques like survival analysis transform static, time-based maintenance schedules into tailored plans that reflect the true risk of mechanical failure for each asset.
With Dataiku’s Maintenance Performance and Planning Solution, organizations can leverage vast volumes of maintenance history and internal documents to draw insights on how to improve their maintenance performance. Thanks to common performance metrics like MTBF (Mean Time Between Failures), MTTR (Mean Time to Repair), and task paretos, reliability engineers can explore fleet behaviors using descriptive analytics. ML algorithms provide Remaining Useful Life (RUL) predictions based on maintenance history and recommend maintenance schedules per asset, allowing service managers to adjust strategies accordingly.
Dataiku’s LLM Mesh enables all business users to interpret model results and generate automatic reports. Whether for internal equipment maintenance or improving customer service, Dataiku’s Maintenance Performance and Planning Solution enables organizations to revisit their manufacturing strategies promptly and effectively.
Installation#
From the Design homepage of a Dataiku instance connected to the internet, click + Dataiku Solutions.
Search for and select Maintenance Performance and Planning.
If needed, change the folder into which the Solution will be installed, and click Install.
Follow the modal to either install the technical prerequisites below or request an admin to do it for you.
Note
Alternatively, download the Solution’s .zip project file, and import it to your Dataiku instance as a new project.
Technical requirements#
To use this Solution, you must meet the following requirements:
Have access to a Dataiku 14+* instance.
Dataiku’s Survival Analysis plugin.
Dataiku’s Text extraction and OCR Plugin.
A Python 3.9 code environment named
solution_maintenance-performance-planningand the following required packages:
chromadb==0.5.5
Flask==3.0.3
Jinja2==3.1.4
langchain==0.3.27
langchain-community==0.3.27
lifelines==0.28.0
markdown2==2.5.0
plotly_calplot==0.1.20
pysqlite3-binary==0.5.4
scikit-learn>=1.0,<1.1
LLM Mesh connection: This Solution uses Dataiku’s LLM Mesh to interact with local or remote models. You need to configure one connection to run the project.
Data requirements#
The Solution takes as input two datasets.
Dataset |
Description |
|---|---|
maintenance_operations |
Contains logs of all the maintenance operations in the following format:
|
equipment_information |
Encompasses pertinent static details of each piece of equipment. There should be one row per equipment, and date columns should be pre-parsed to achieve the following data model:
|
Optionally, you can drag documents (text files, PDFs, or images containing text) into the context_documents folder. The various LLMs will use these documents to help explain your statistical results.
Workflow overview#
You can follow along with the Solution in the Dataiku gallery.
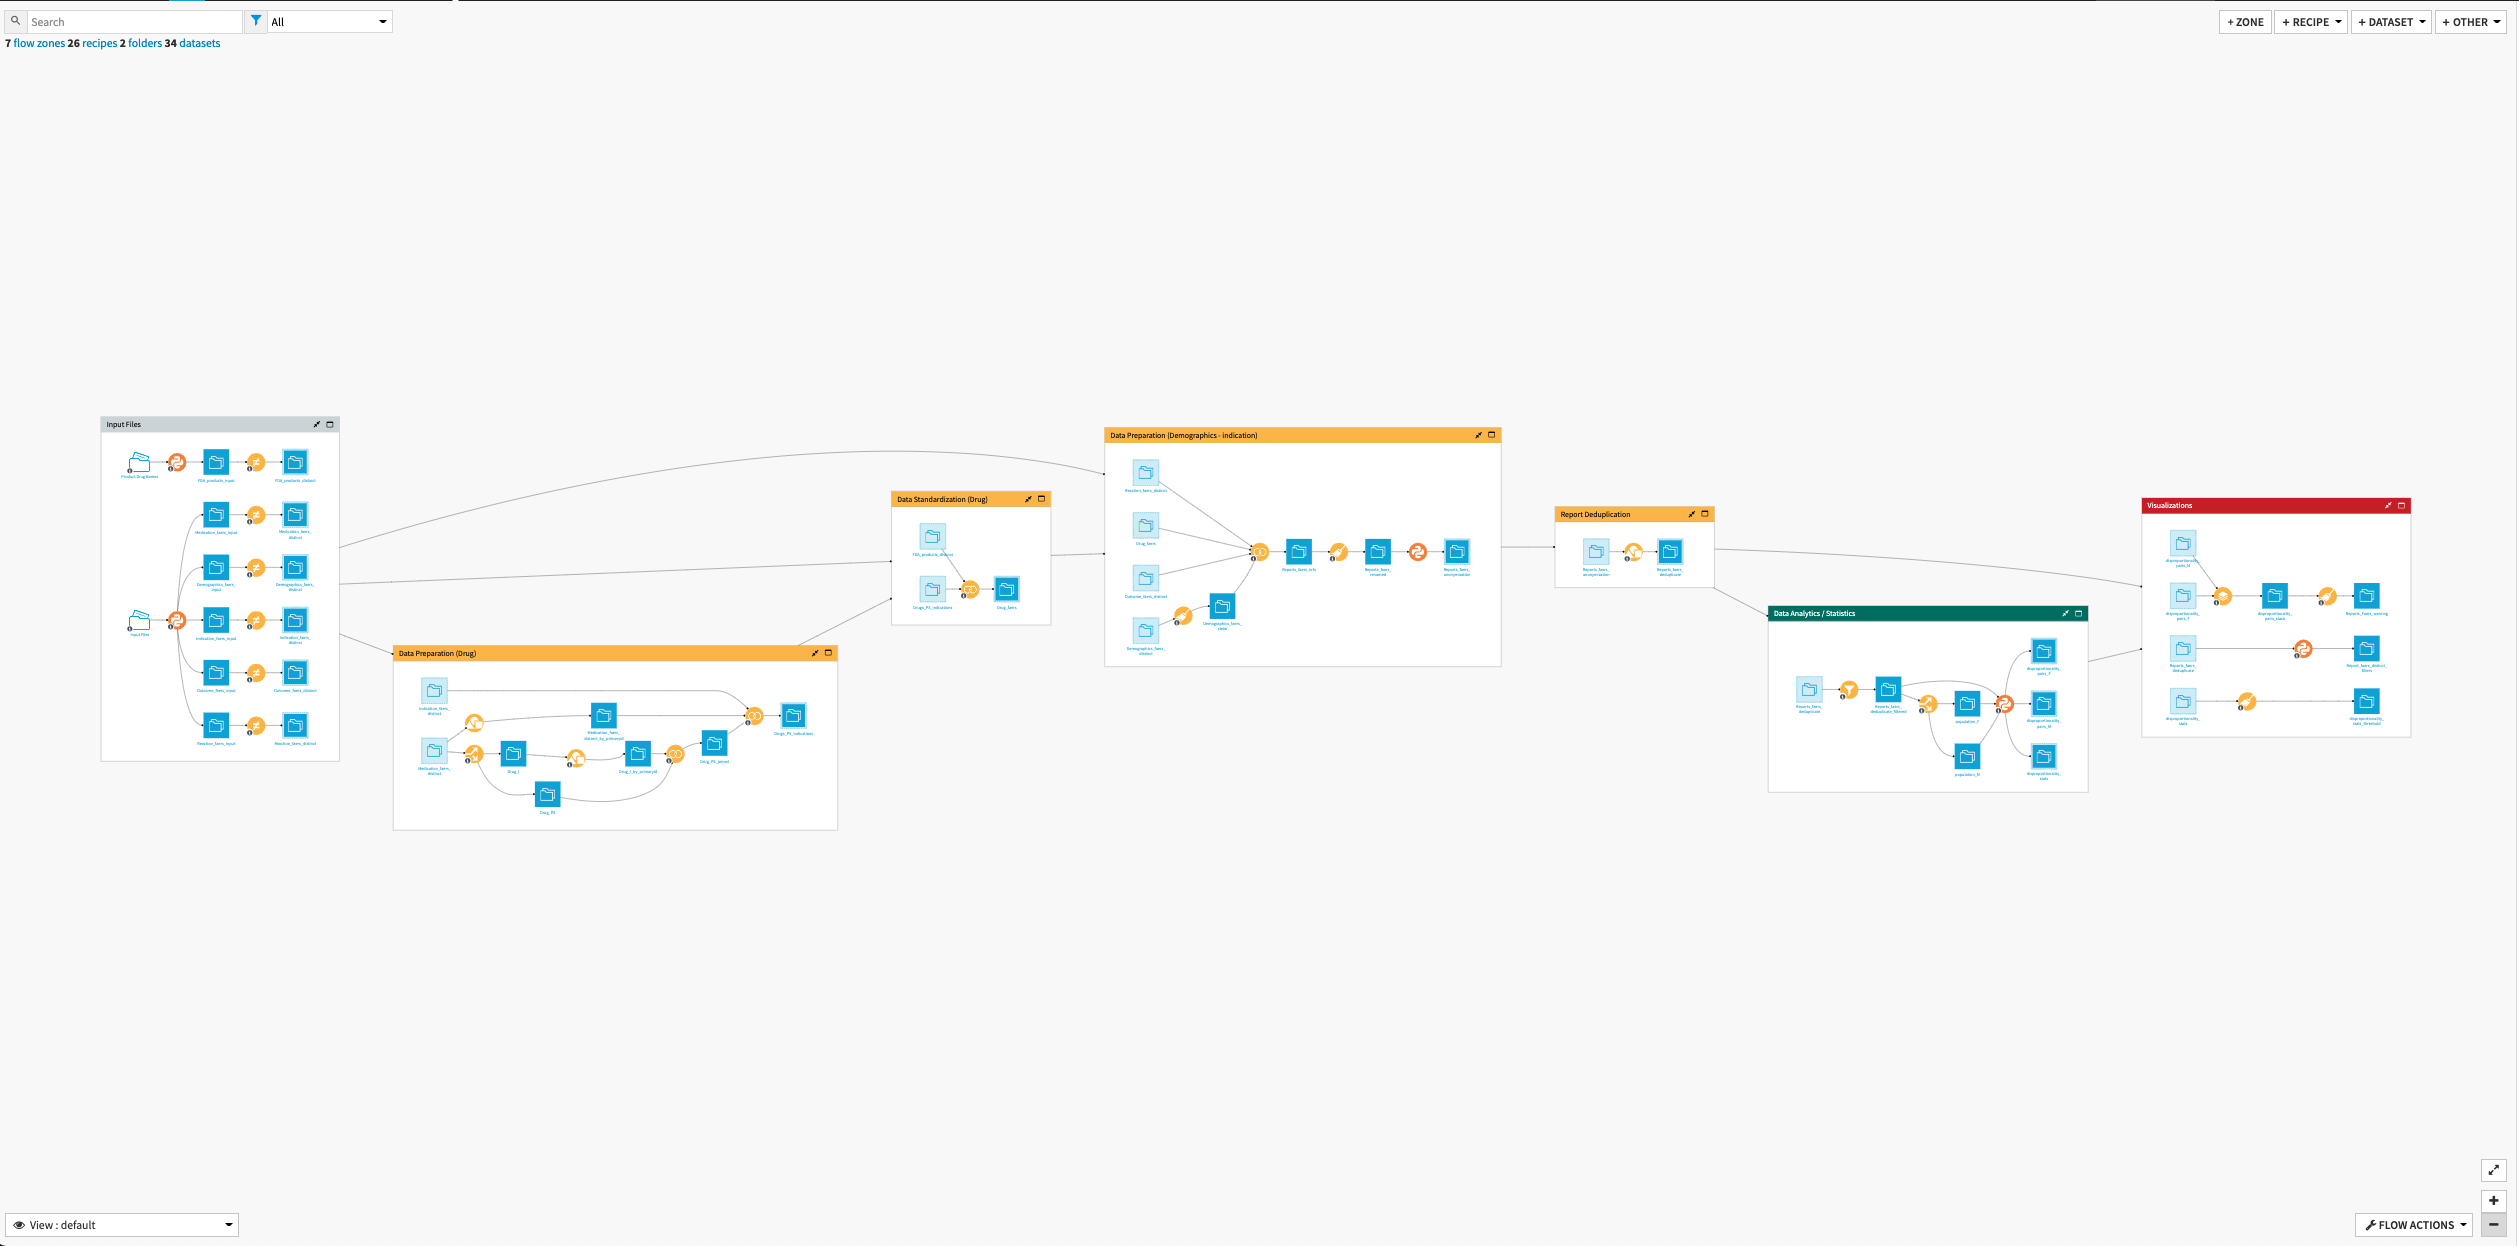
The project has the following high-level steps:
Select your analysis parameters using Project Setup.
Prepare the data for survival analysis and compute statistical indicators.
Train the survival model.
Analyze the results using Dataiku’s LLM Mesh and display the result in a dashboard.
Walkthrough#
Note
In addition to reading this document, it’s recommended to read the wiki of the project before beginning to get a deeper technical understanding of how this Solution was created and more detailed explanations of Solution-specific vocabulary.
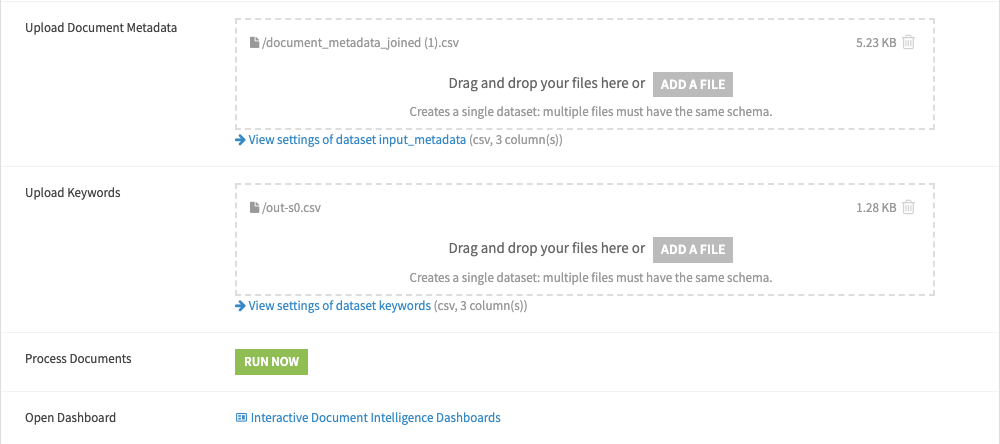
Define your maintenance goals via the Project Setup#
To begin, you must configure the Solution in the project landing page by using Project Setup. You will land on the configuration page, where you can indicate your analysis parameters.
Here you can configure important parameters to guide your maintenance strategy. First, the End Date of the Analysis allows you to specify the latest date for available data. This ensures that the system analyzes data up to the point you’ve selected.
Next, the Target Planned Maintenance Ratio sets the percentage of maintenance that should be planned, helping you optimize the balance between preventive and corrective maintenance. This value acts as a KPI against which you can compare your actual maintenance performance over time.
Finally, the Maximum Planned Interval defines the longest period within which maintenance can be scheduled. The planning will automatically adjust to respect this maximum interval.
Having set these parameters, click Build to generate a tailored analysis. The dashboard will provide insights based on the data and constraints you defined.
Censor events and up time: Getting data ready for survival analysis#
In the context of survival analysis, censored values represent instances where the precise time to event (in this case, maintenance or failure of equipment) isn’t known. This could occur when a machine is still functional at the end of the observation period or when a machine is taken offline for planned maintenance. Because the machine didn’t fail, these instances are treated as censored data, indicating that the actual time to failure is potentially longer than what’s observed.
To handle these censored values effectively, survival analysis needs to analyze periods instead of events: the different models compare the length of the periods and tries to find patterns in the data to account for differences.
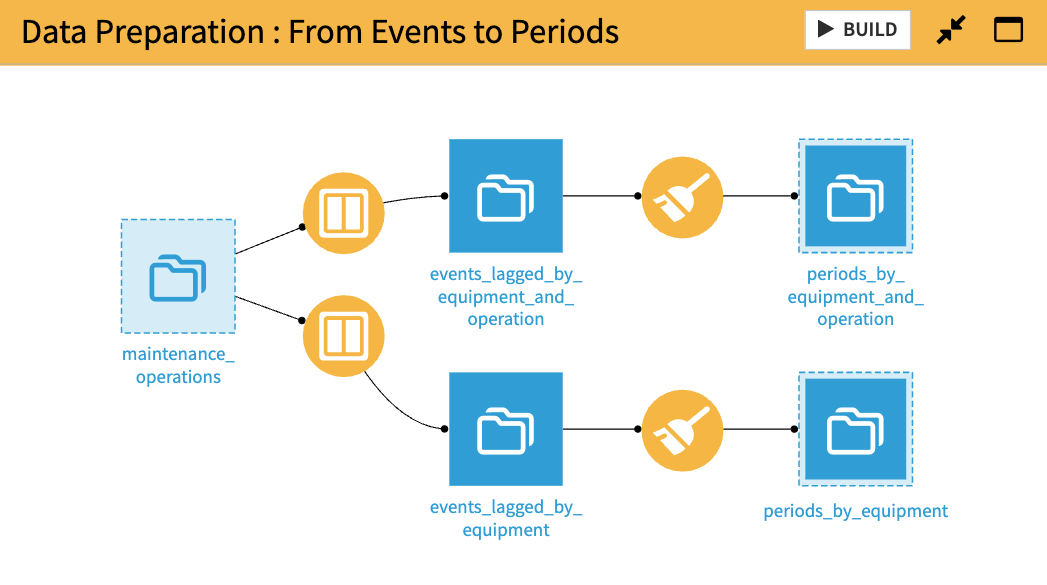
The analysis adopts two perspectives:
Analysis by equipment: This Flow zone focuses on the time to maintenance for each piece of equipment. It computes uptime and handles boundary events to generate a comprehensive survival probability curve for each machine.
Analysis by equipment & maintenance operation: This zone emphasizes the time to maintenance for each maintenance operation. It incorporates uptime and boundary events to assess the likelihood of each maintenance operation being required over time.
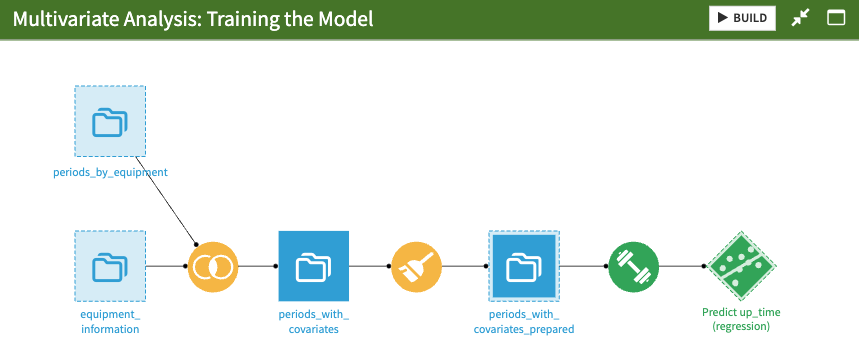
Anticipating machine failure: Training a survival analysis model#
Survival analysis, a statistical technique used to evaluate the time-to-event, is particularly pertinent in analyzing maintenance performance. It effectively deals with censored data, a common occurrence in maintenance scenarios — such as when a machine hasn’t yet failed or is taken offline for planned maintenance. This method enhances the overall predictive power of the model by treating these instances as censored data.
Moreover, survival analysis generates a survival probability curve that offers a detailed understanding of equipment longevity. Rather than merely predicting a single failure point, this curve allows for risk assessment over a duration, enabling more effective planning for maintenance schedules, resource allocation, and managing spare parts inventory.
The training of the survival analysis model involves several key steps:
The uptime dataset is joined with the equipment information dataset, integrating relevant equipment data for the analysis.
A ‘prepare’ phase calculates the number of days elapsed between each date and the machine’s restart time, effectively converting date values into duration metrics for modeling. Unneeded columns are also removed at this stage.
The visual ML is used on the periods_with_covariates_prepared dataset. It builds a Cox proportional hazards model, which is then deployed as a recipe in the Flow.
These steps ensure the model is adequately trained to leverage all maintenance logs and equipment data, thereby improving the overall reliability and precision of the Solution.
Design smarter and more effective maintenance strategies#
The pre-built Maintenance Operations Analysis and Predictions dashboard that’s packaged within this Solution has been designed to support reliability engineers in the effective maintenance management of their equipment fleet. The dashboard is divided into three pages.
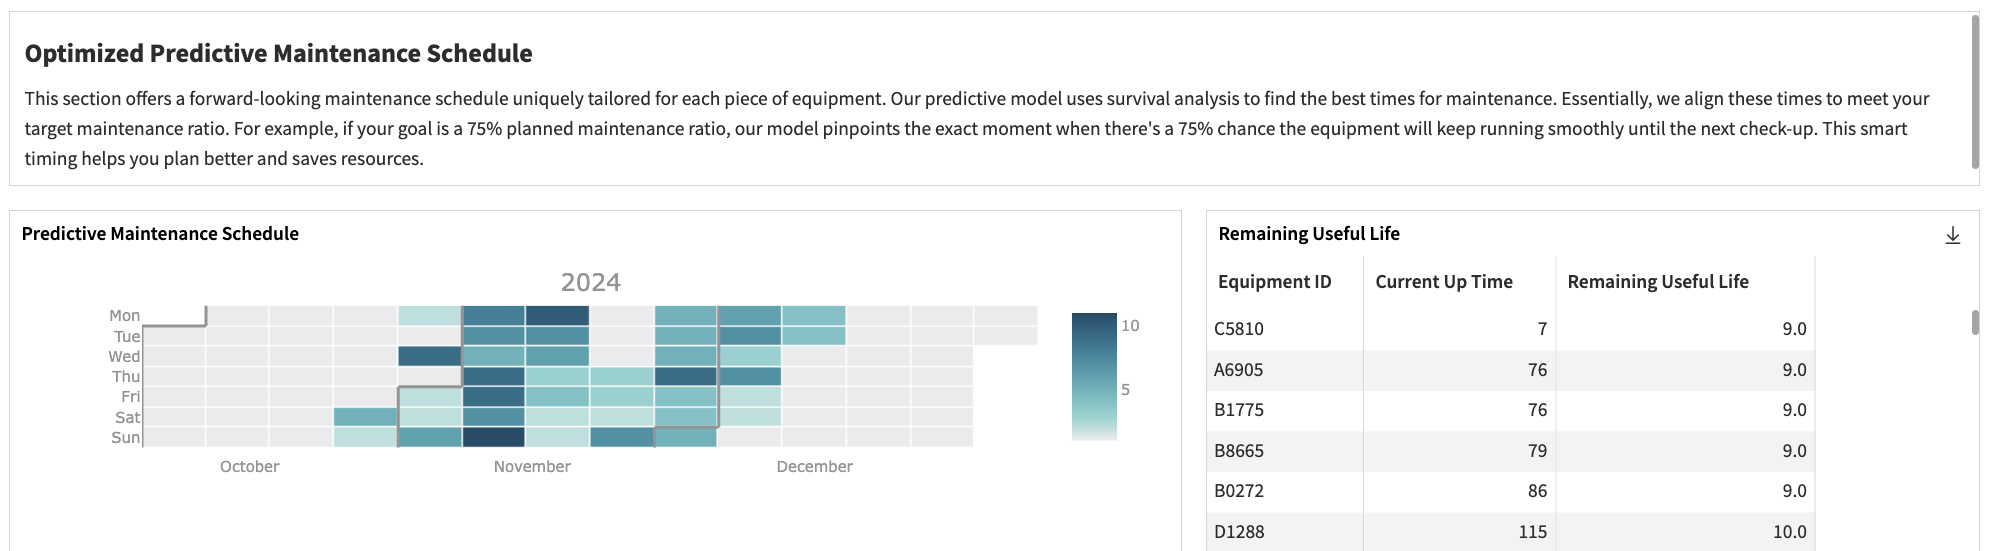
The General Overview dashboard serves as an initial summary and a strategic tool for managing and optimizing maintenance operations. It provides a high-level view of the key performance indicators (KPIs), enabling users to gauge equipment reliability, issue resolution efficiency, and overall equipment availability. By tracking maintenance trends and leveraging predictive models to forecast future maintenance schedules, it facilitates data-driven decision-making.
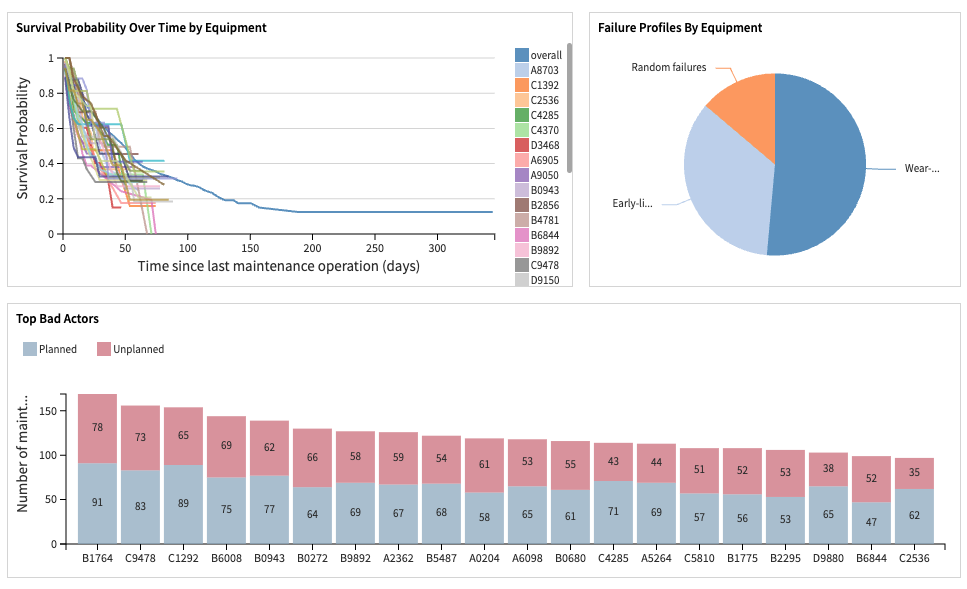
The Maintenance Operations Analysis page provides a comprehensive analysis of maintenance operations and equipment performance, helping users to uncover detailed insights and make informed decisions. It offers a platform to investigate individual equipment performance, identify failure-prone equipment, and understand the dynamics of various maintenance operations.
By helping users pinpoint patterns and anticipate potential problems, it enables the formulation of targeted maintenance strategies. This dashboard is particularly useful for those seeking to enhance operational efficiency, reduce unscheduled downtime, and improve overall equipment lifespan.
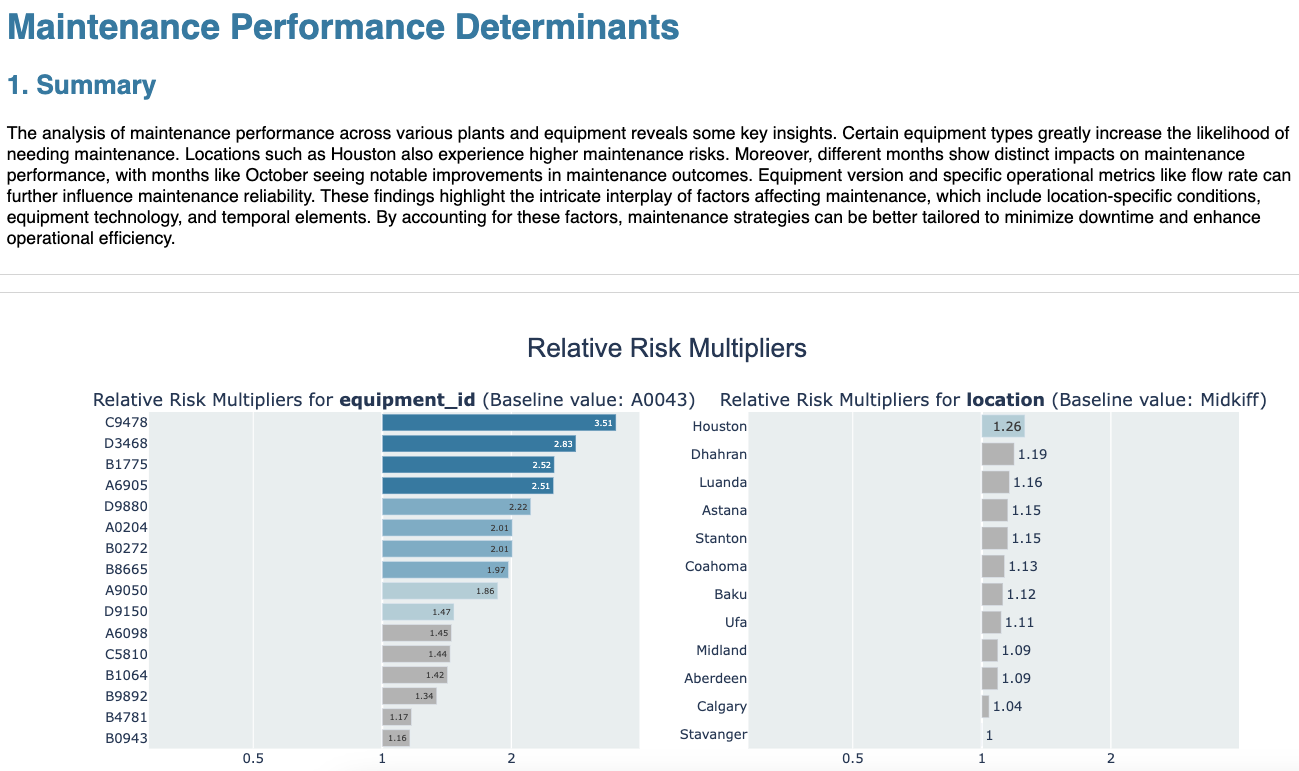
The Maintenance Performance Determinants dashboard provides an analytical tool for understanding the impact of specific factors, or covariates, on the likelihood of equipment failure. It uses a Cox Proportional Hazards model to compute risk multipliers, which indicate how much a covariate increases or decreases the risk of failure.
For categorical covariates, each category has its own risk multiplier compared to a baseline category. For numerical covariates, the risk multiplier quantifies how a one-unit increase or decrease in the covariate alters the hazard, assuming other factors remain constant.
The Solution uses a combination of LLM calls to:
Automatically interpret these risk multipliers
Identify possible root causes in your contextual documents.
Generate an automatic report that all stakeholders can benefit from.
This dashboard is essential for identifying and understanding the factors that significantly influence equipment failure. With the help of Dataiku’s LLM Mesh, decision-makers can leverage their data and documents to identify the key variables affecting equipment longevity, thereby enhancing maintenance strategies and extending equipment life.
Working with LLMs#
Working with LLMs is an opportunity, but requires specific attention. Please be mindful about cost, privacy, and regulatory concerns. You should use a small sample of data for testing to avoid unpredicted behavior and limit the cost of iteration. You might need to modify prompts might need to regarding your data or the model used. Lastly, we recommend a human-in-the-loop process before taking any actions based on results that rely on LLMs (directly or indirectly).
Reproducing these processes with minimal effort for your data#
Using this Solution can reduce unplanned downtime and optimize maintenance plans for your equipment. By creating a singular Solution that can benefit and influence the decisions of a variety of teams in a single organization, strategies can be implemented to mitigate unplanned downtime, ensure safe, continuous operations, and improve service to customers.
This documentation has provided several suggestions on how to derive value from this Solution. Ultimately however, the “best” approach will depend on your specific needs and data. If you’re interested in adapting this project to the specific goals and needs of your organization, Dataiku offers roll-out and customization services on demand.