
Tutorial | R Markdown reports#
Get started#
R Markdown is an R package to create fully reproducible, print-quality documents that incorporate narrative text and code to produce elegant output. You can create this kind of report directly within Dataiku, and then share them on dashboards or deliver them in a variety of static formats for offline reading.
Objectives#
In this tutorial, you will:
Create an R Markdown report in Dataiku.
Publish it as an insight to a dashboard.
Automate report updates using a scenario.
Prerequisites#
Dataiku 12.0 or later.
An Advanced Analytics Designer or Full Designer user profile.
The R integration installed.
The built-in R code environment includes the required packages, such as rmarkdown.
Create the project#
From the Dataiku Design homepage, click + New Project.
Select Learning projects.
Search for and select R Markdown.
If needed, change the folder into which the project will be installed, and click Create.
From the project homepage, click Go to Flow (or type
g+f).
From the Dataiku Design homepage, click + New Project.
Select DSS tutorials.
Filter by Developer.
Select R Markdown.
From the project homepage, click Go to Flow (or type
g+f).
Note
You can also download the starter project from this website and import it as a zip file.
Create an R Markdown report#
From the project, create a new R Markdown report:
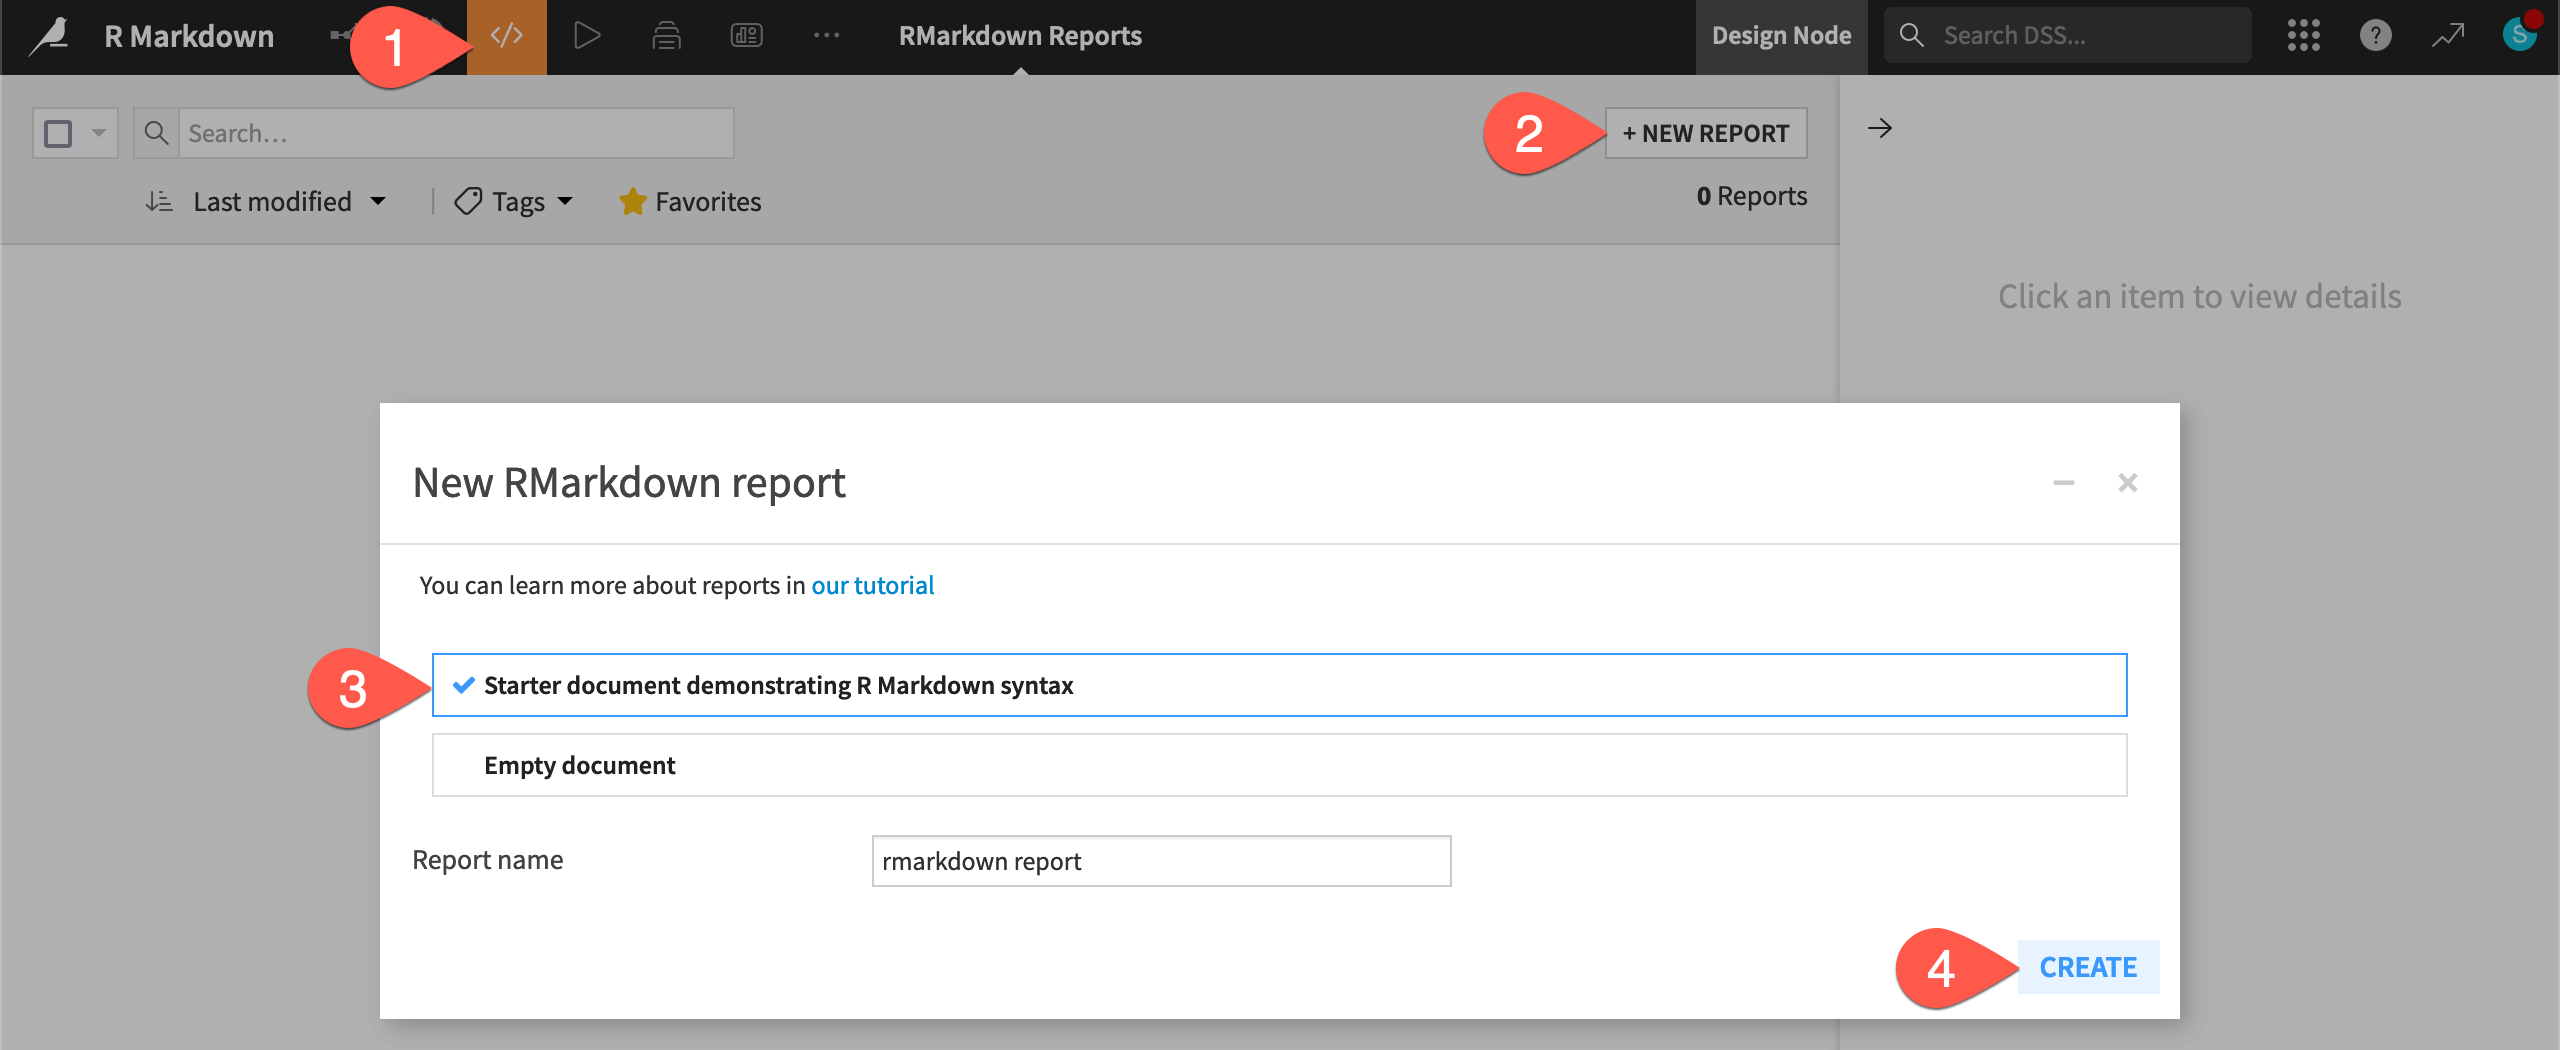
In the Code (
 ) menu of the top navigation bar, select R Markdown Reports.
Click + New Report.
Leave the default for a Starter document demonstrating R Markdown syntax.
Click Create.
Edit an R Markdown report#
Similar to the editor for a webapp, the R Markdown editor is divided into two panes.
The left pane allows you to edit the code underlying the report.
The right pane gives you several views on the report.
The right pane has three tabs:
Tab |
Purpose |
|---|---|
Preview |
Receive immediate visual feedback on what’s present in the left pane. |
Log |
Useful for troubleshooting problems. |
Settings |
Set the report’s output format and code environment. |
Add document metadata#
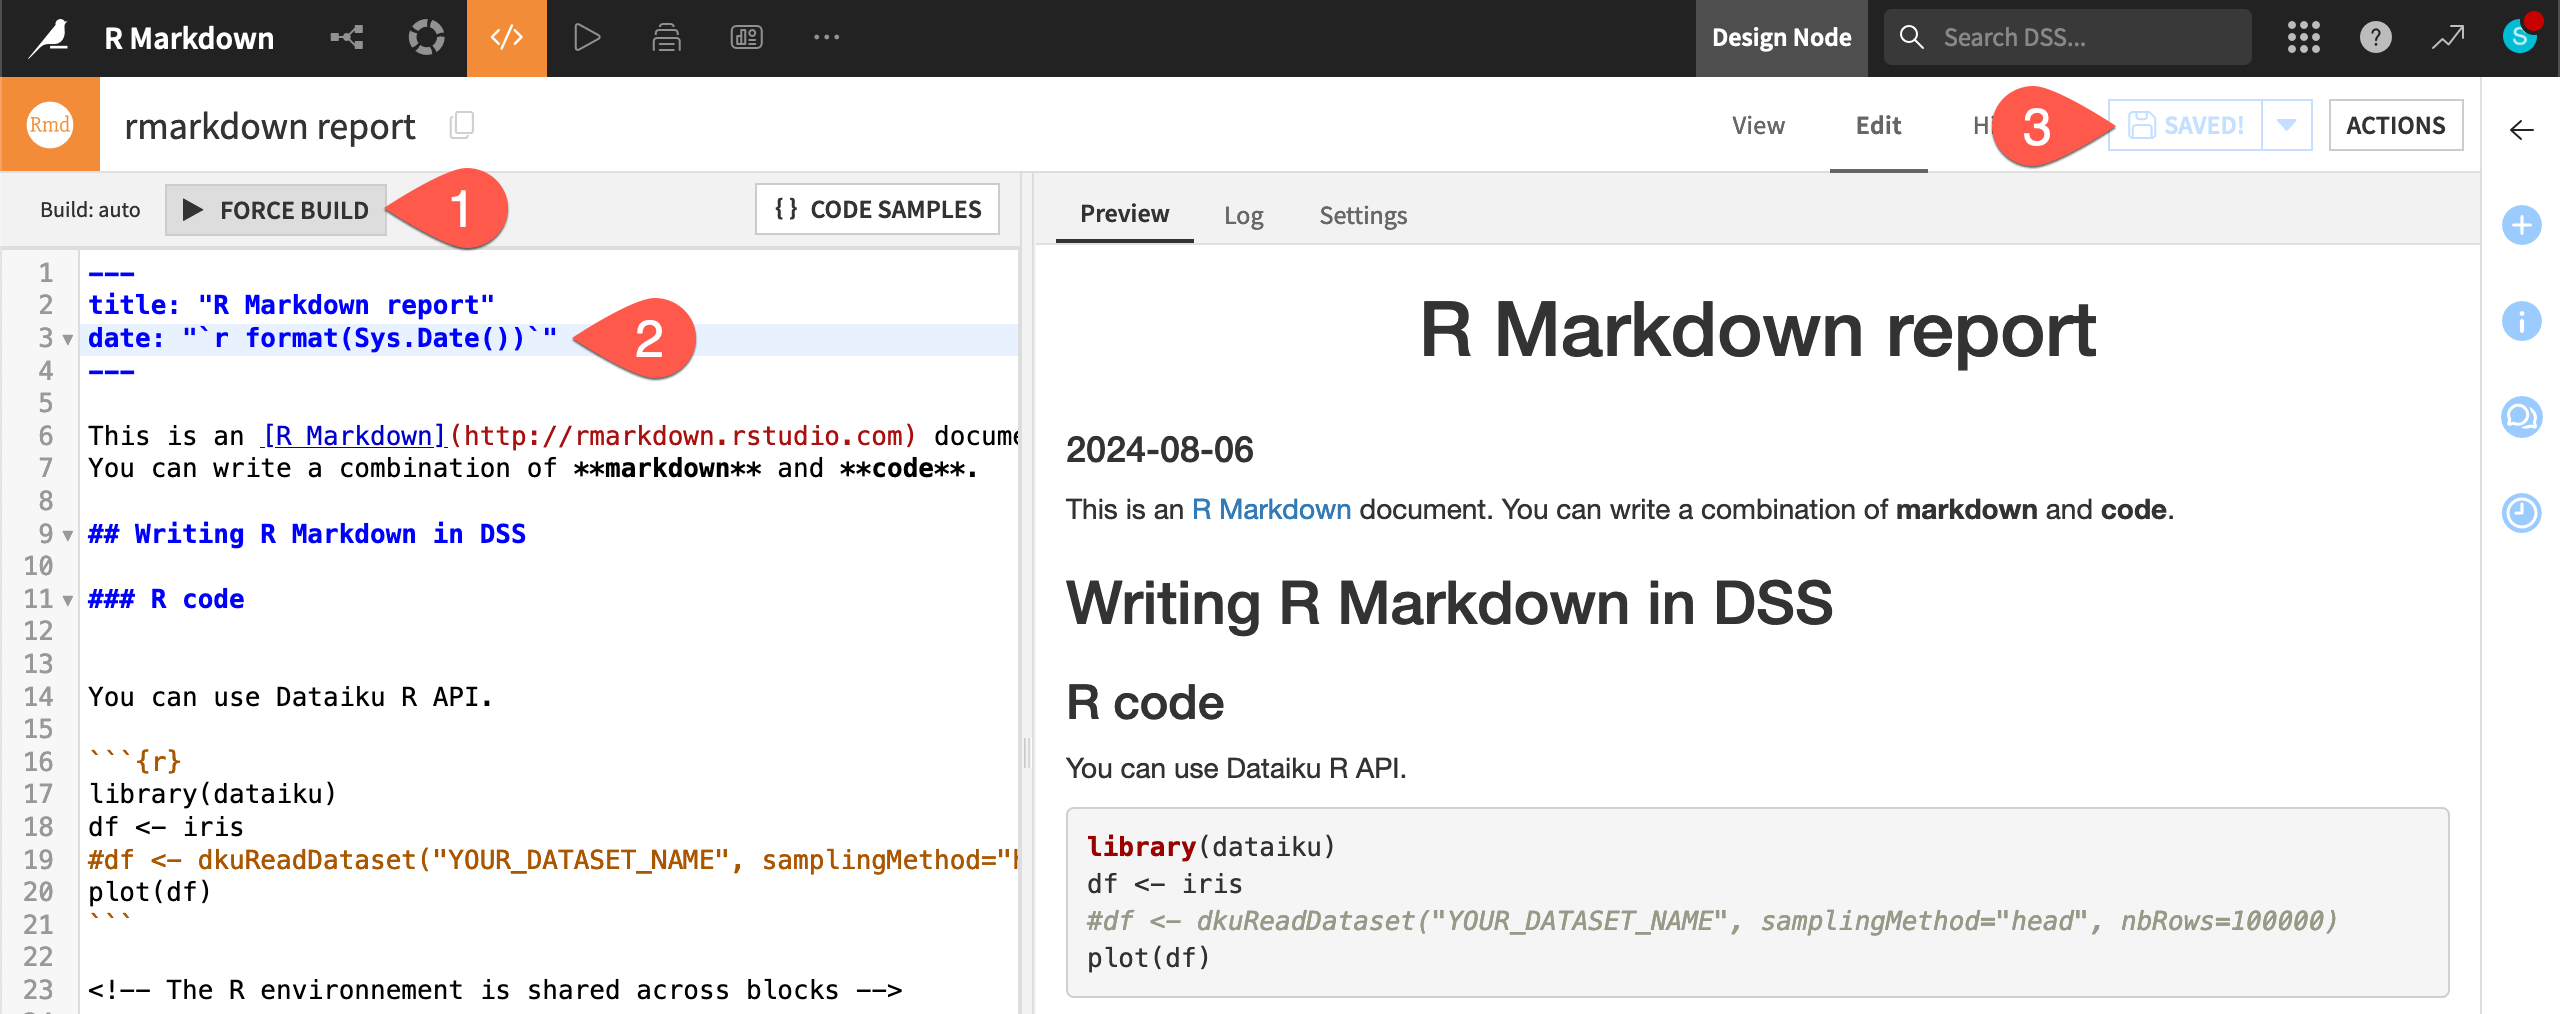
In an R Markdown report, the YAML header (demarcated by three dashes ---) defines the document metadata.
In the R Markdown report editor, click Force Build to create the initial preview.
In the left pane, add a
dateargument to the YAML header.--- title: "R Markdown report" date: "`r format(Sys.Date())`" ---
Click Save (
Cmd/Ctrl+S) to see the reloaded preview.
Add R code#
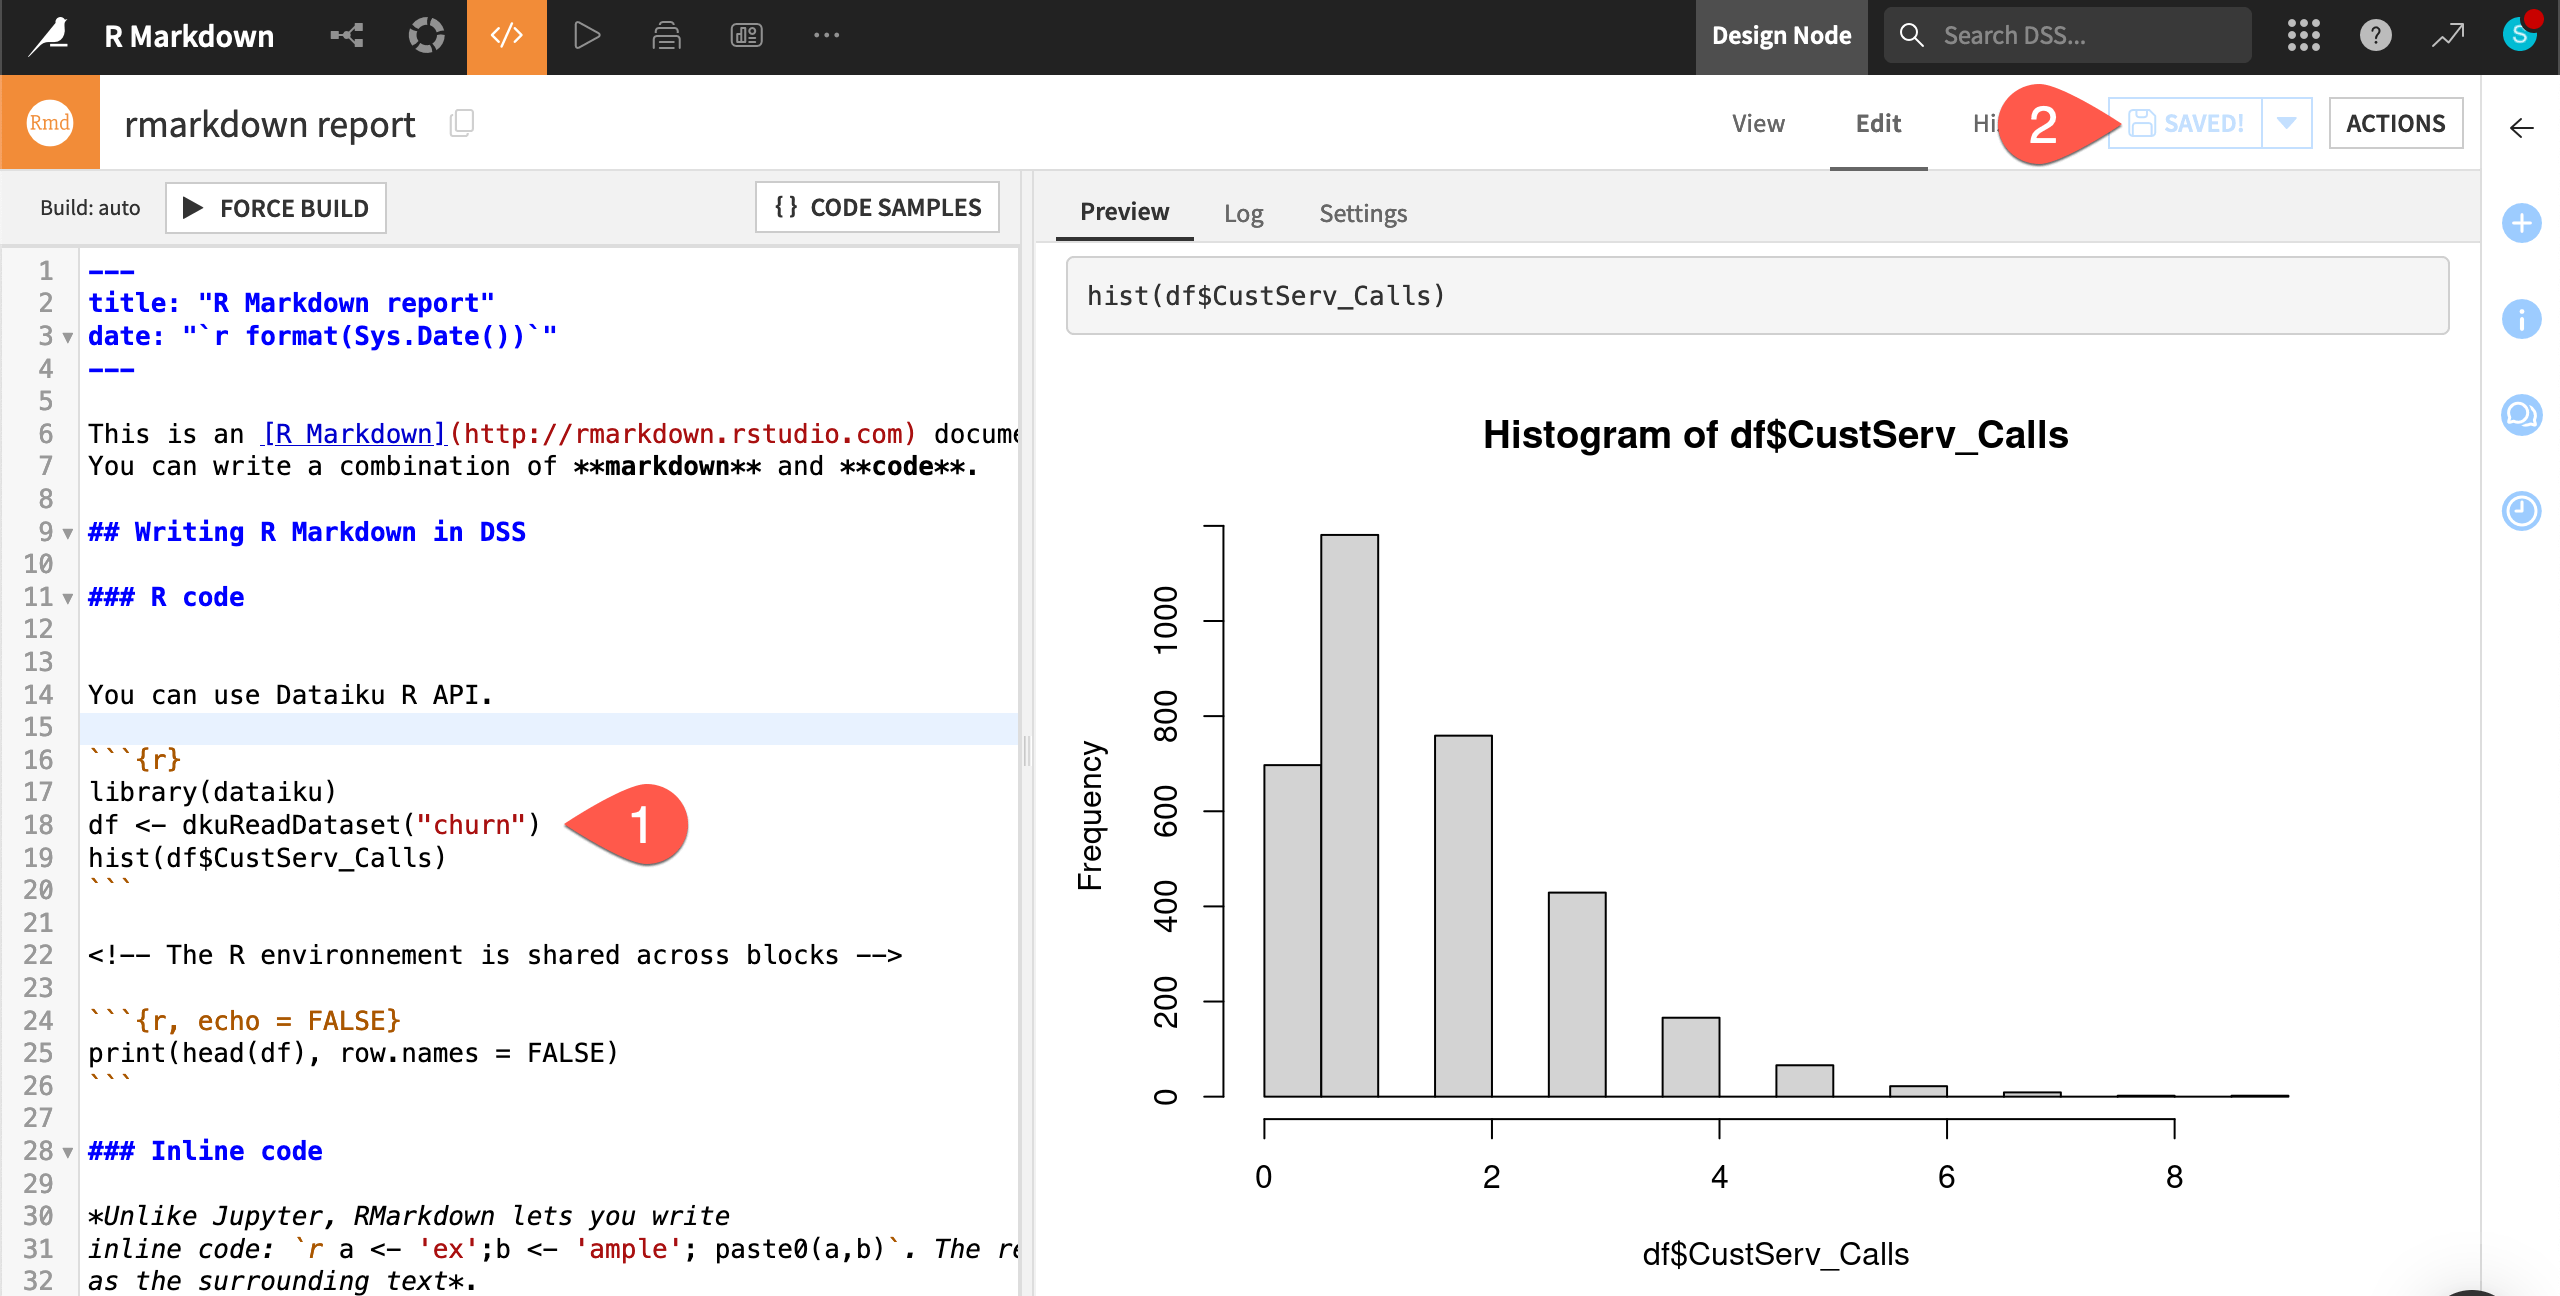
Instead of the iris dataset, let’s use the Dataiku R API to get a DataFrame of the Flow’s initial dataset called churn.
In the left pane, replace the report’s first R code block with the one below.
library(dataiku)
df <- dkuReadDataset("churn")
hist(df$CustServ_Calls)
Click Save (
Cmd/Ctrl+S) to see the report’s preview reload with a histogram.
Tip
If needed, you can disable the auto-build setting in the Settings tab of the right pane.
Add narrative text#
You can also add narrative text with markdown formatting.
Edit any of the narrative sections of the report — those not within the YAML header or a code block.
Read the rest of the report for examples of inline code and styling.
Click Save to reload the new report preview.
Publish an R Markdown report on a dashboard#
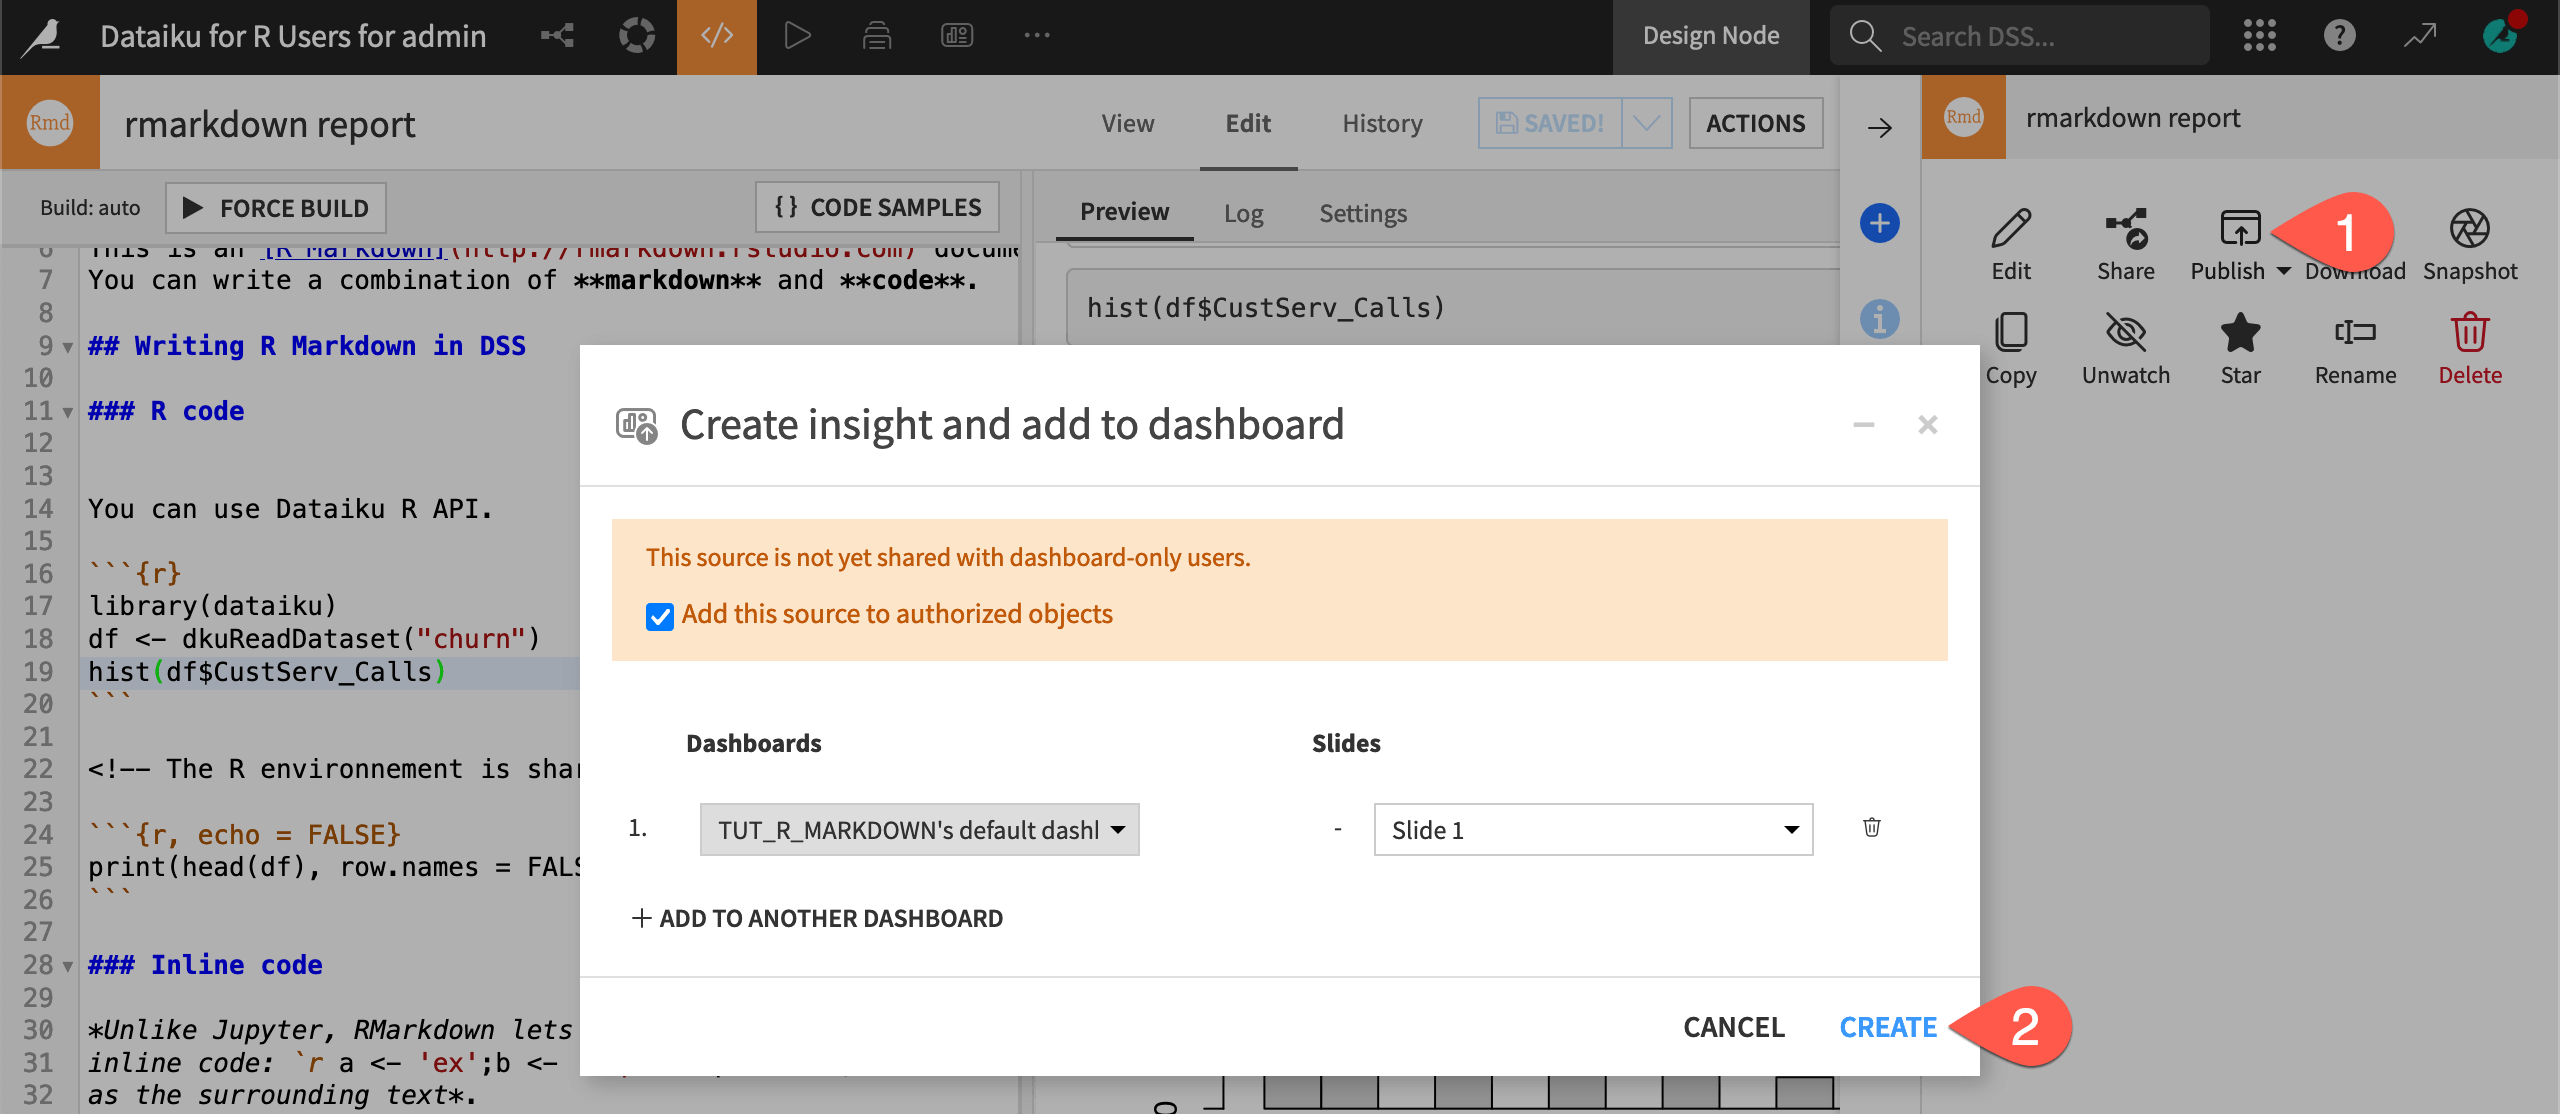
R Markdown reports in Dataiku behave like other types of insights, and so you can publish them on dashboards.
From the Actions panel of the report, click Publish > Dashboard.
When the report finishes building, click Create to save the report as an insight and add it to the project’s dashboard.
In the dashboard editor, drag the corners of the insight to increase its display dimensions.
Click Save.
Click View.
Create a snapshot of an R Markdown report#
Once you’ve published a report to a dashboard, you’ll want to make sure that updates to the report are present in the dashboard insight.
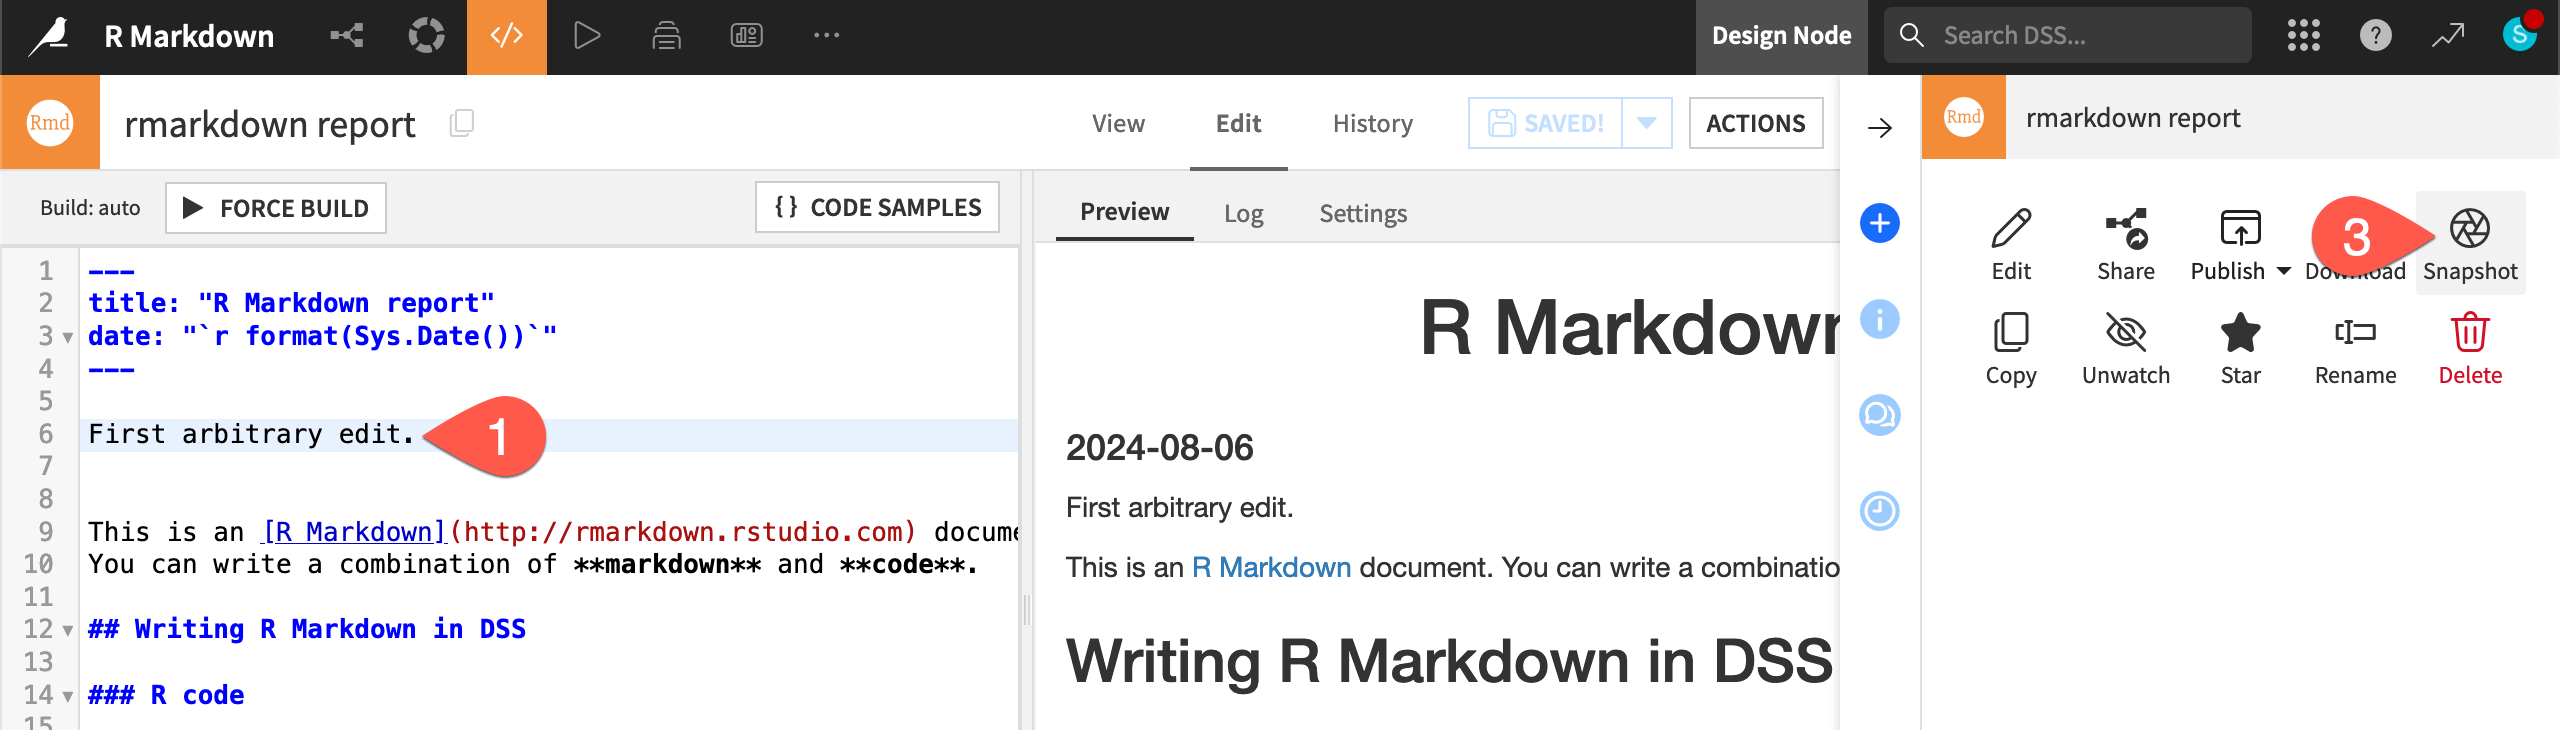
In the Edit tab of the R Markdown report, make any arbitrary change, and click Save.
Confirm the change isn’t automatically present in the dashboard insight.
In the Actions panel of the R Markdown report, click Snapshot.
Confirm the change appears in the dashboard insight.
Automate an R Markdown report snapshot#
To automate taking these snapshots, use a scenario.
Use an Export R Markdown report scenario step#
The first option is to refresh the dashboard insight with a step in a scenario.
Make another arbitrary change in the R Markdown report.
From the Jobs (
 ) menu of the top navigation bar, select Scenarios.
Click + New Scenario.
Name it
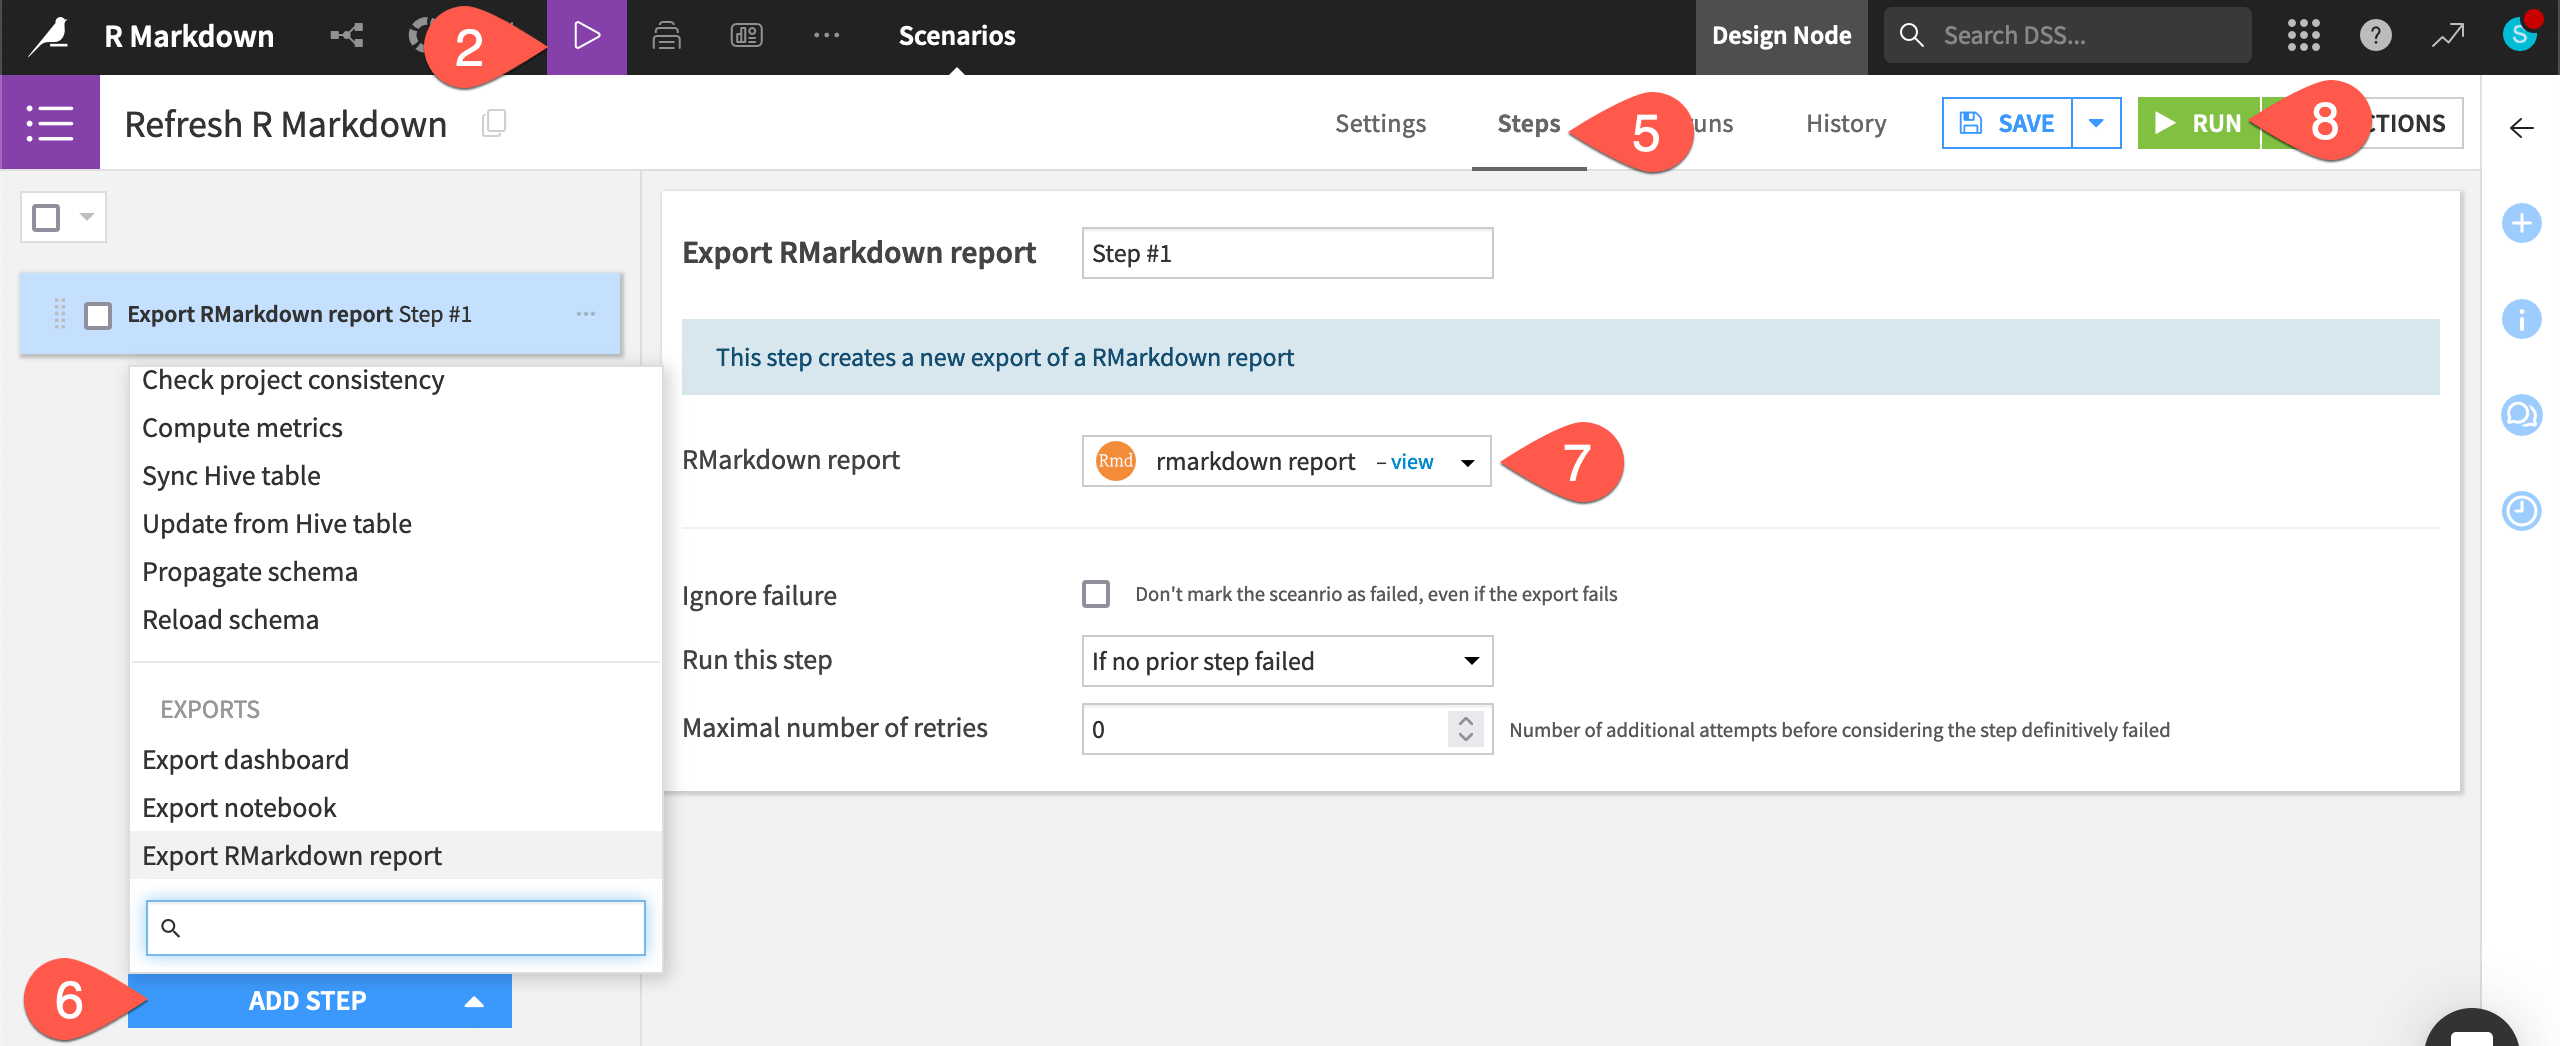
Refresh R Markdown, and click Create.Navigate to the Steps tab of the scenario.
Click Add Step > Export R Markdown report.
For the R Markdown report field, select rmarkdown report from the dropdown.
Click Run to trigger the scenario.
Confirm the latest change is present in the dashboard insight.
Attach an R Markdown report to a mail reporter#
Instead of refreshing the dashboard insight, you can also send the latest report as an attachment in a mail reporter.
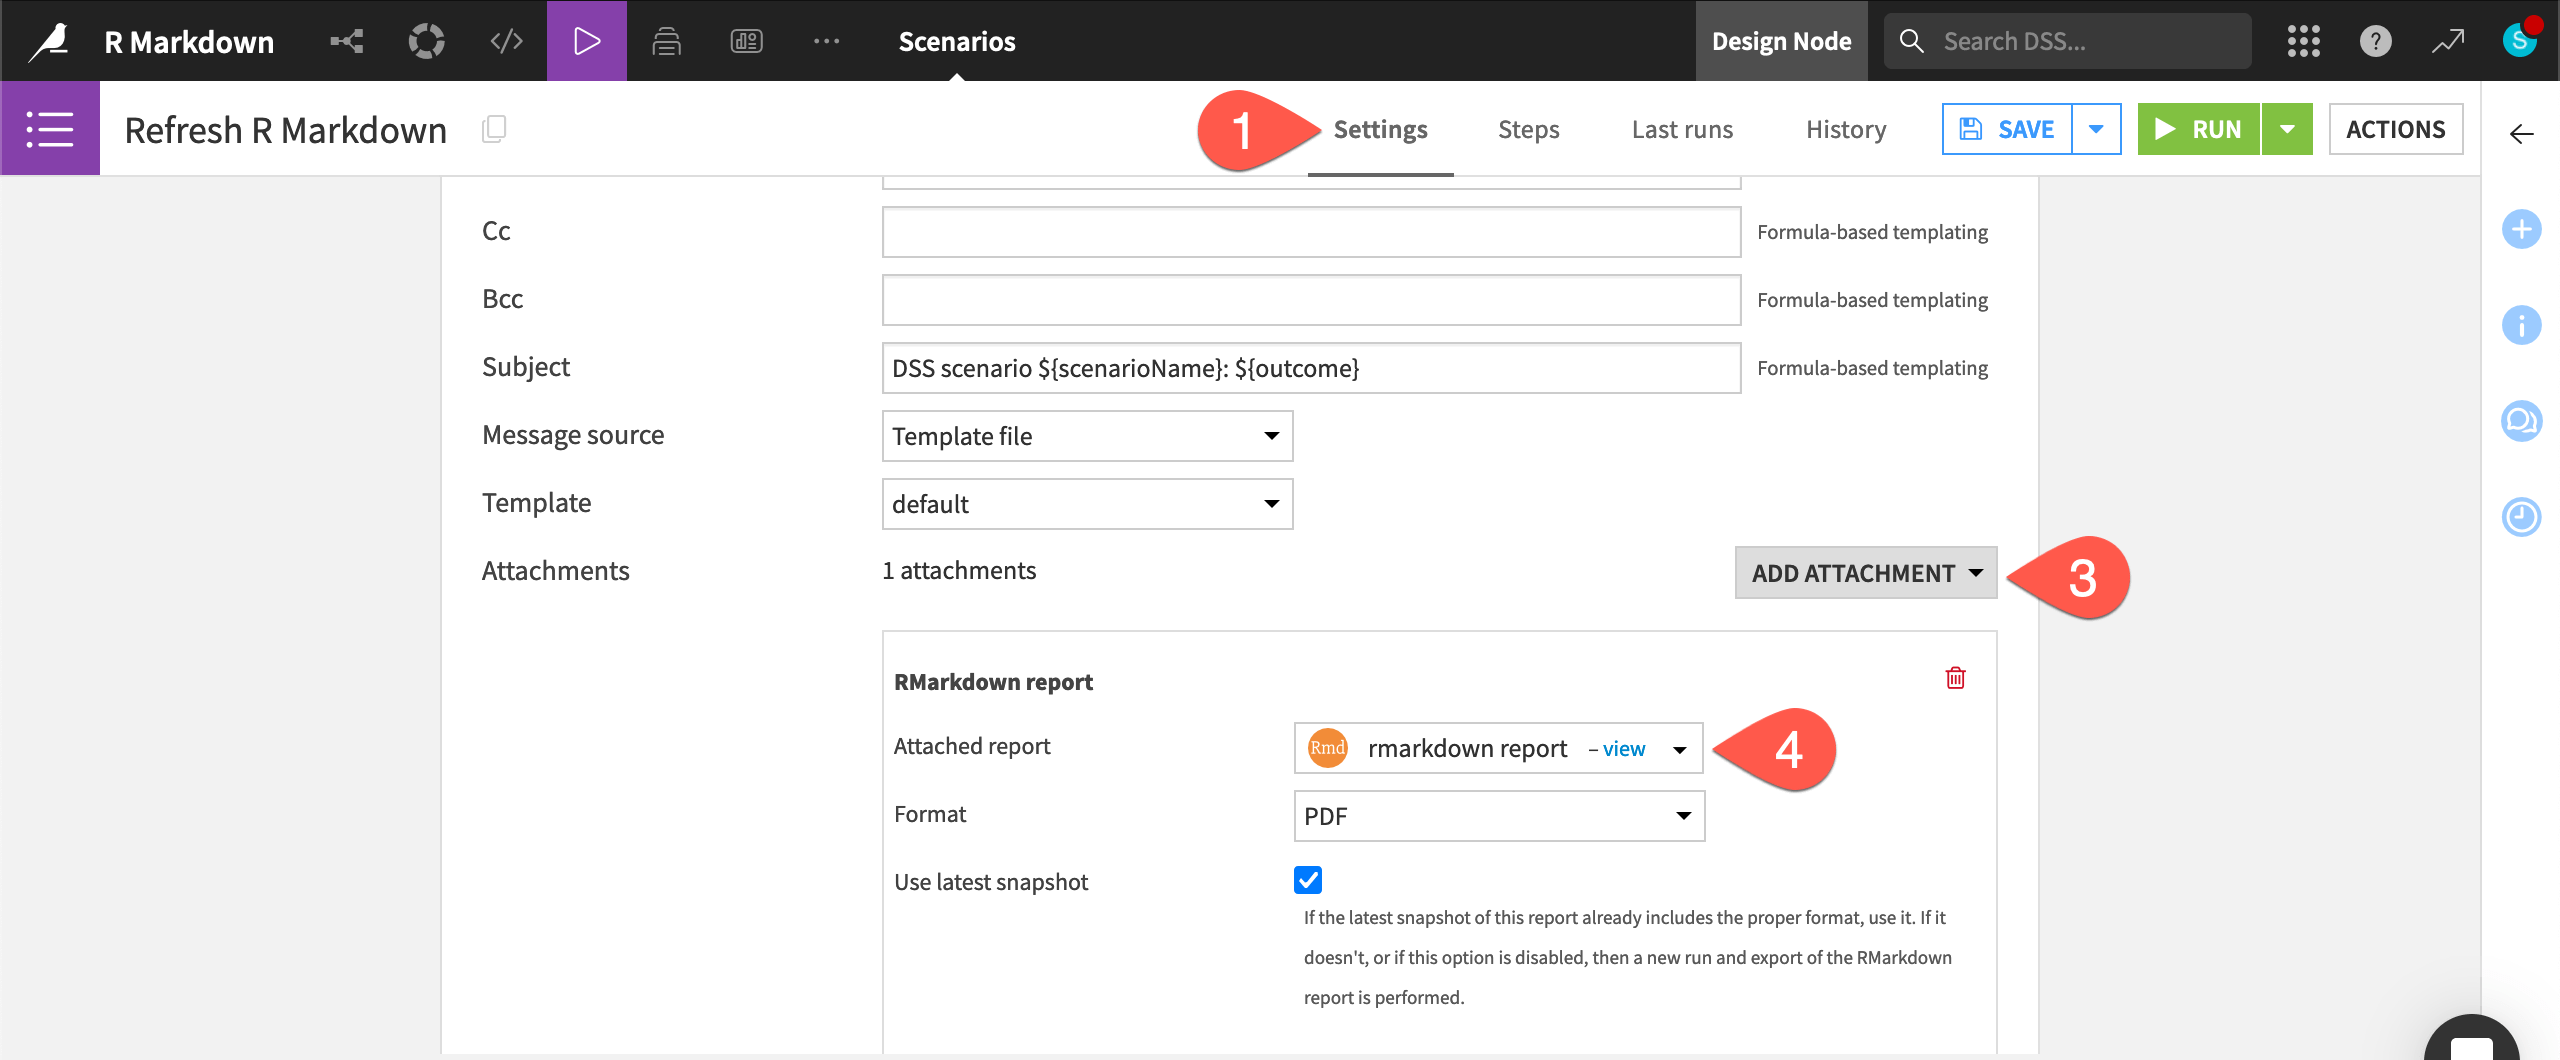
Navigate to the Settings tab of the scenario.
Click Add Reporter > Mail.
Click Add Attachment > R Markdown report.
For the attached report field, select rmarkdownreport.
Complete other necessary details for the mail reporter.
Tip
You can see a walkthrough of a scenario reporter in Tutorial | Scenario reporters.
Next steps#
Congratulations! Using Dataiku, you have created an R Markdown report.
To gain more practice using R with Dataiku, see Tutorial | Dataiku for R users.
You can also learn more in the reference documentation on R Markdown reports or, more generally, on DSS and R.