
Quick Start | Dataiku for AI collaboration#
Get started#
Are you interested in using Dataiku to collaborate with colleagues of diverse skill sets and responsibilities? You’re in the right place!
Create an account#
To follow along with the steps in this tutorial, you need access to a 12.6+ Dataiku instance. If you don’t already have access, you can get started in one of two ways:
Follow the link above to start a 14 day free trial. See How-to | Begin a free trial from Dataiku for help if needed.
Install the free edition locally for your operating system.
Open Dataiku#
The first step is getting to the homepage of your Dataiku Design node.
Go to the Launchpad.
Within the Overview panel, click Open Instance in the Design node tile once your instance has powered up.
Important
If using a self-managed version of Dataiku, including the locally downloaded free edition on Mac or Windows, open the Dataiku Design node directly in your browser.
Once you are on the Design node homepage, you can create the tutorial project.
Create the project#
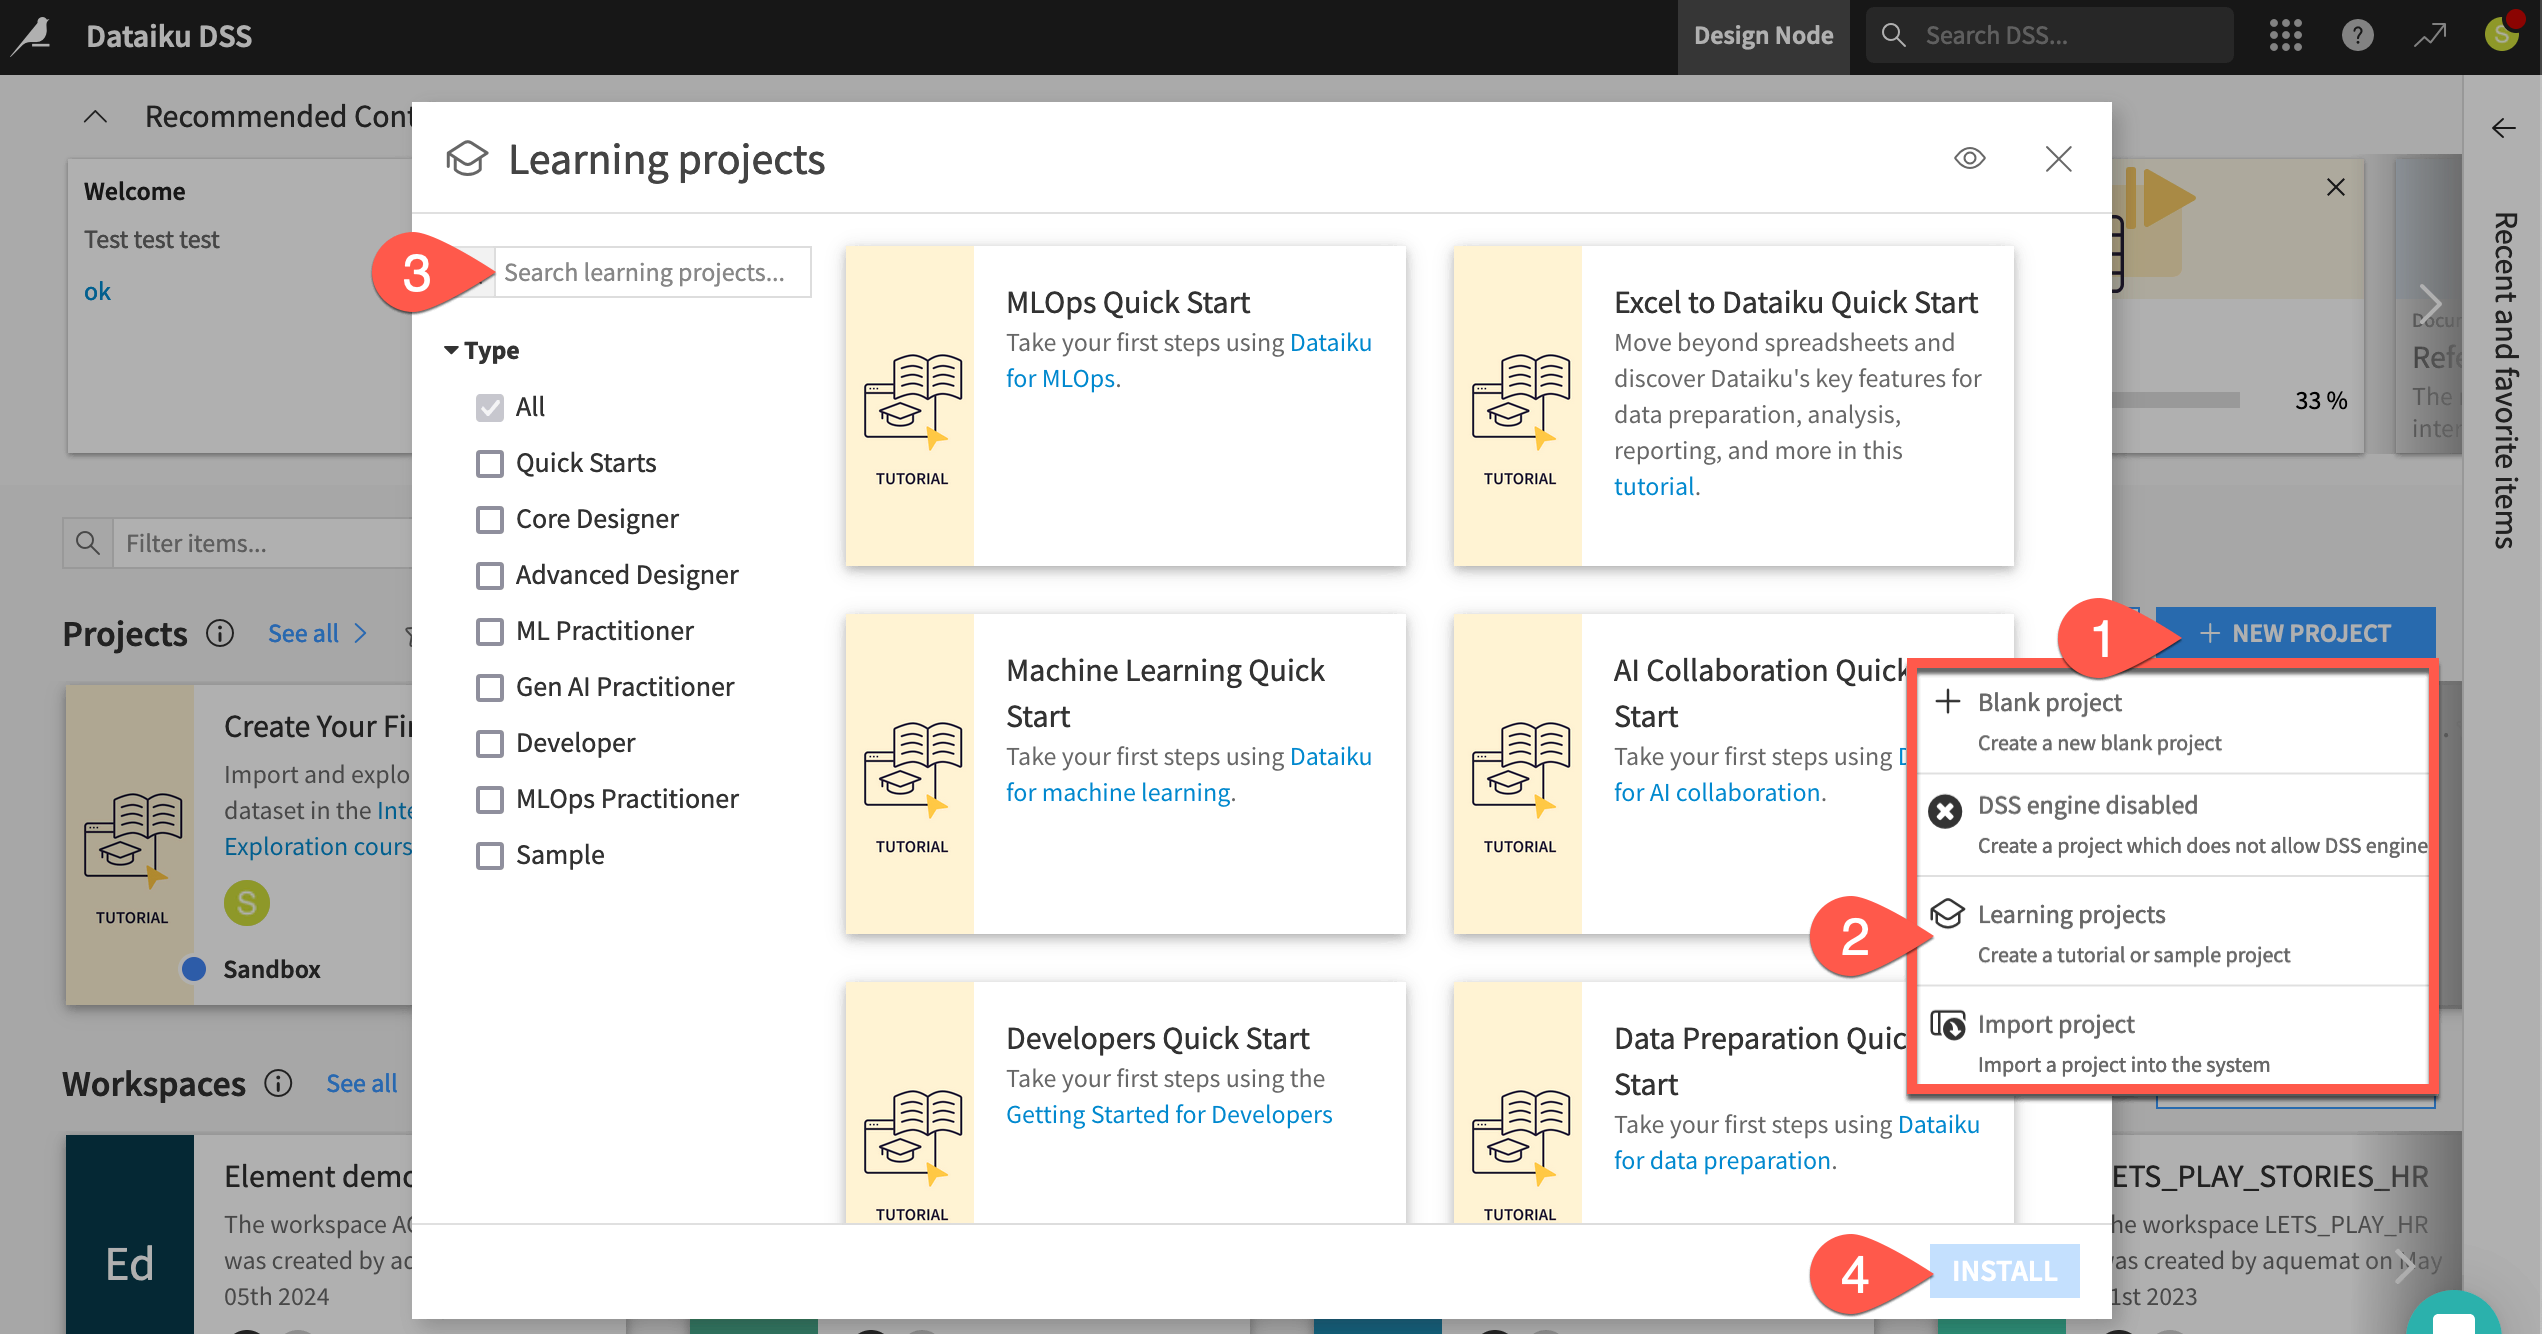
From the Dataiku Design homepage, click + New Project.
Select Learning projects.
Search for and select AI Collaboration Quick Start.
If needed, change the folder into which the project will be installed, and click Create.
From the project homepage, click Go to Flow (or type
g+f).
Note
You can also download the starter project from this website and import it as a ZIP file.
Are you using an AI Consumer user profile?
AI Consumer user profiles don’t include the permission to create a new project. However, as a Designer on a free trial or free edition, you’ll be able to do this on your own!
If using an AI Consumer profile, have your instance administrator follow the steps below so you can complete the quick start:
Create the project above.
Build the Flow.
Assume the role of the Score Data scenario’s last author by making an arbitrary change to the scenario (such as to the trigger) and saving it.
Grant you permission to access the project.
Understand the project#
See a screencast covering this section’s steps
First take a moment to understand the goals for this quick start and the data at hand.
Objectives#
Rather than designing new elements like in the other task-based quick starts, this one focuses on how to collaborate with colleagues and use the AI capabilities they have already created as inputs for your own tasks.
In this quick start, you’ll:
Understand a project’s objectives by reviewing the Flow.
Recognize how group assignments impact project security.
Communicate insights with a dashboard.
Run a colleague’s workload by using both an automation scenario and a Dataiku app.
Tip
To check your work, you can review a completed version of this entire project from data preparation through MLOps on the Dataiku gallery.
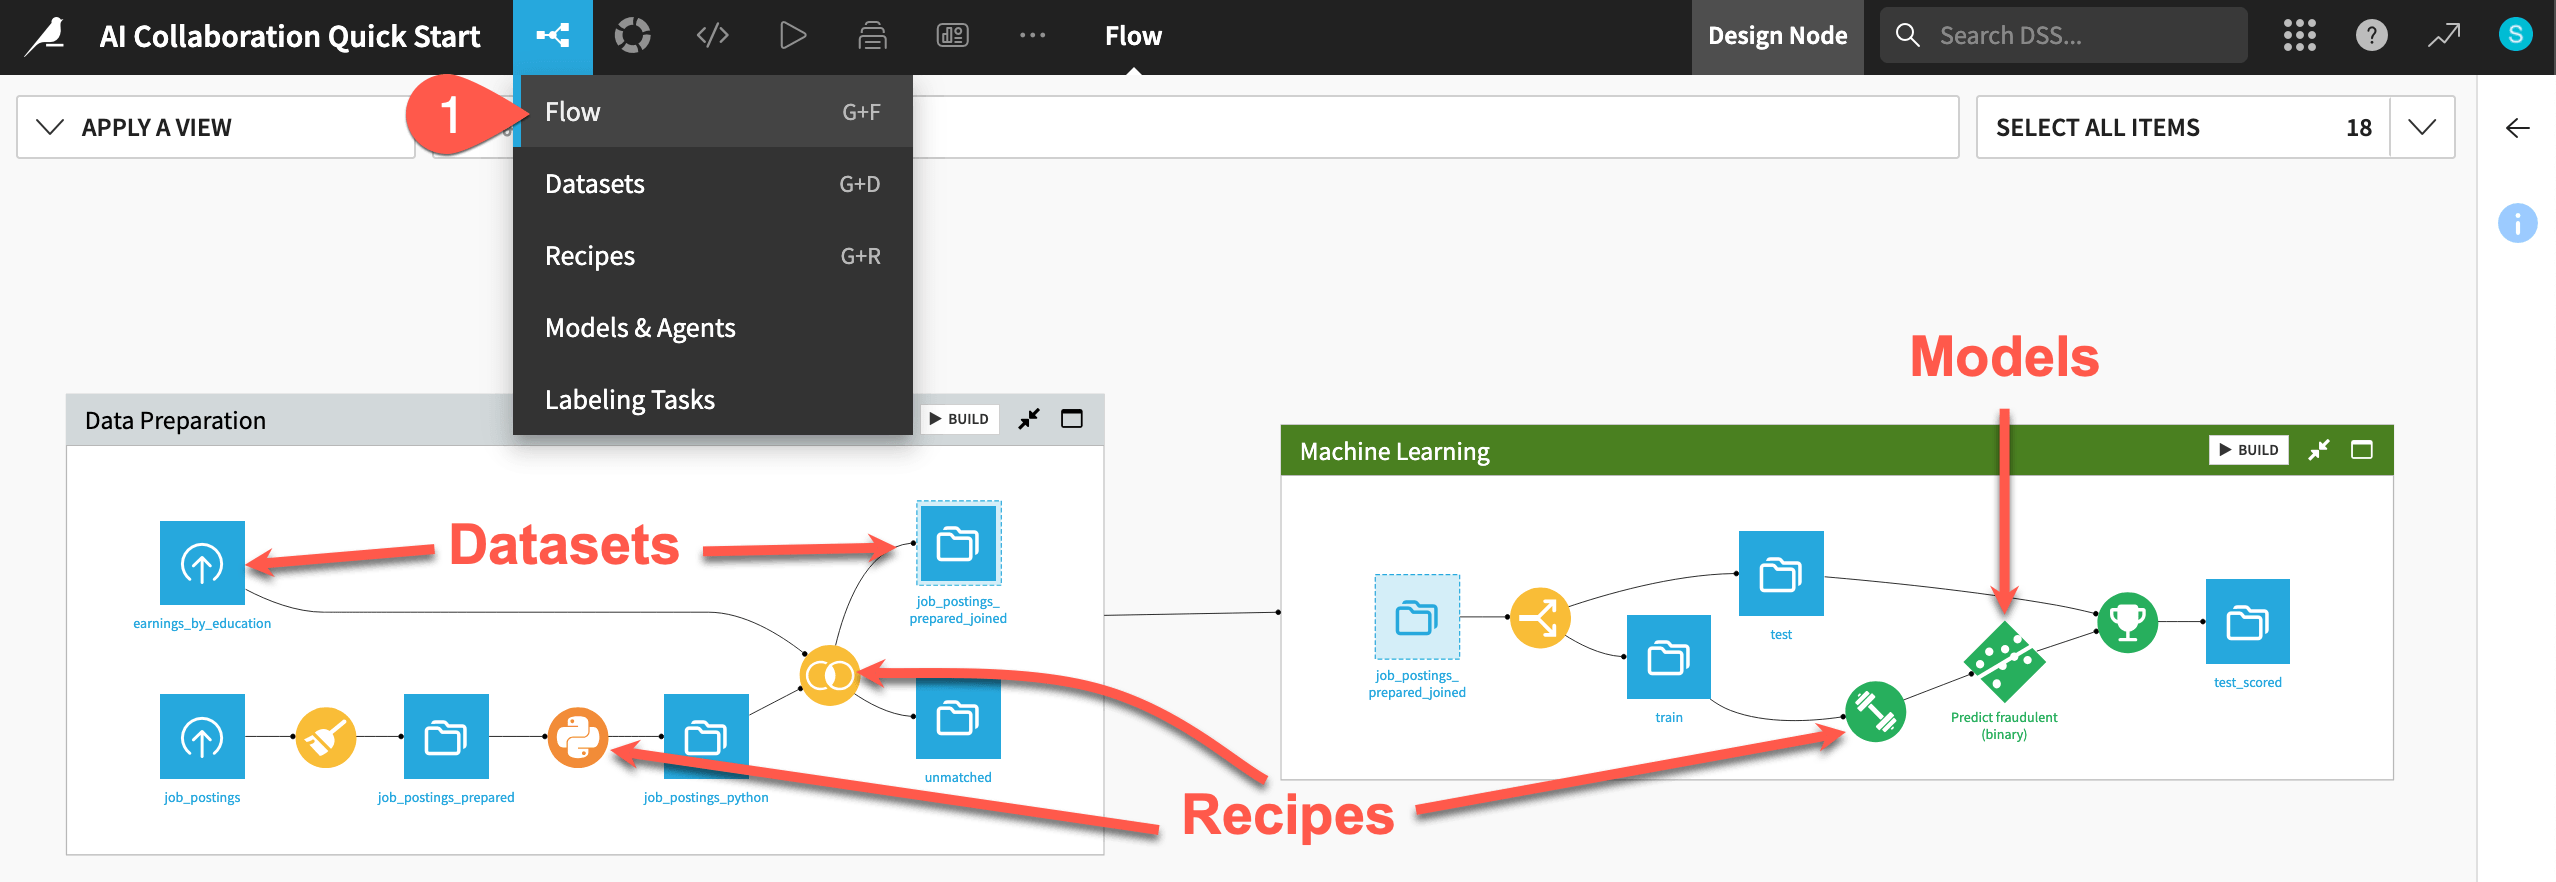
Review the Flow#
One of the first concepts a user needs to understand about Dataiku is the Flow. The Flow is the visual representation of how datasets, recipes (steps for data transformation), models, and agents work together to move data through an analytics pipeline.
Dataiku has its own visual grammar to organize AI and analytics projects in a collaborative way.
Shape |
Item |
Icon |
|---|---|---|

|
Dataset |
The icon on the square represents the dataset’s storage location, such as Amazon S3, Snowflake, PostgreSQL, etc. |

|
Recipe |
The icon on the circle represents the type of data transformation, such as a broom for a Prepare recipe or coiled snakes for a Python recipe. |

|
Model or Agent |
The icon on a diamond represents the type of modeling task (such as prediction, clustering, time series forecasting, etc.) or the type of agent (such as visual or code). |
Tip
In addition to shape, color has meaning too.
Datasets and folders are blue. Those shared from other projects are black.
Visual recipes are yellow.
Code elements are orange.
Machine learning elements are green.
Generative AI and agent elements are pink.
Plugins are often red.
Take a look at the items in the Flow now!
If not already there, from the (
 ) menu in the top navigation bar, select the Flow (or use the keyboard shortcut
 g+f).
Tip
There are many other keyboard shortcuts! Type ? to pull up a menu or see the Accessibility page in the reference documentation.
Use the right panel to review an item’s details#
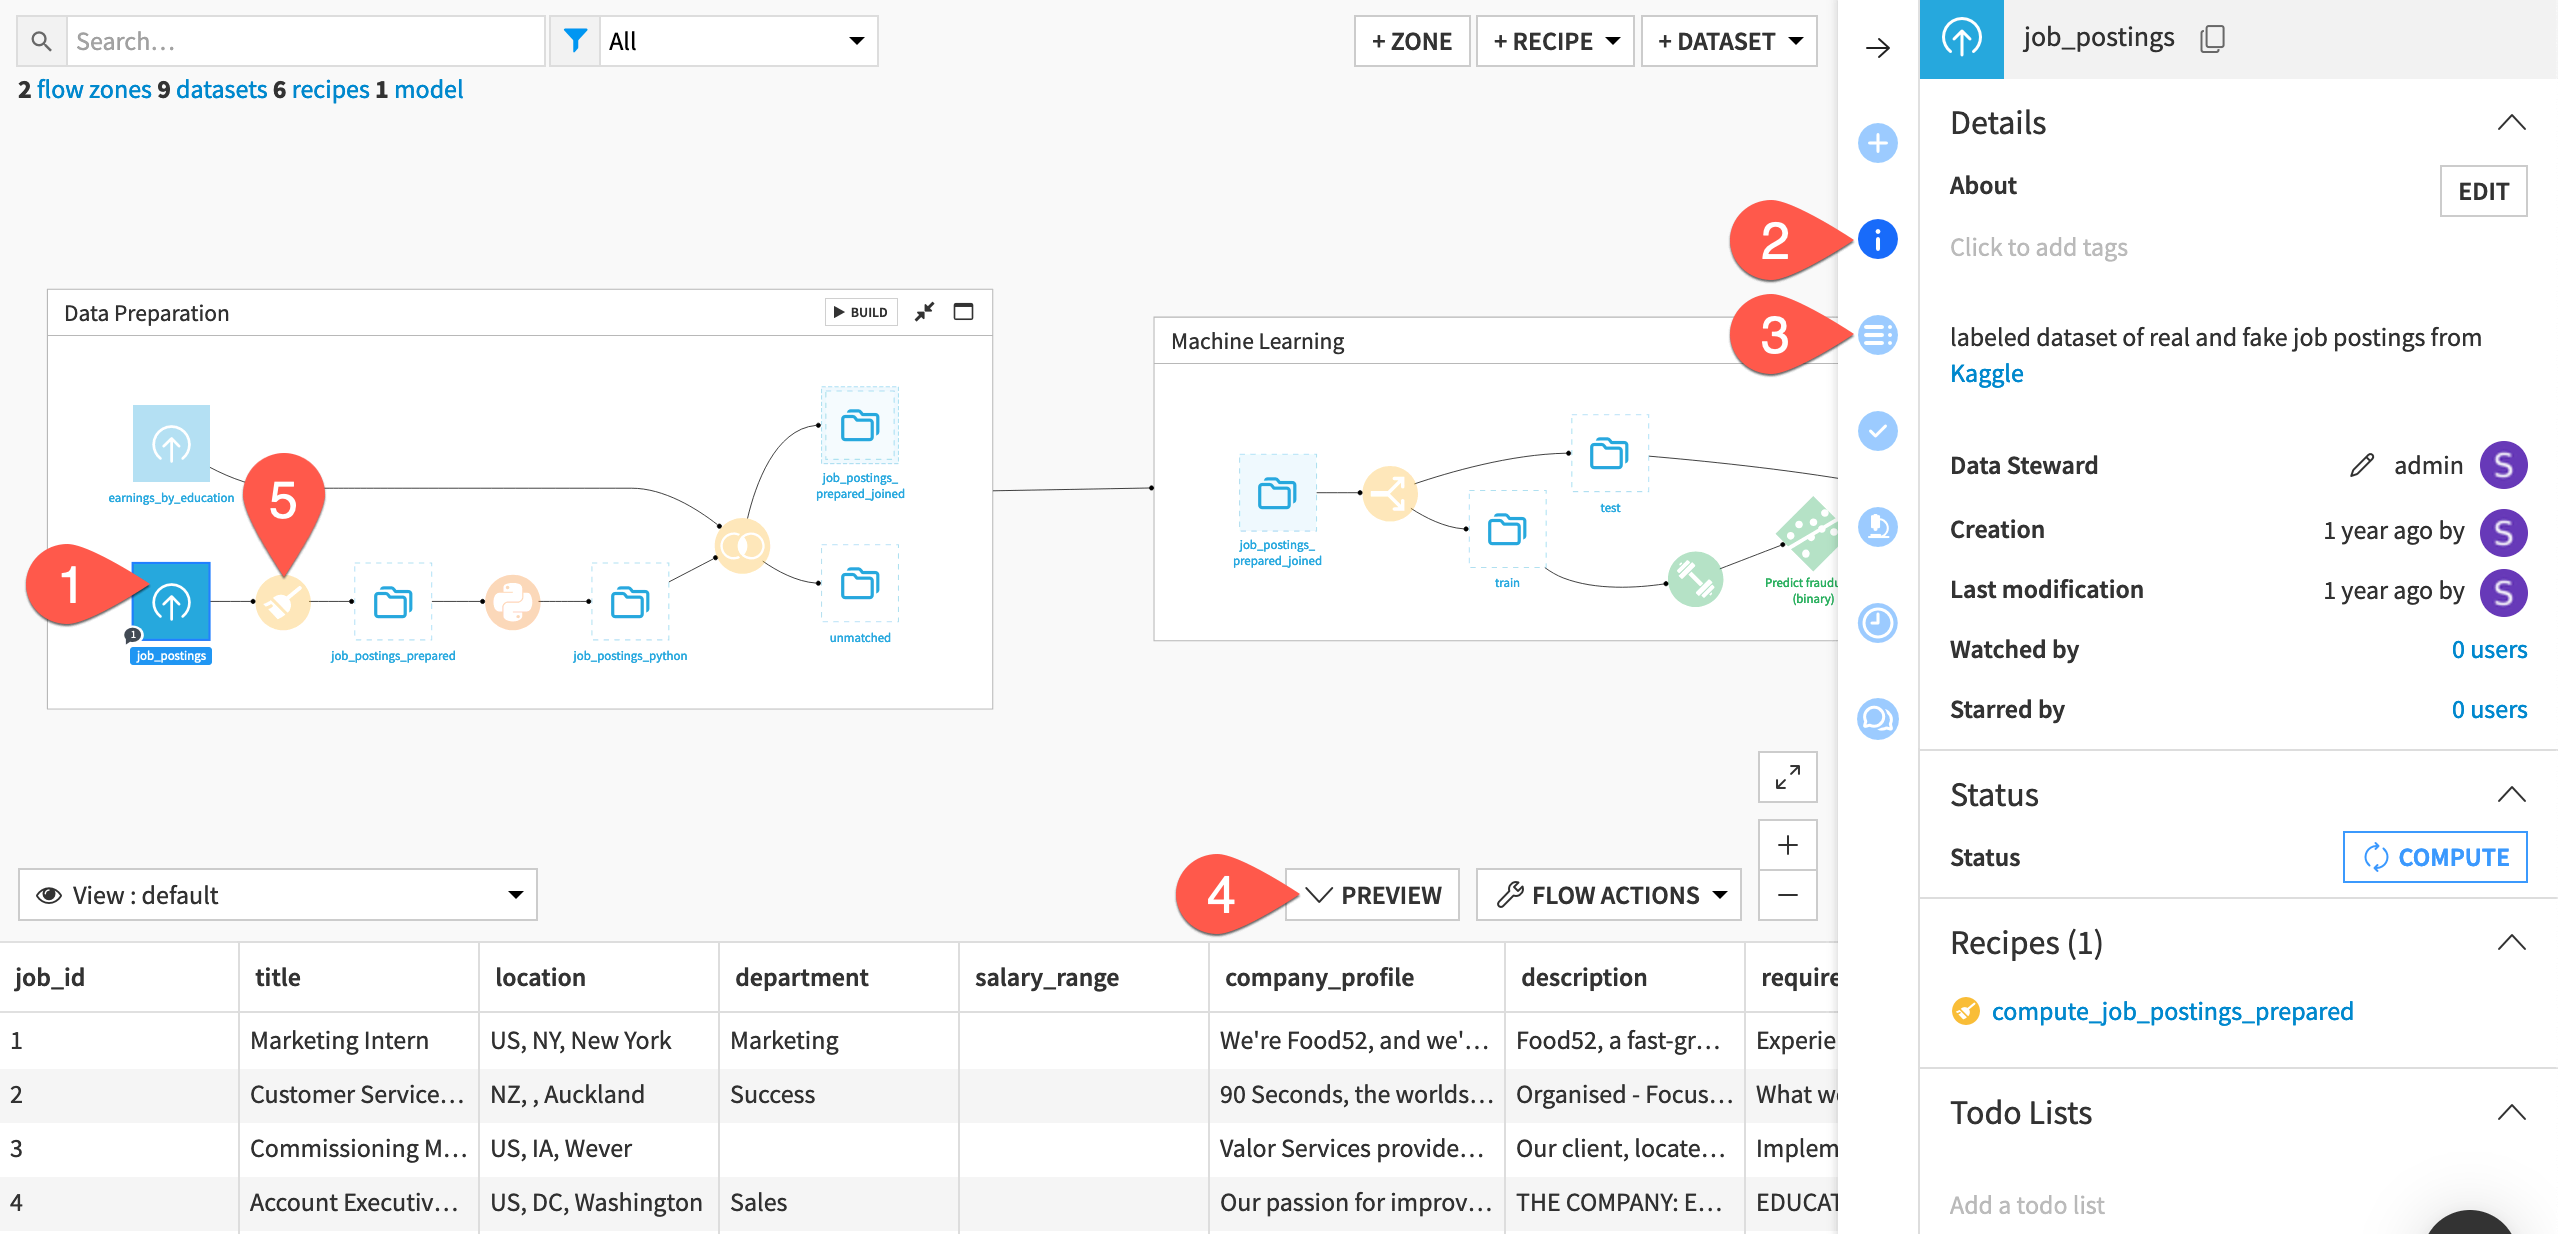
To collaborate on a project, you’ll need to learn what a colleague’s Flow accomplishes. Try to figure out the purpose of this one.
At the far left of the Flow, click once on the job_postings dataset to select it.
Click the Details (
 ) icon in the right panel to review its metadata.
Click the Schema (
 ) icon underneath to see its columns.
Click Preview (or use the keyboard shortcut
Shift+P) to pull up the first few rows of data.Beginning with the Prepare recipe (
 ) at the start of the pipeline, review the recipes that transform the job_postings dataset at the far left to the jobs_sampled dataset at the far right. Click once to select each one, and review the Details tab to help determine what they do.
See also
For more details on what’s found in the Flow itself, see the other task-based quick starts.
You could read the project’s wiki (use the keyboard shortcut g + w) for more information. However, from only browsing the Flow, you probably already have a good idea of what this project does:
The pipeline starts by preparing some data on job postings.
It then builds a prediction model to classify a job posting as real or fake.
The final zone is the starting point for leveraging large language models (LLMs) on this data.
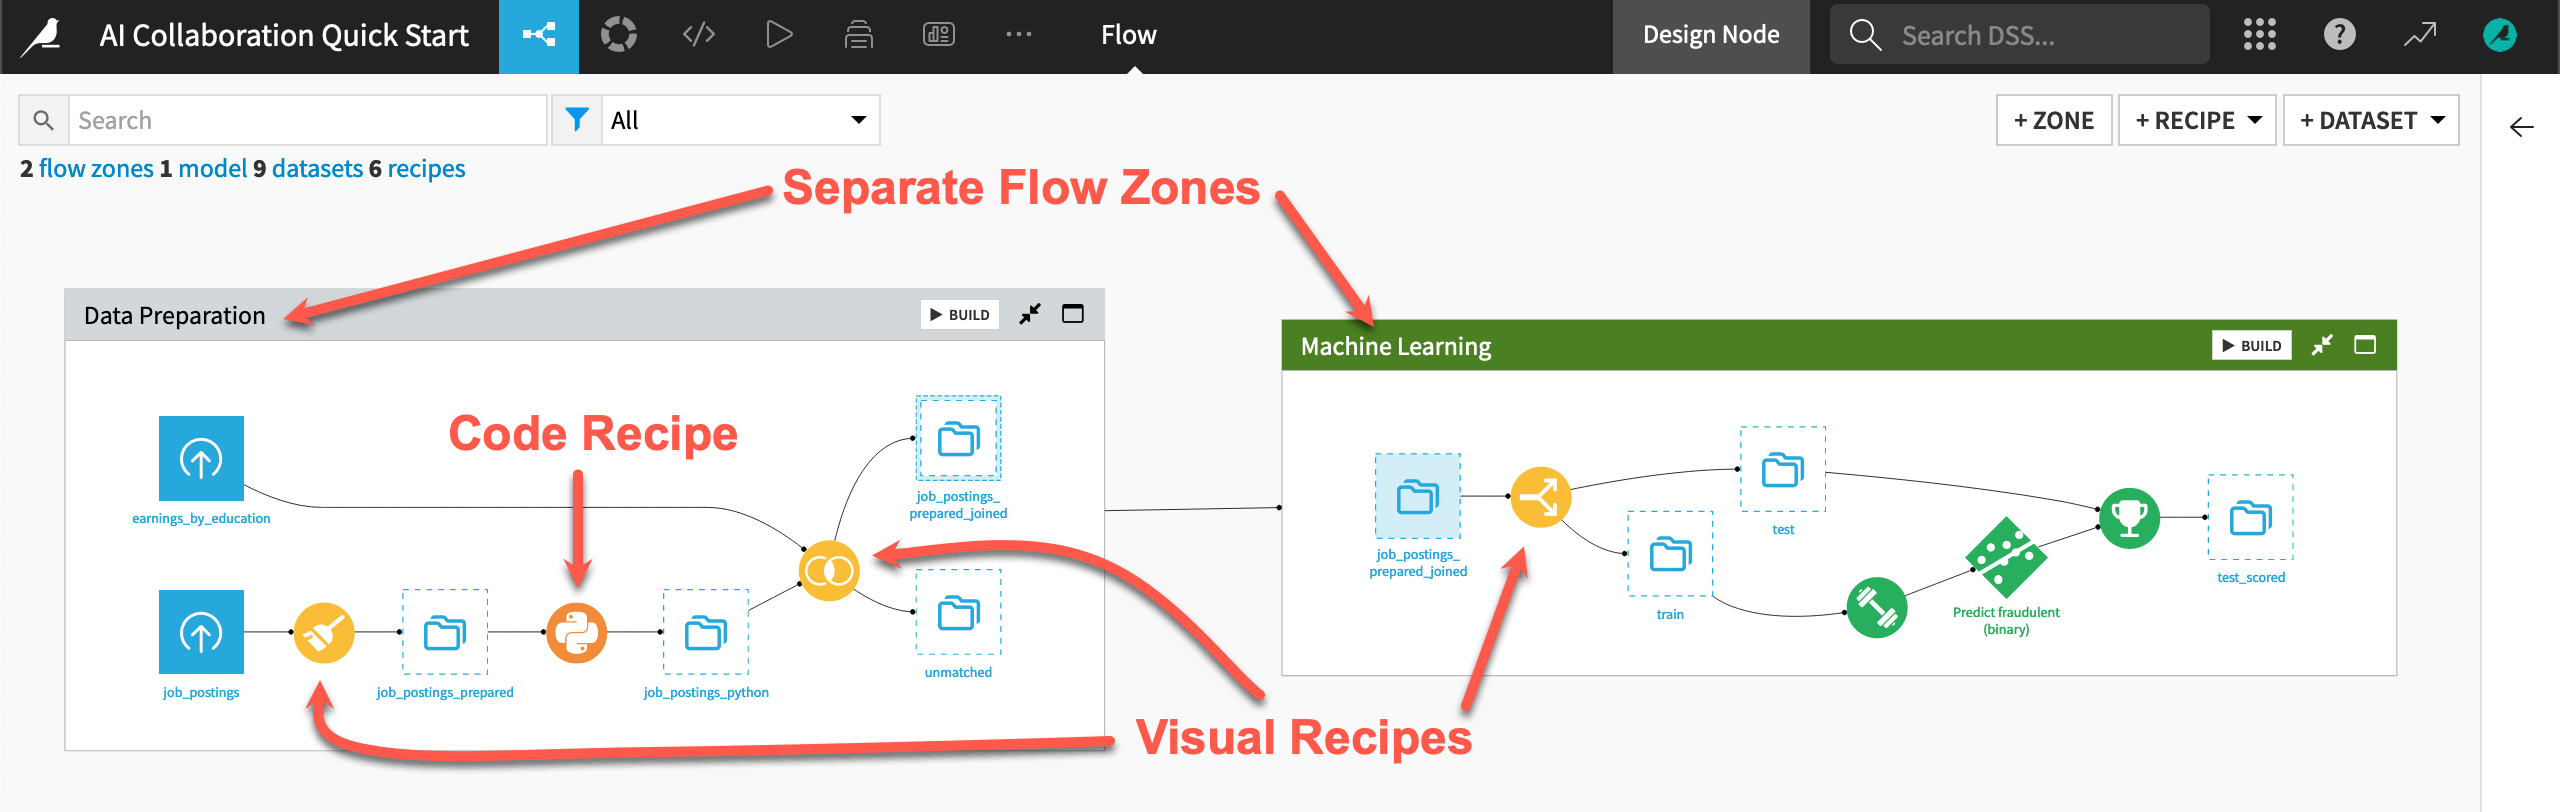
The readability of the Flow eases the challenge of bringing users of diverse skill sets and responsibilities onto the same platform. For example:
The Flow has visual recipes (in yellow) that everyone can understand, but also custom code (in orange).
Interconnected Flow zones divide the Flow. Such zones can be useful for organizing different stages of a project.
Tip
A feature like AI Explain is also a great tool for understanding a colleague’s Flow.
Build the Flow#
Unlike the initial uploaded datasets, the downstream datasets appear as outlines. This is because no one has built them. In other words, no one has run the relevant recipes to populate these datasets. However, this isn’t a problem because the Flow contains the recipes required to create these outputs at any time.
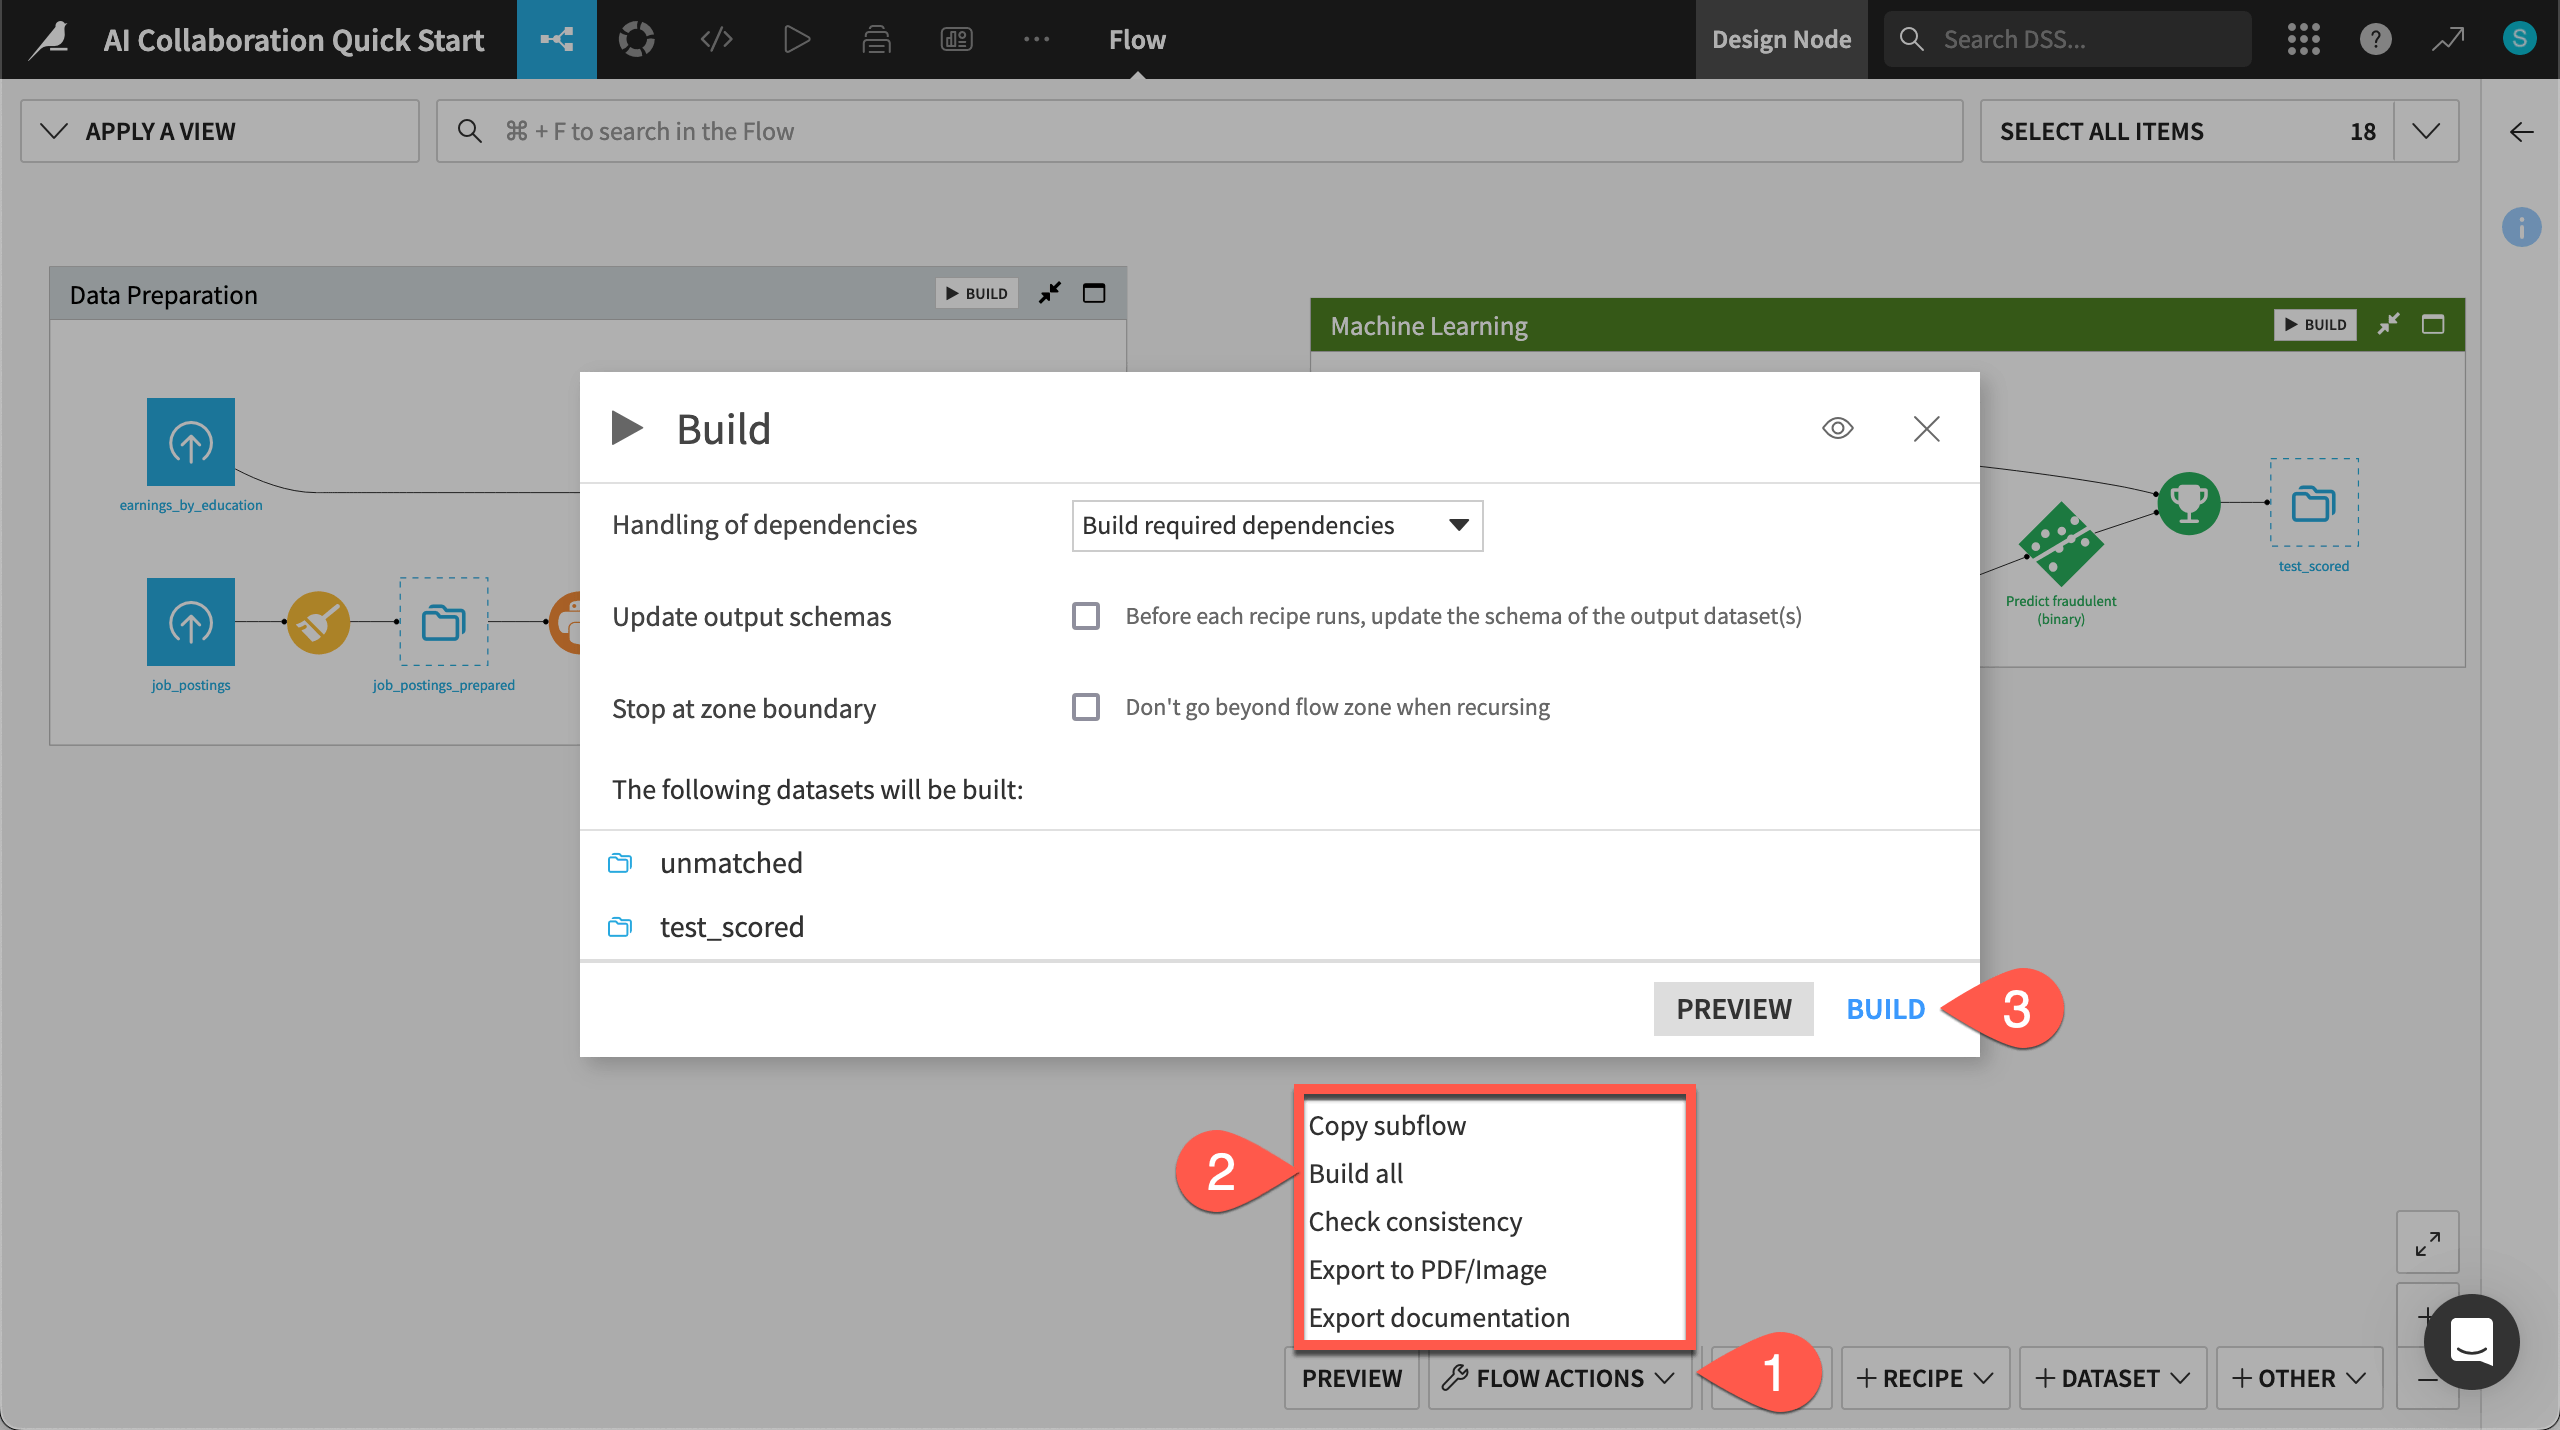
Open the Flow Actions menu.
Click Build all.
Leaving the default options, click Build to run the recipes necessary to create the items furthest downstream.
When the job completes, refresh the page to see the built Flow.
Collaborate in real-time through a browser#
See a screencast covering this section’s steps
Now that you have built the project, you might want to get straight to work. Before you dive in, take a moment to review a few collaboration principles.
Work in a browser#
One point not to overlook is that you access Dataiku through a web browser (rather than say, for example, a desktop application). This has a number of advantages:
You can work with large datasets in a secure and governed way.
You can avoid lost time for data transfer across networks.
You can better track a project’s version history and user contributions.
Understand the groups-based permission framework#
A browser-based tool also enables a groups-based permission framework. Start by recognizing some basic details about your account.
In the top right corner, click on the Profile icon.
Click the gear icon to open Profile and settings.
Find your user profile and the groups to which you belong.
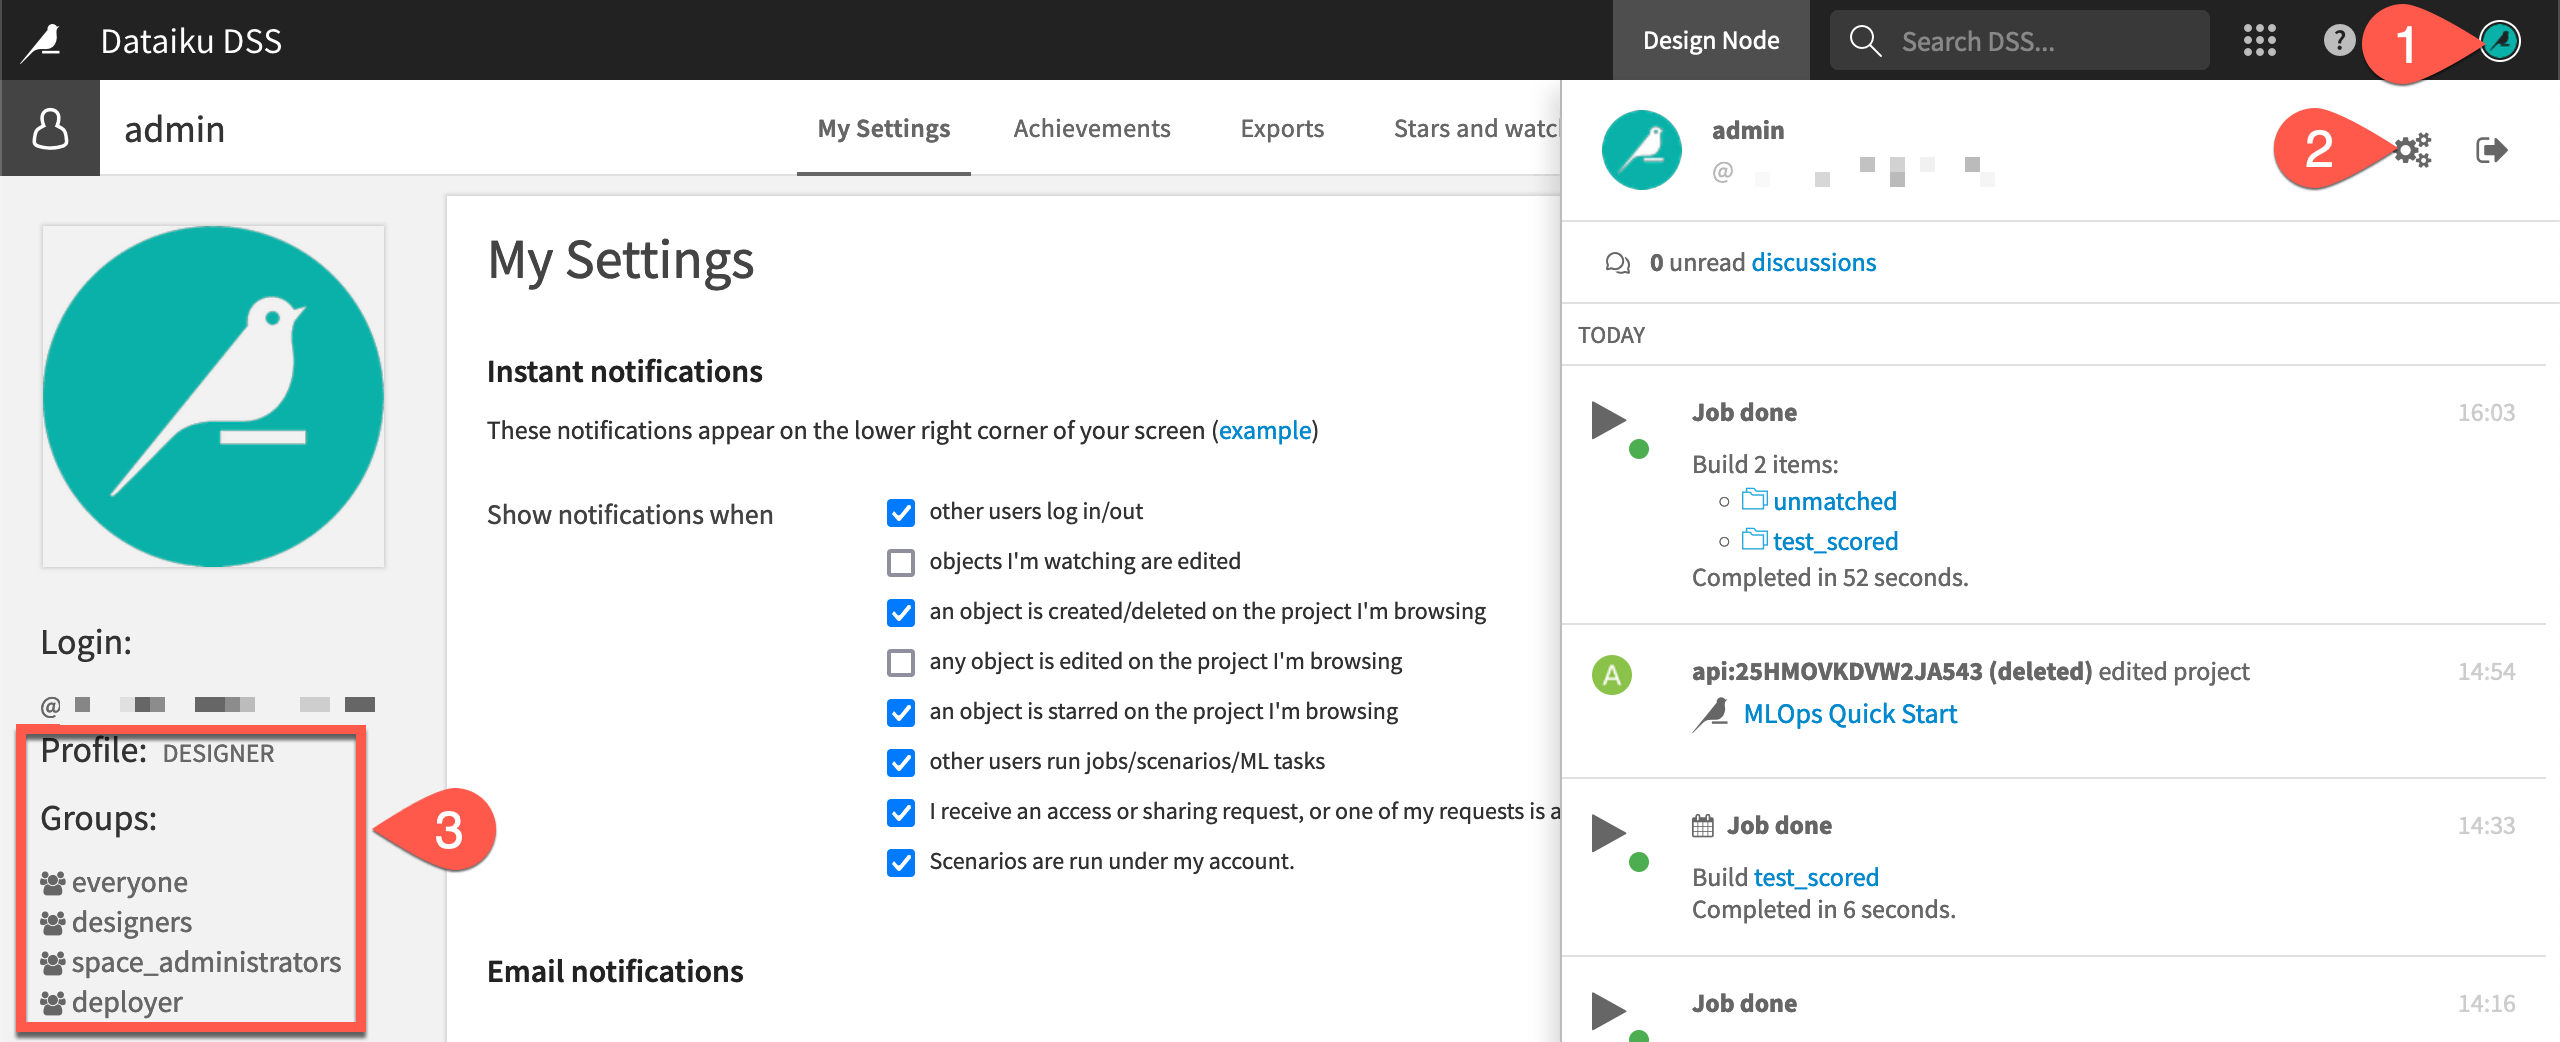
Common user profiles include Data Designer, Advanced Analytics Designer, Full Designer, and AI Consumer. As an example, if on a free trial, your profile will be designer, and you’ll be a member of the designers and space_administrators groups.
Based on your group membership, you may have projects or workspaces shared with you. You’ll then have permissions set for what you can do in these items (such as writing project content or only reading project content).
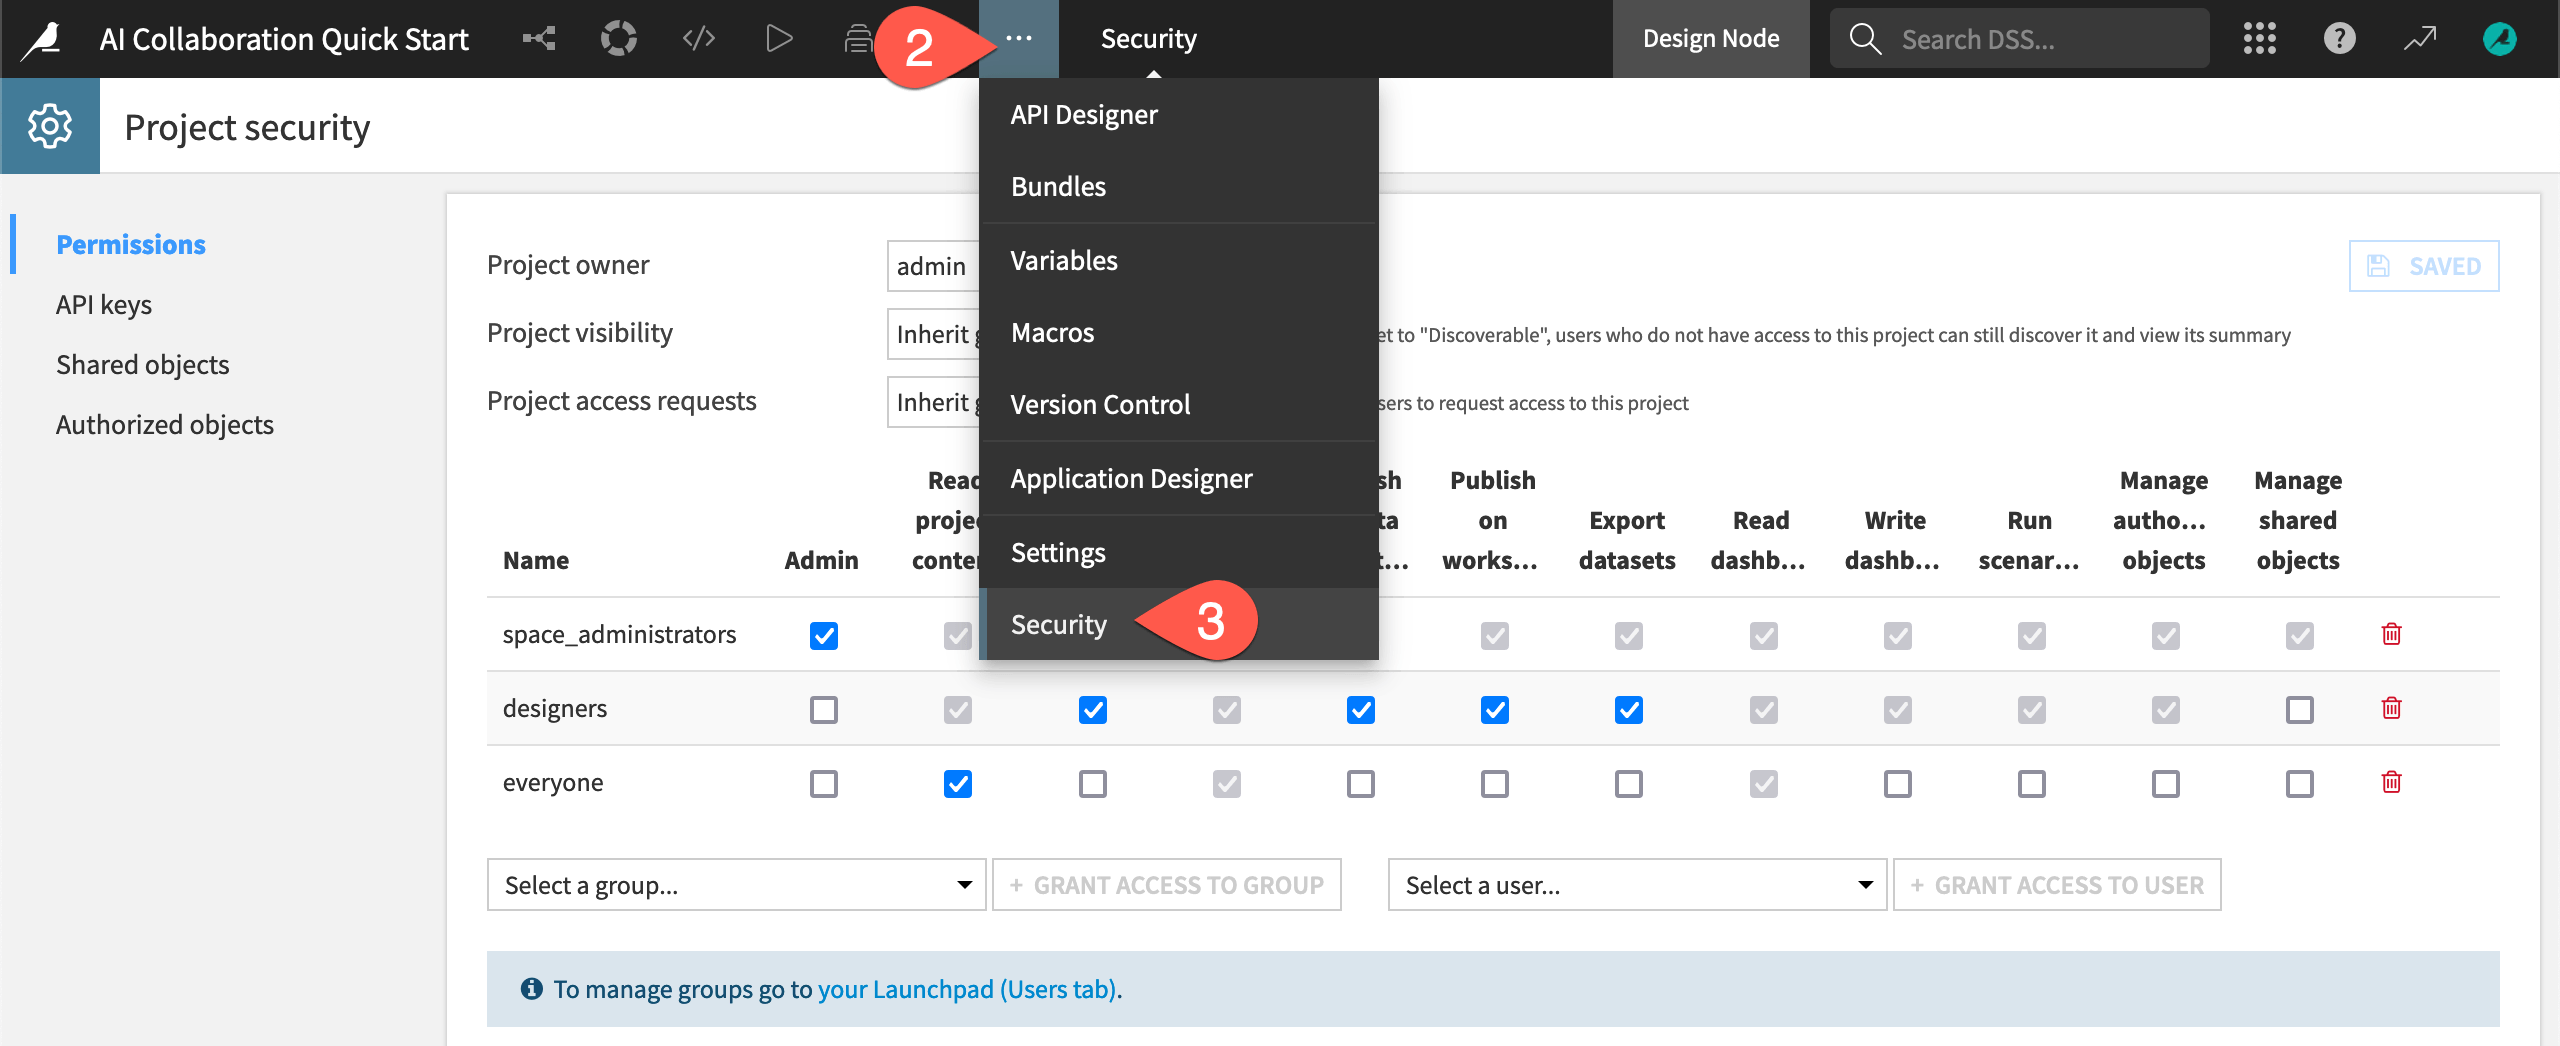
Assuming you created the job postings project yourself, you’ll be able to view the project’s security settings. These settings include information such as the project owner and the specific project permissions granted to each group or user.
Return to the project (for example, using the back arrow in your browser).
From the top navigation bar, go to the More Options (
 ) menu.
Select Security to view the permissions matrix for the project.
Tip
Users can invite a colleague to their space from the Users & Access Management panel of their Launchpad.
Self-managed Dataiku users with the appropriate permissions can do the same from the Administration > Security > Users panel. Then, grant this user access to your project from the above Permissions panel of the Project security page!
Communicate with colleagues#
Once your colleagues share the same instance space, you’ll be able to collaborate in real-time.
Start discussions on objects, such as from the Discussions (
 ) tab of the right panel.
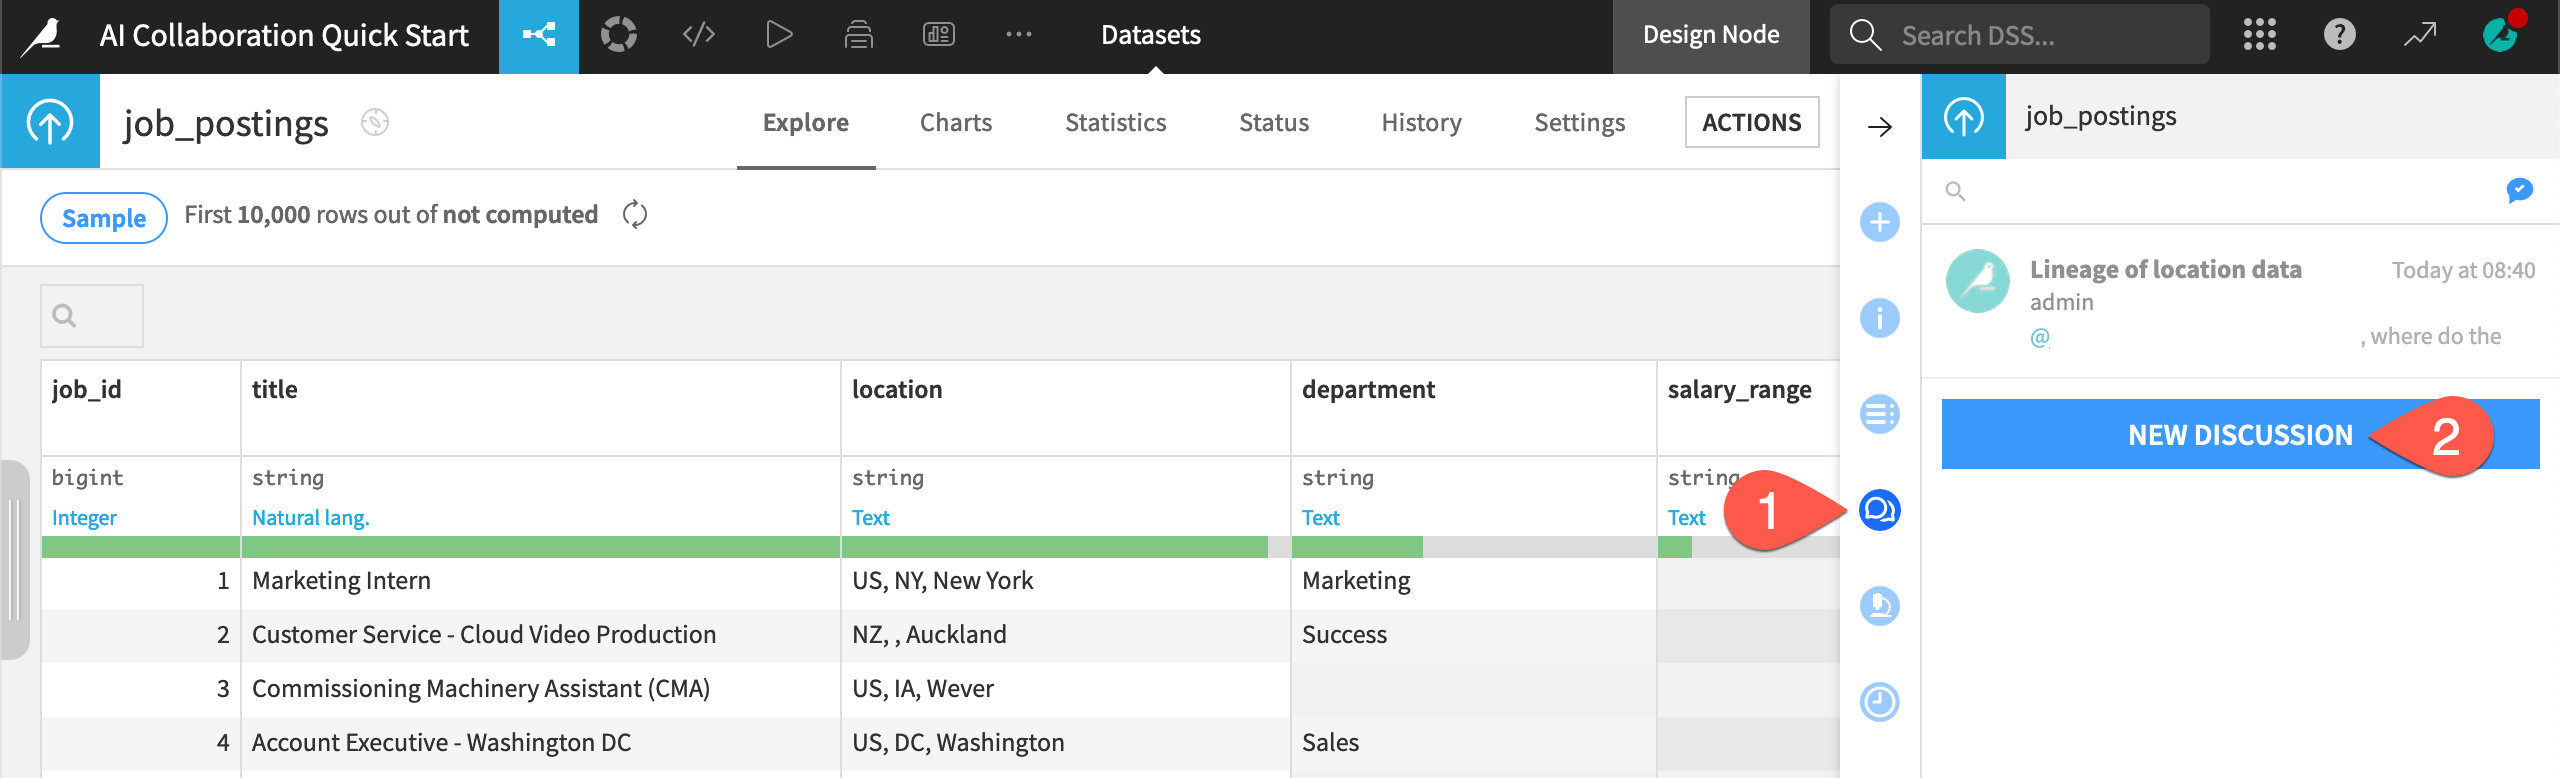
Manage requests and review discussions from your Inbox found from the waffle (
 ) menu in the top right of the navigation bar.
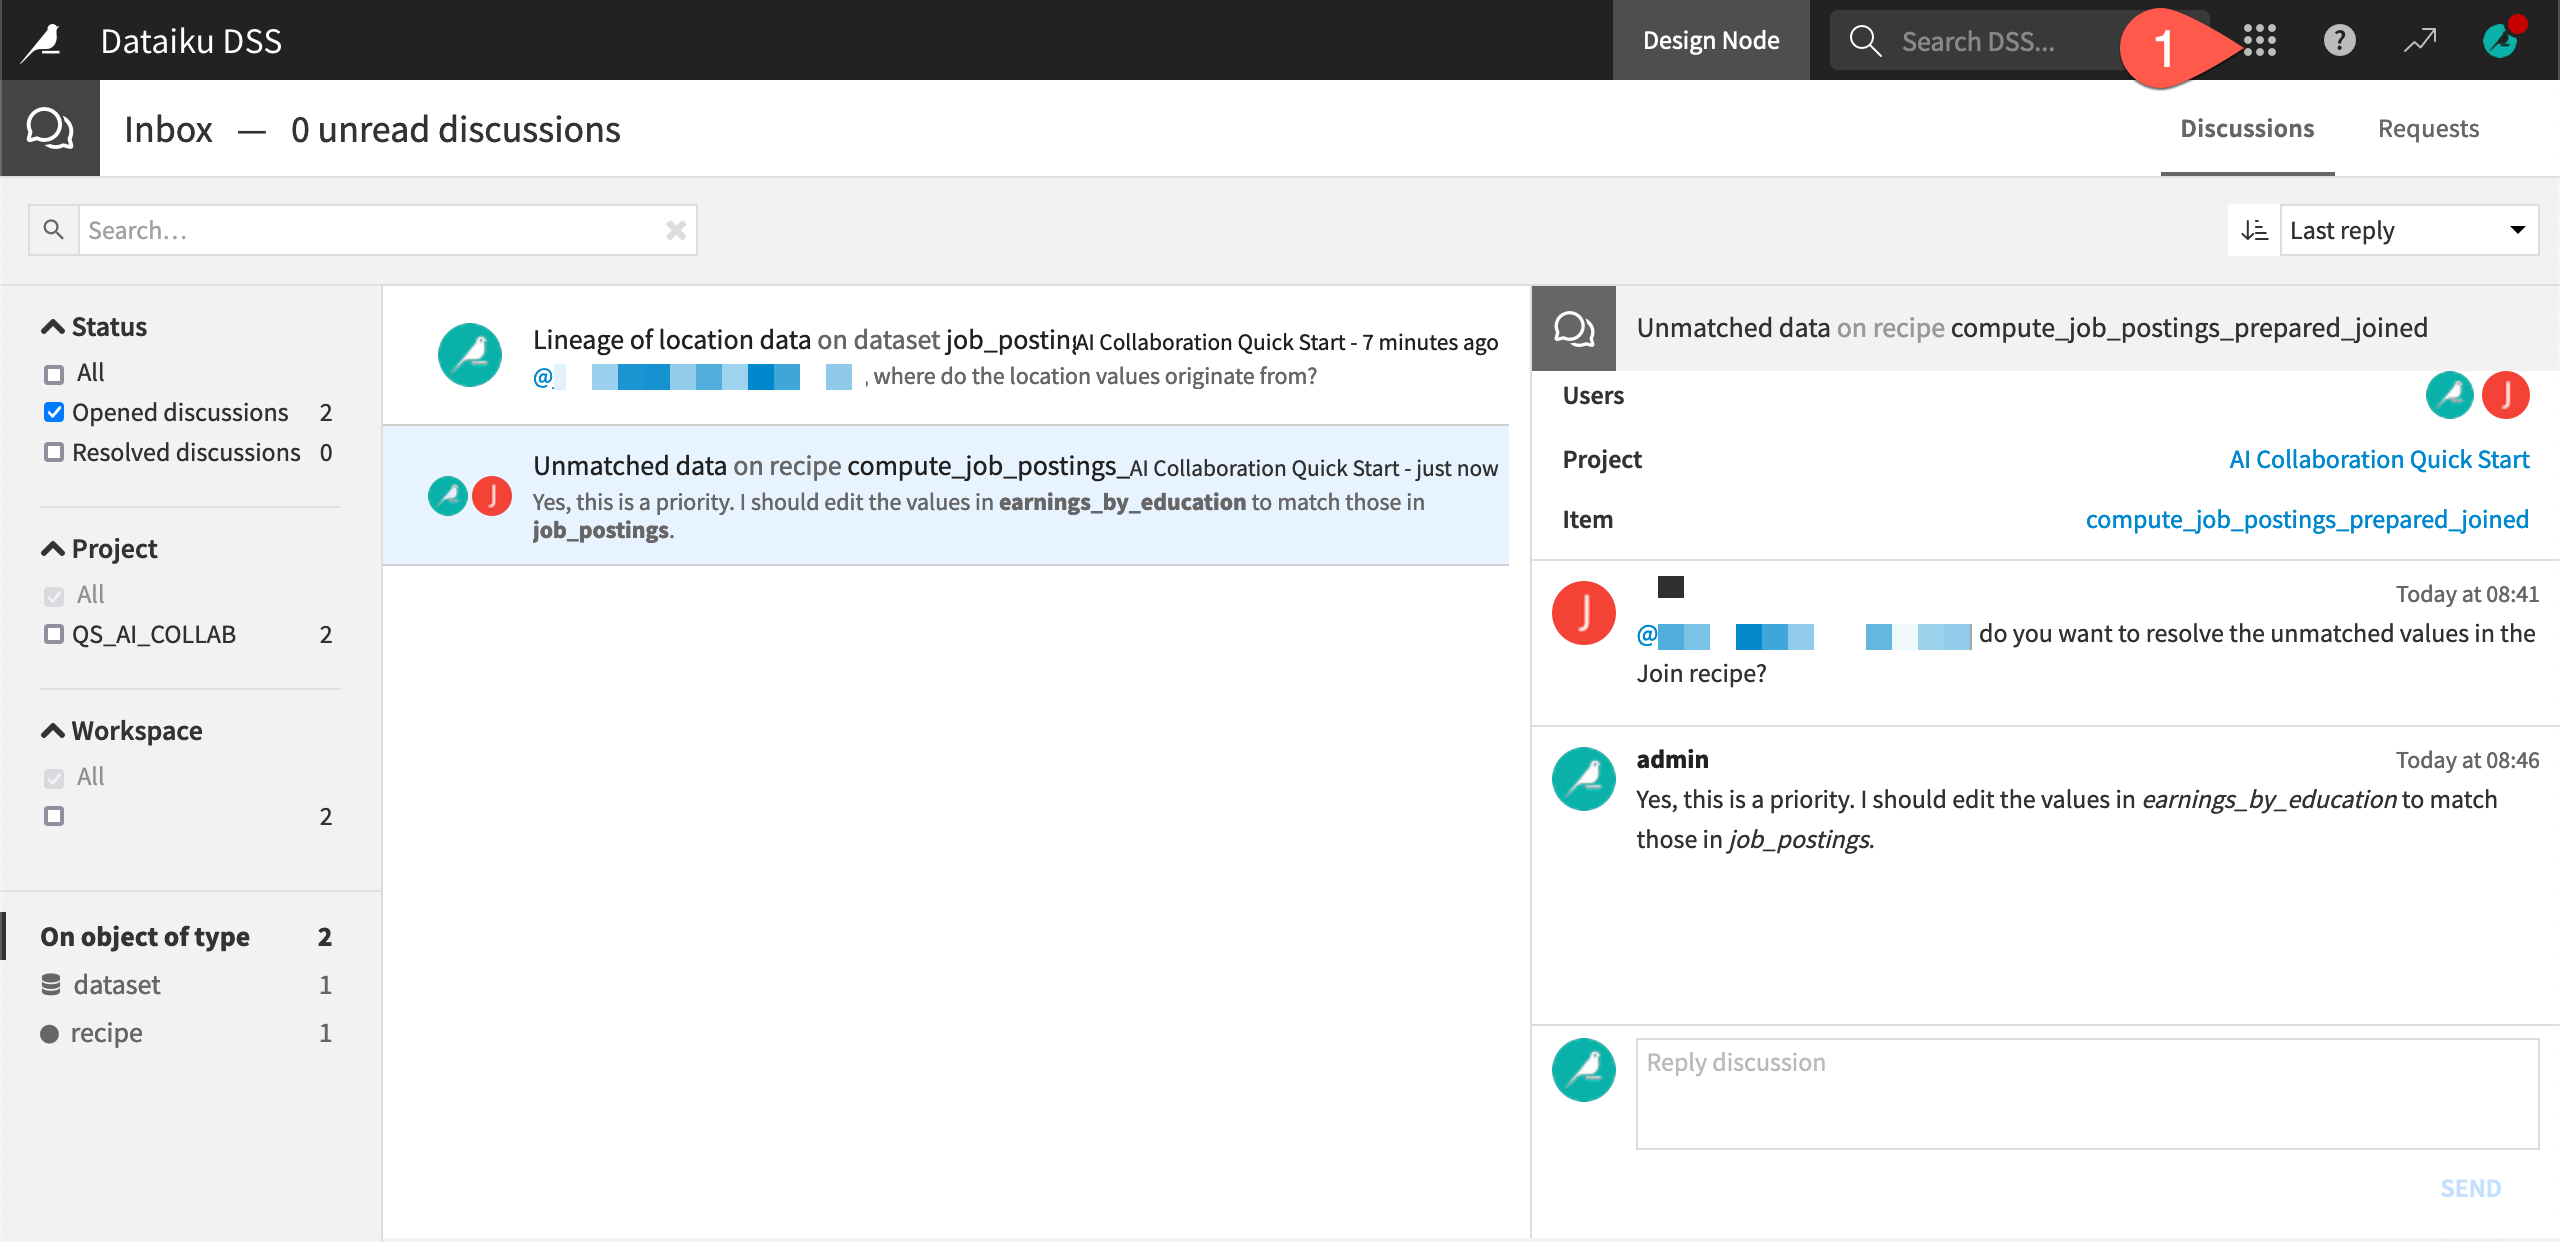
Share insights with a dashboard#
See a screencast covering this section’s steps
Once you start collaborating, you’ll need a way to communicate insights.
Dashboards are a key tool in Dataiku for sharing insights such as charts, webapps, metrics, machine learning model results, etc. They’re particularly well suited for situations where different users on the project may require different levels of permission.
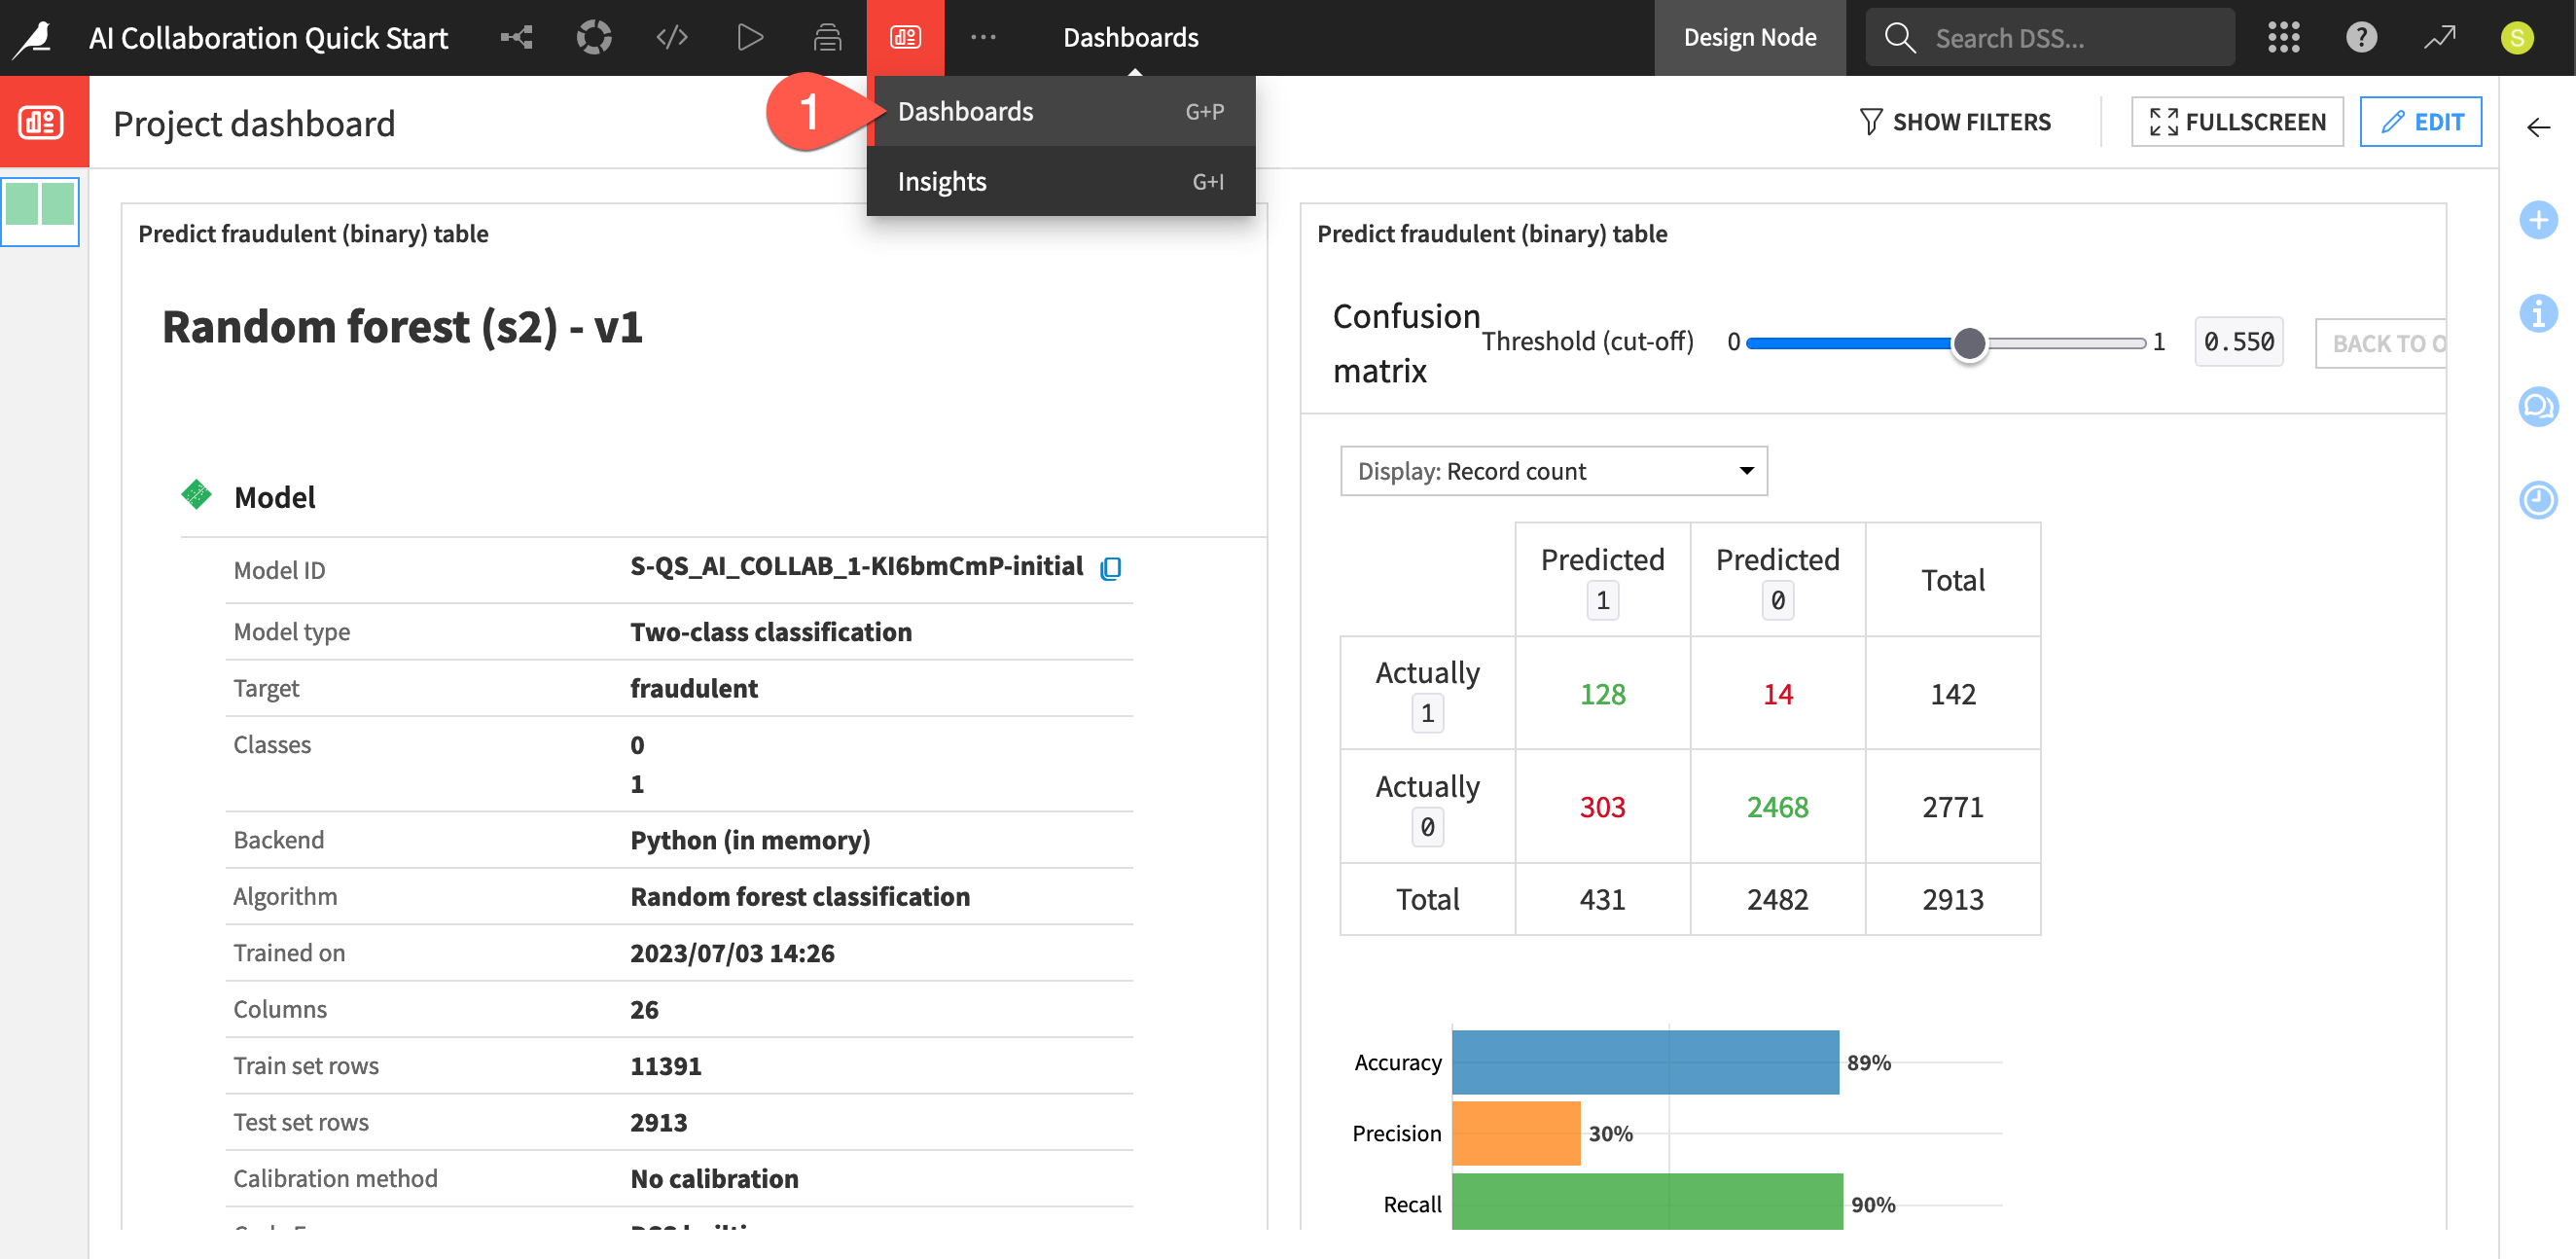
View the project’s dashboard#
Start by exploring the project’s existing dashboard.
From the project’s top navigation bar, go to the Dashboards (
 ) page (or use the keyboard shortcut
 g+p).Click to open the Project dashboard.
Observe the insights about the model found in the project’s Flow.
Create an insight on a dashboard#
Add more information to this dashboard.
Click Edit to make changes.
In the left panel, click the plus (
 ) to add a new page.
Click + New Tile to add to the dashboard.
Choose Chart from the available dashboard tiles.
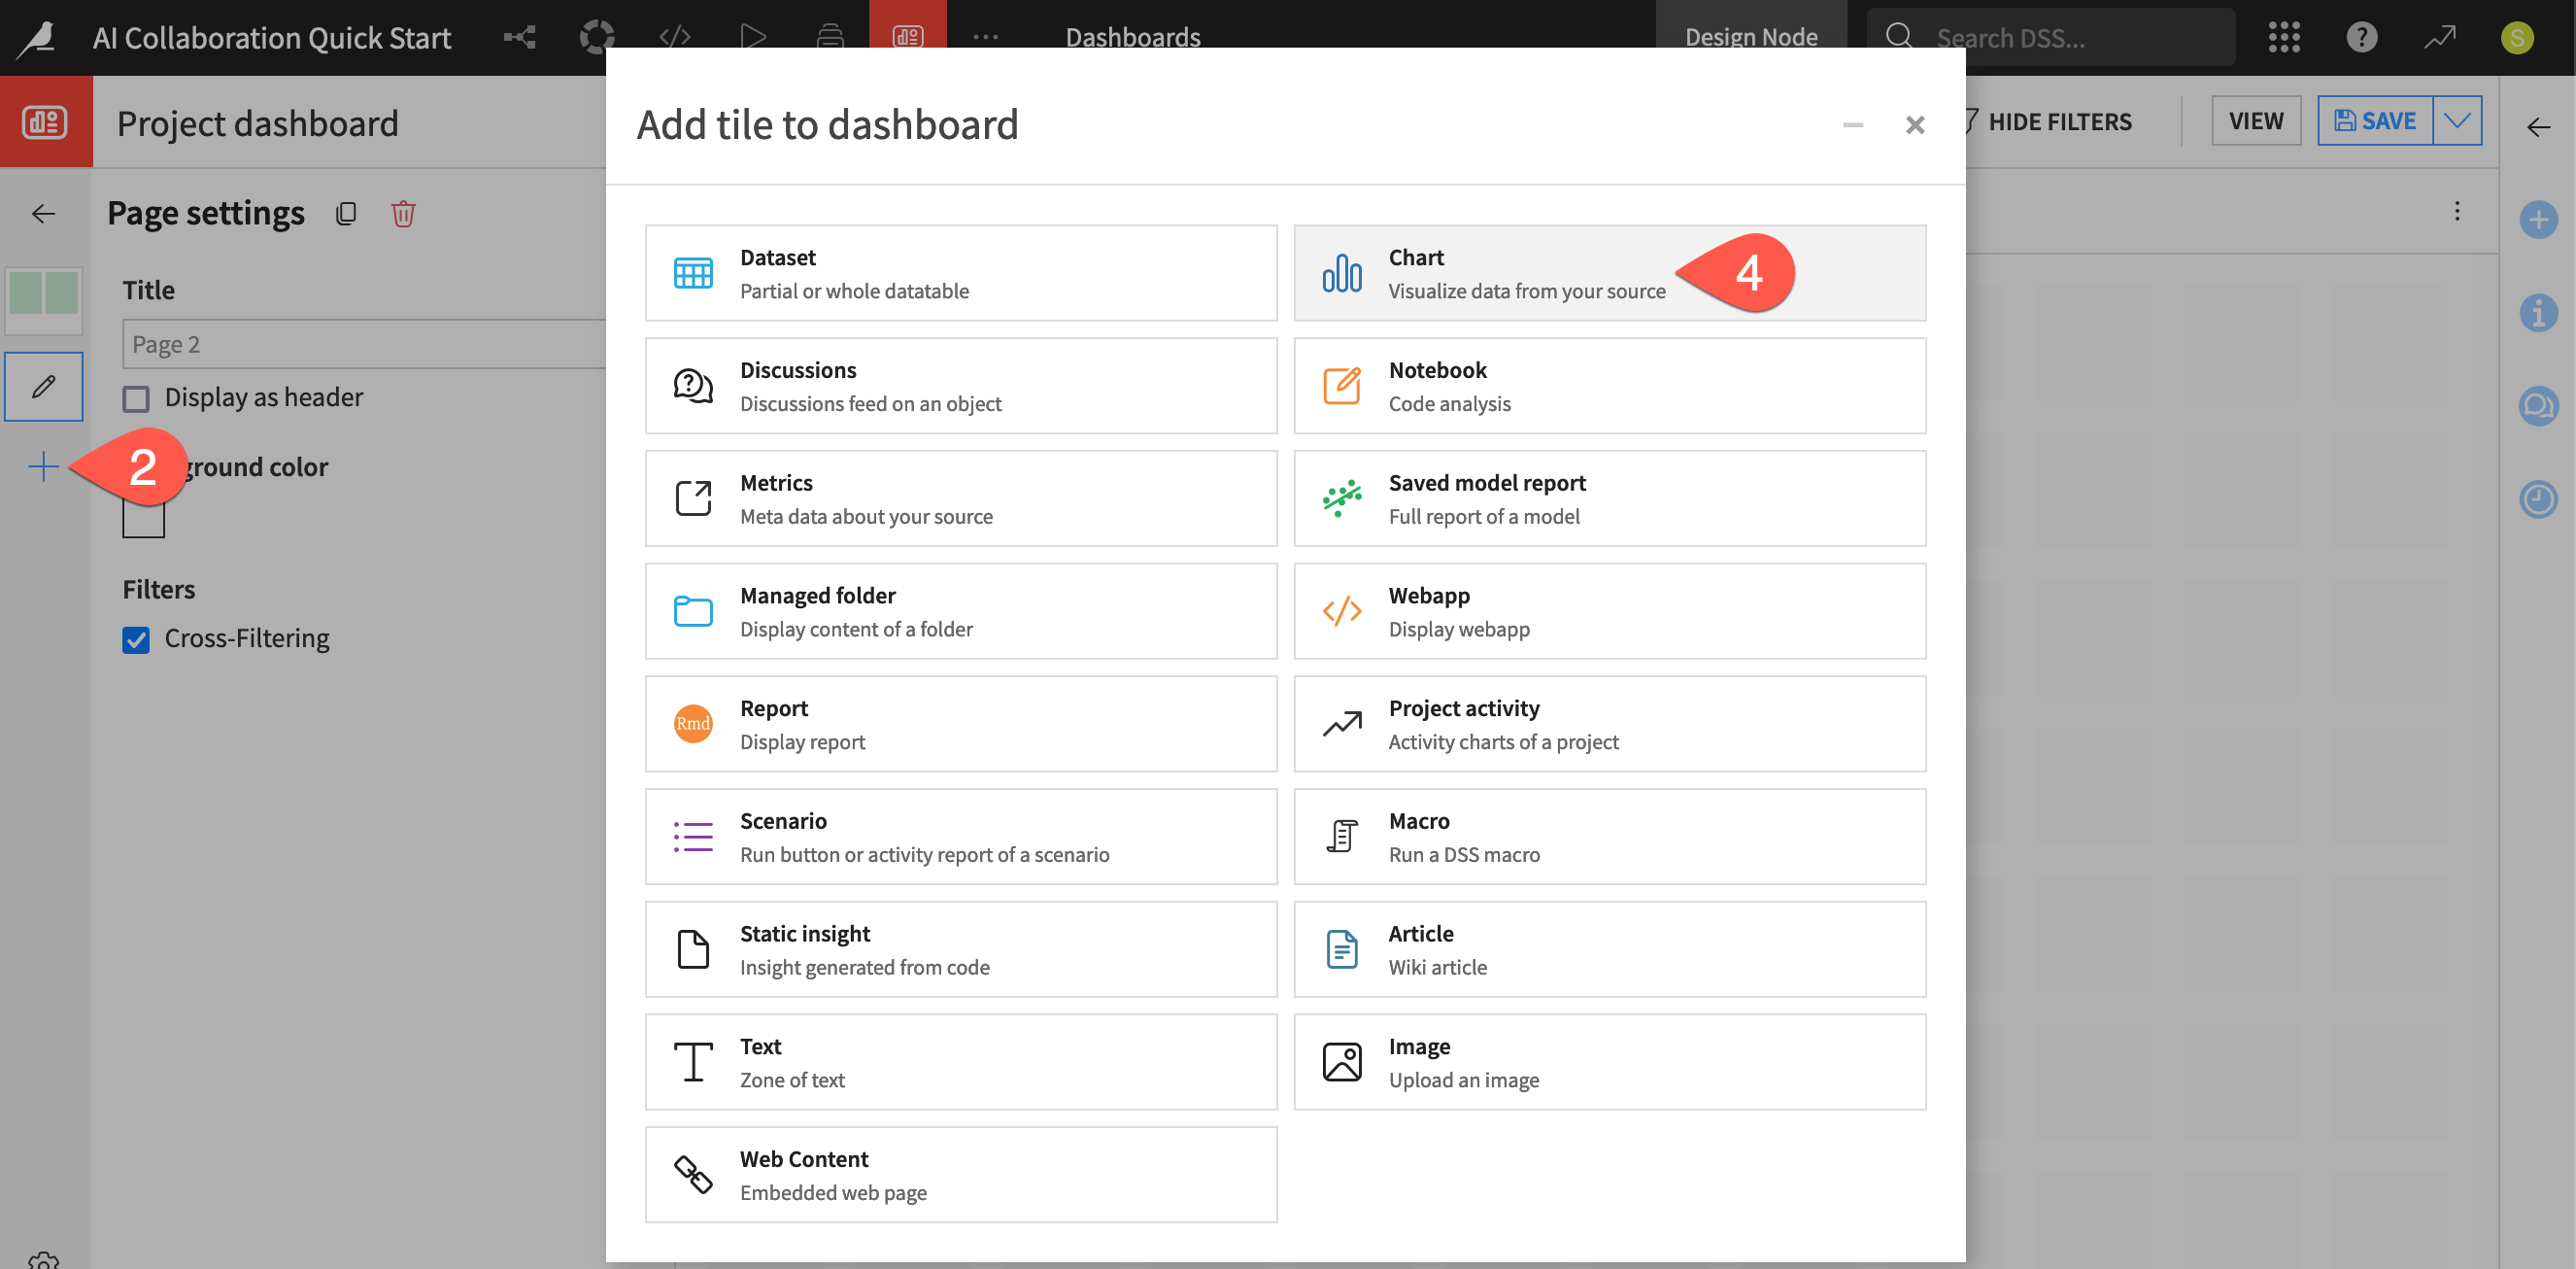
For the source dataset, select job_postings_prepared_joined.
Click Add.
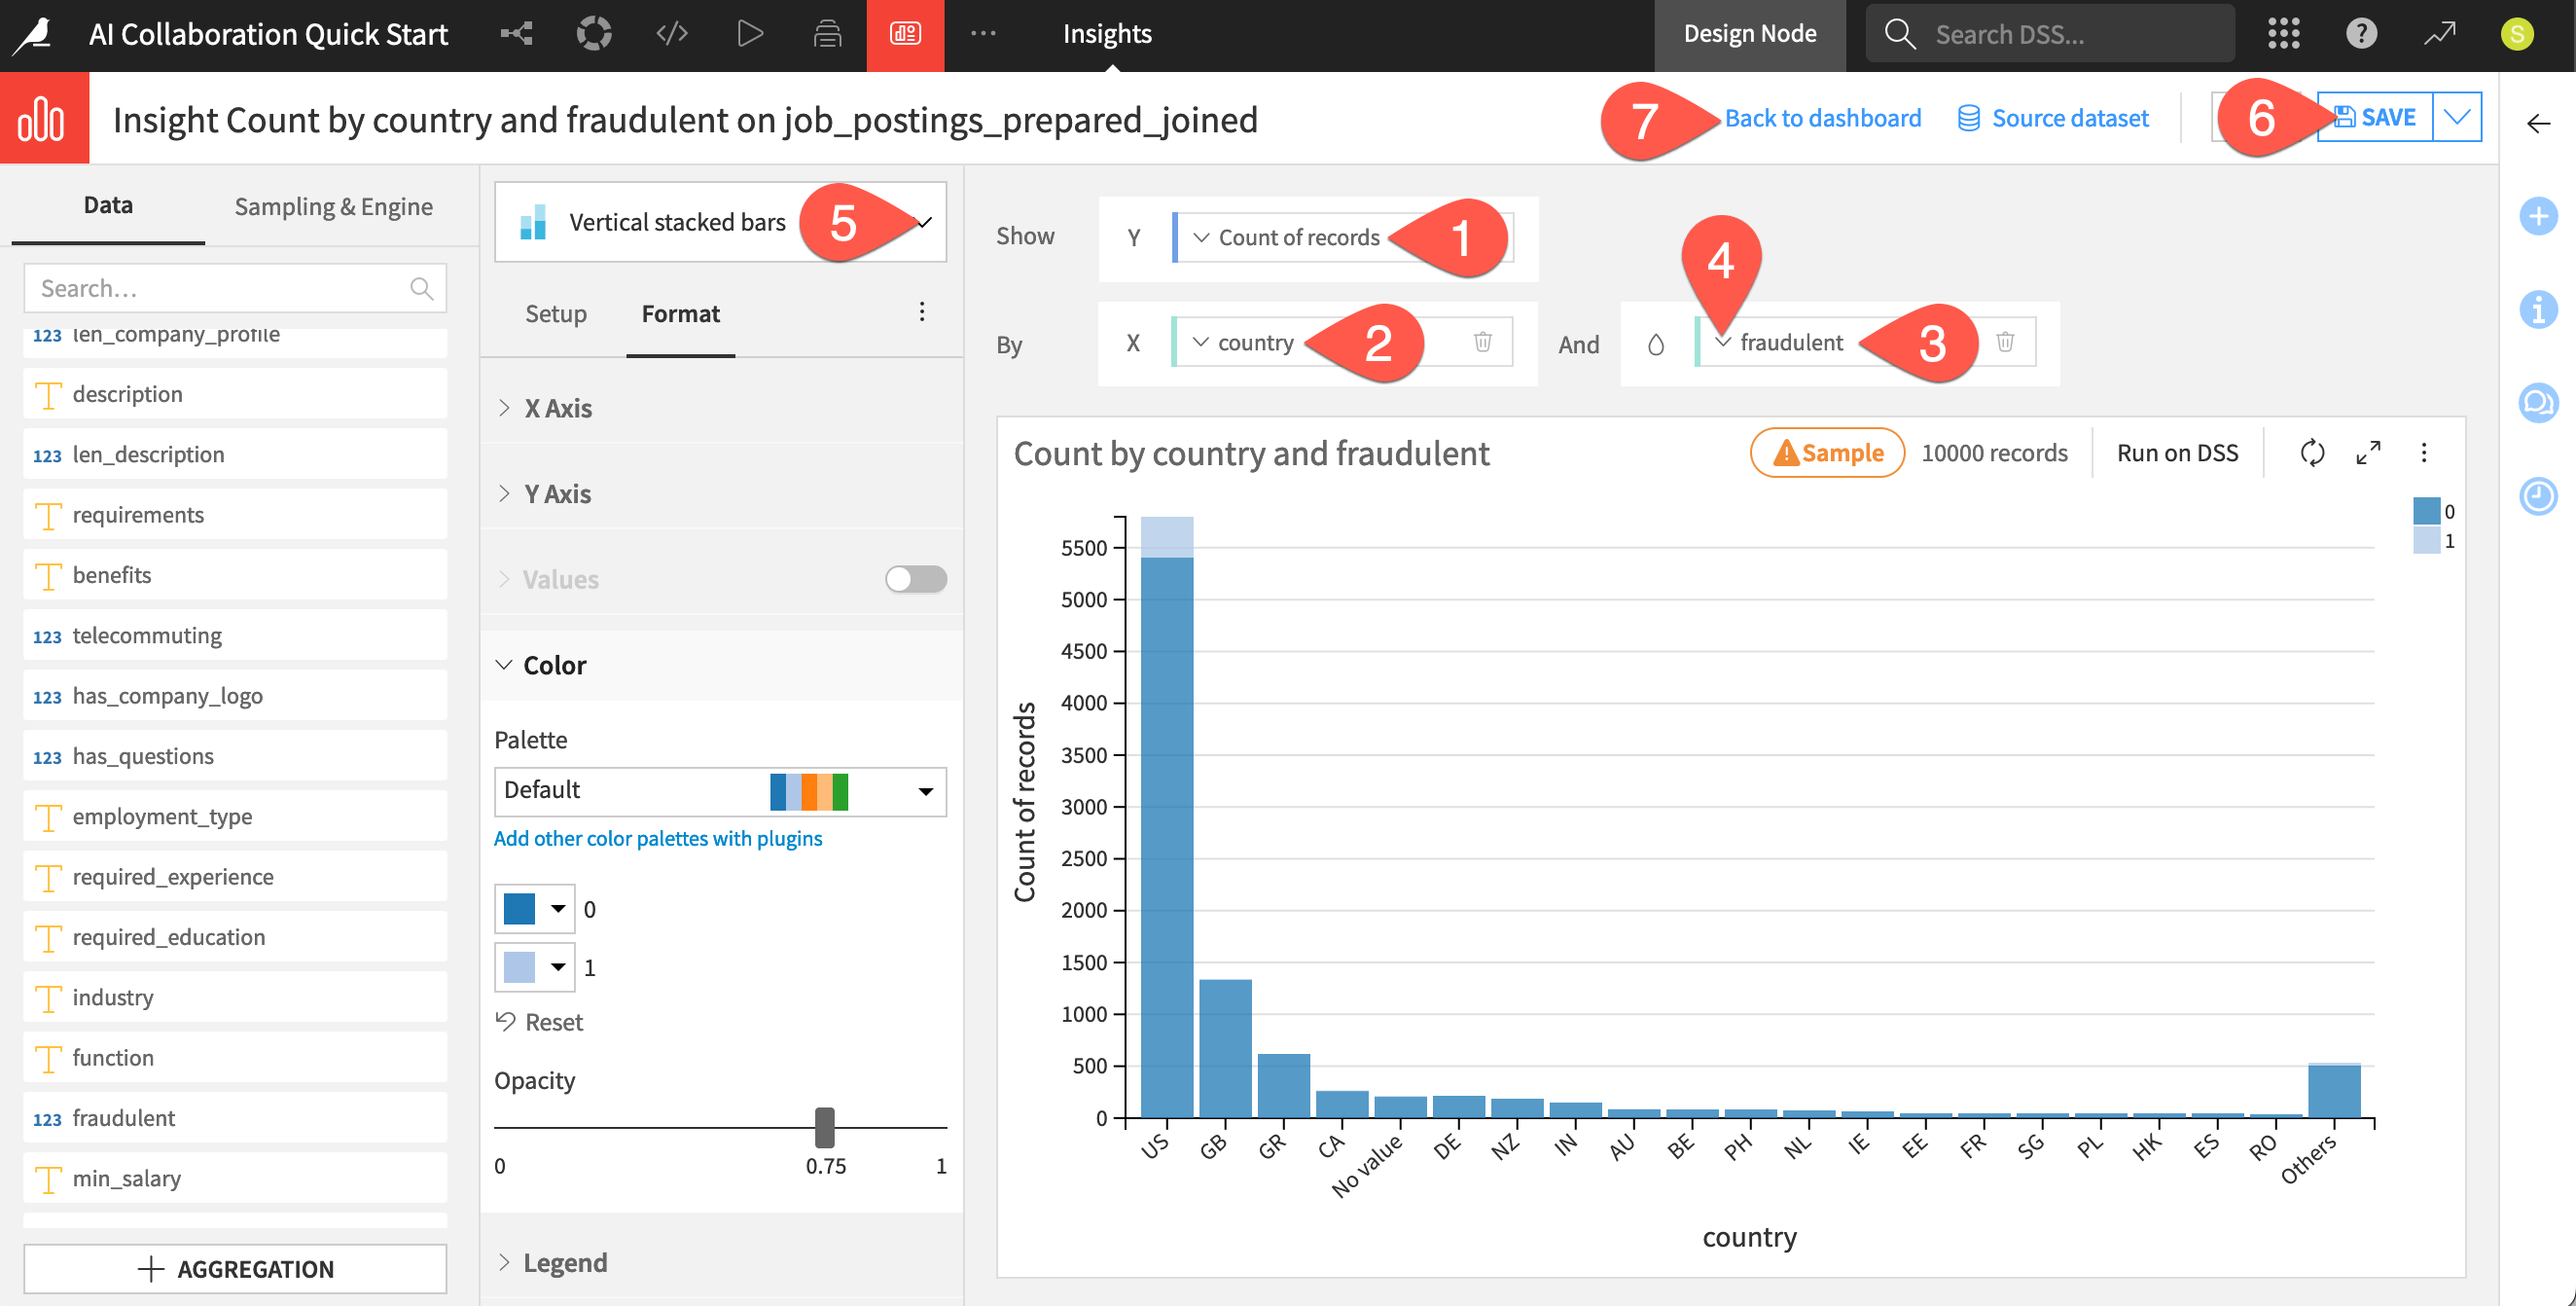
Create a chart insight showing the count of records by country and the target variable fraudulent.
From the available columns, drag Count of records to the Y axis.
Drag country to the X axis.
Drag fraudulent to the color droplet (
 ) field.
Click the vertical dots (
 ) next to fraudulent, and select Grouping (bin) > None, use raw values.
Open the chart picker dropdown, and select Vertical stacked bars.
Click Save (or use the keyboard shortcut
Cmd/Ctrl+S).Click Back to dashboard. You’ll see your new chart there.
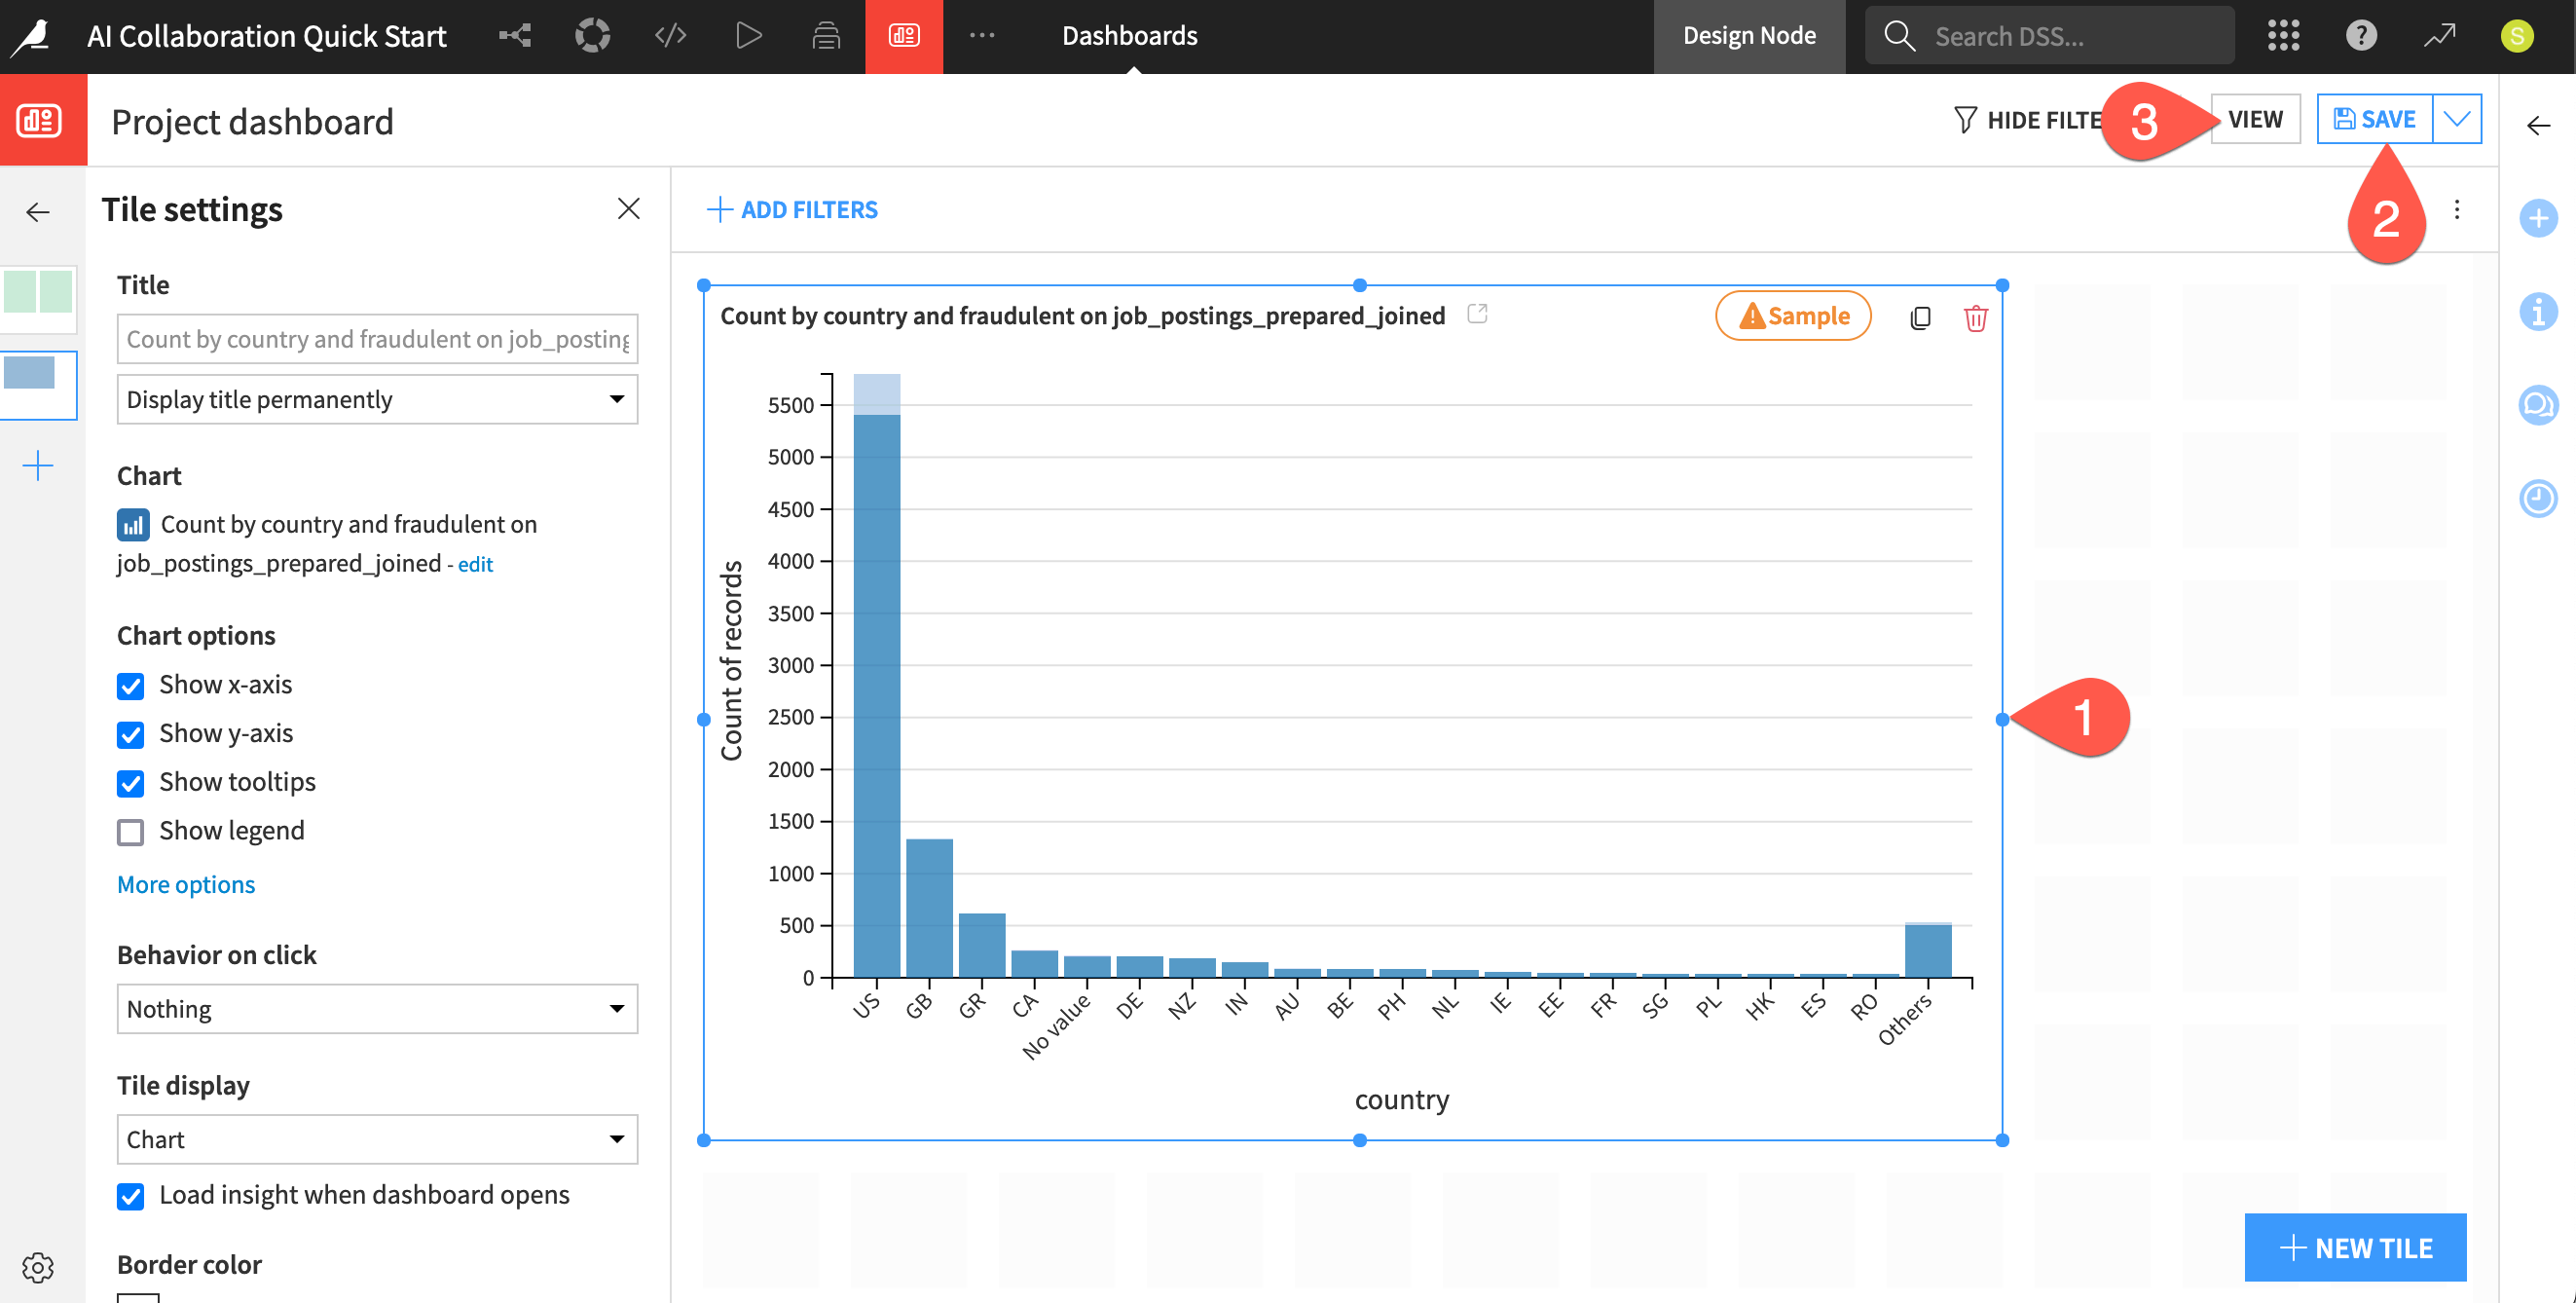
Important
The top of the chart indicates that the current insight is calculated on a sample of the data. Sampling ensures you can work interactively on large datasets. You can adjust this in the Sampling & Engine tab.
Now adjust the size of the insight on the dashboard page.
Click on the chart tile, and drag the corners to a larger size.
Click Save (or use the keyboard shortcut
Cmd/Ctrl+S).Click View to see the current state of the dashboard.
Tip
Feel free to add more tile insights to this dashboard or learn more about dashboards in the Knowledge Base.
Run a colleague’s workload using an automation scenario#
See a screencast covering this section’s steps
In addition to being a place for communicating insights, dashboards can also be a tool to interact with project elements that colleagues have created. For example, a team member may have embedded a webapp on a dashboard. You can use the webapp’s functionality through the dashboard.
Another good example of this pattern is scenarios. In Dataiku, scenarios are a set of actions to run, along with conditions for when they should execute. Although scenarios can trigger automatically based on factors like time or dataset changes, you can also trigger them manually — including from a dashboard.
This could be helpful for tasks such as:
Refresh the Flow with the latest batch of data.
Export objects like dashboards, notebooks, reports, wikis, and other kinds of documentation.
Execute some SQL or Python code.
See also
See the Quick Start | Dataiku for MLOps for a walkthrough of your first scenario.
View a scenario#
As an example, take a look at the scenario in the project.
From the Jobs (
 ) menu in the top navigation bar, select Scenarios.
Click Score Data to open the scenario.
Navigate to the Steps tab.
Click on the steps to see what actions will run when the scenario is triggered.
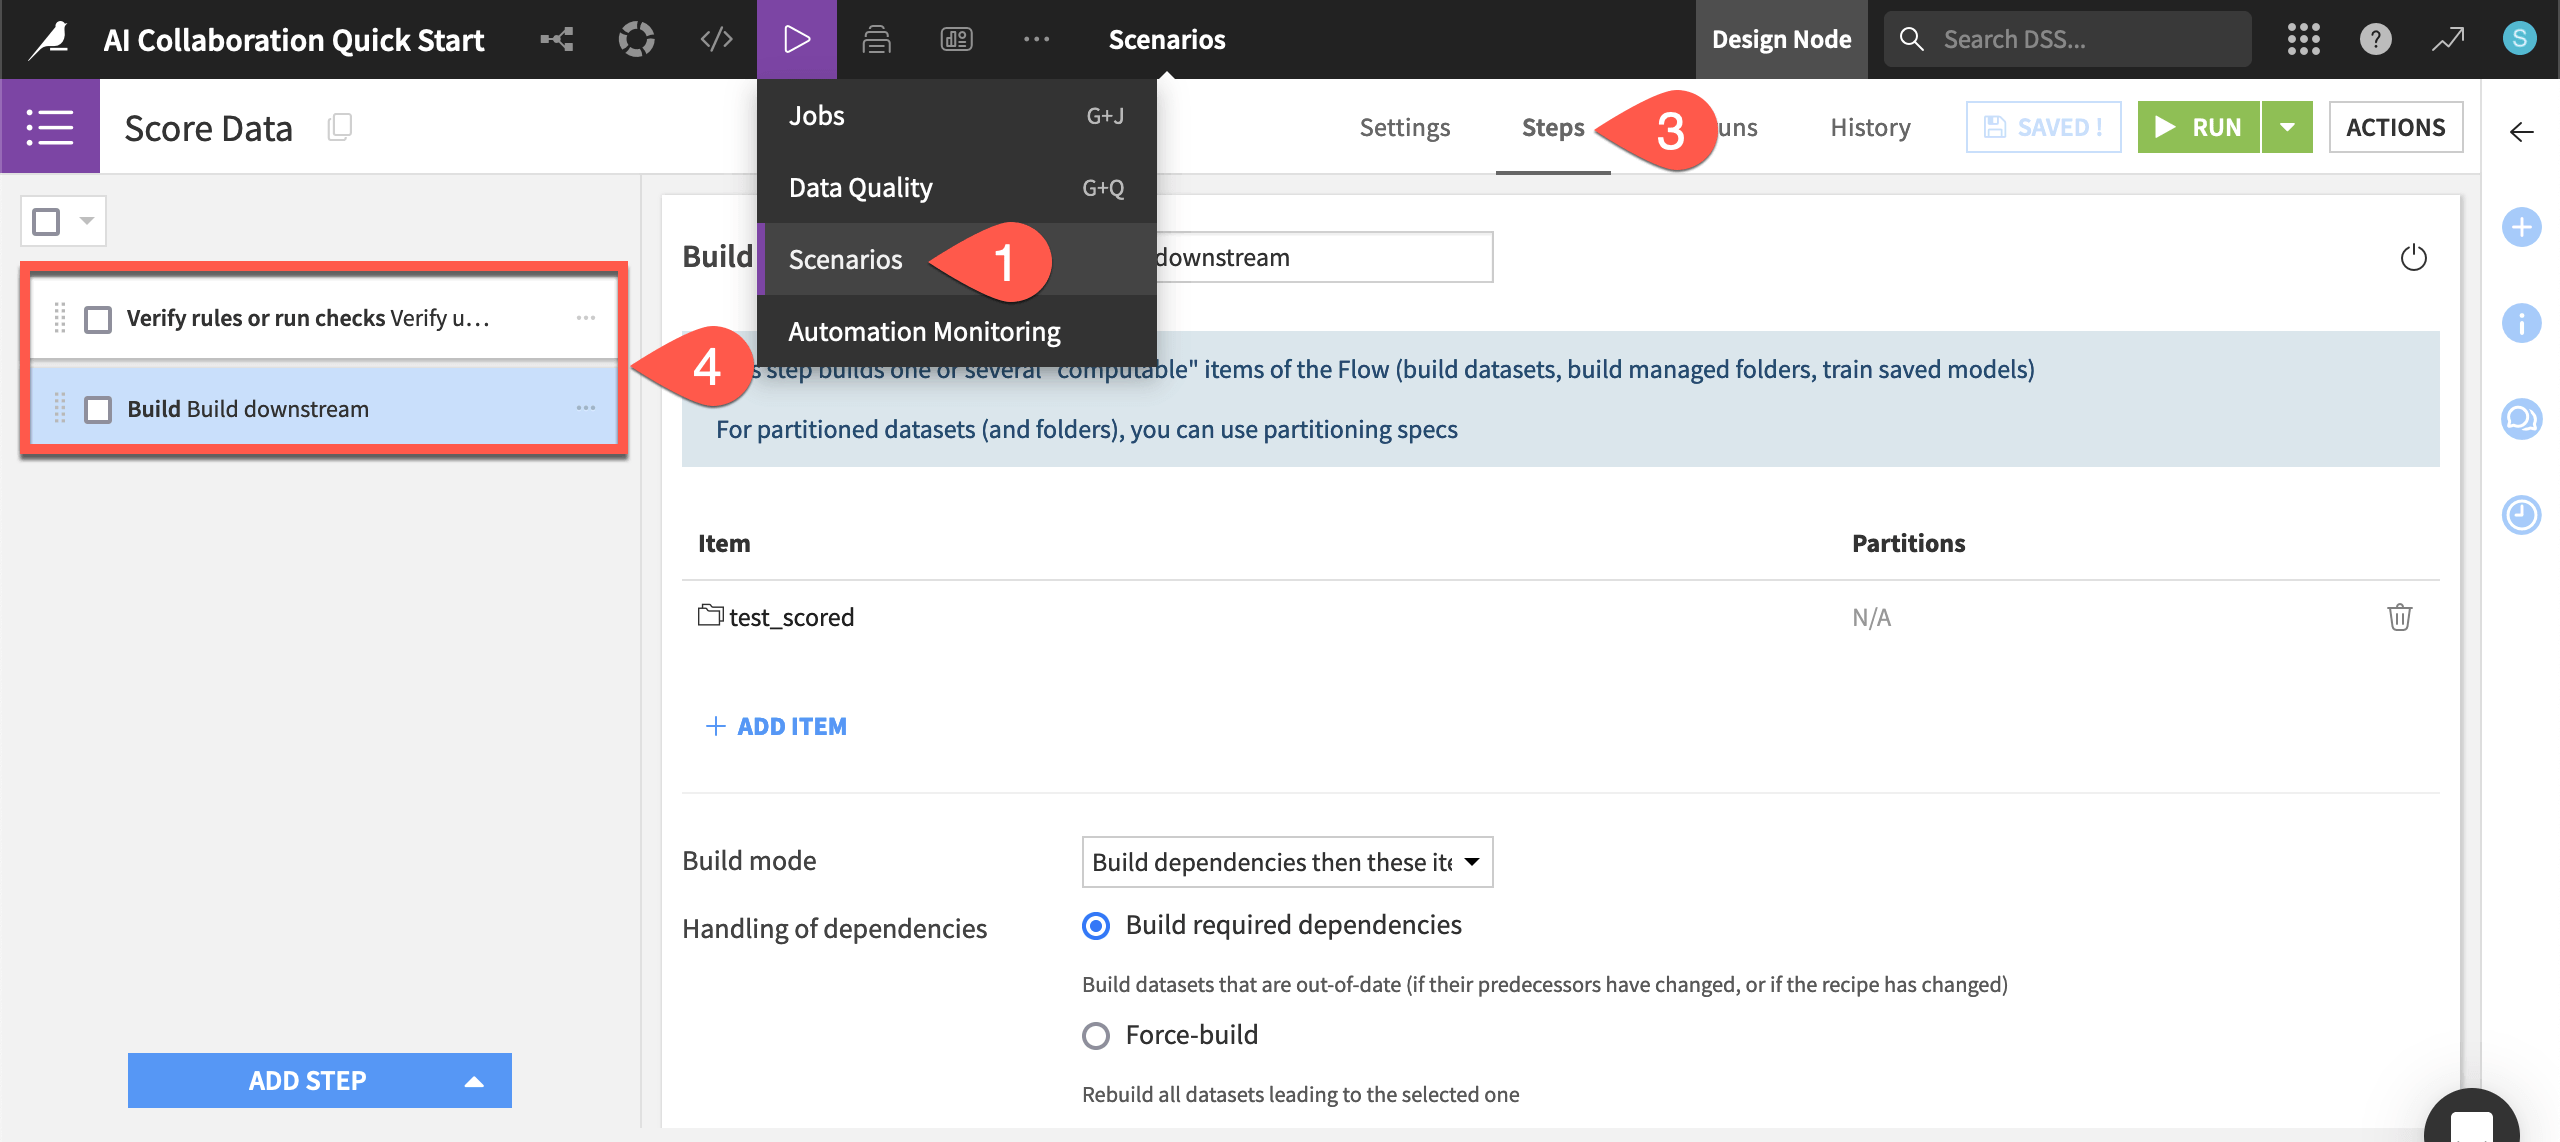
Tip
Depending on your role, you may only need to run scenarios that colleagues have created. However, this one has only a few steps. If the data quality rules on the upstream job_postings_prepared dataset pass verification, then the scenario rebuilds the furthest downstream test_scored dataset.
Add a scenario tile to a dashboard#
To have a convenient way of triggering a scenario, the project’s creator can add a tile for the scenario to a dashboard page.
Navigate back to the Project dashboard (
g+p).Click Edit.
Go to Page 2.
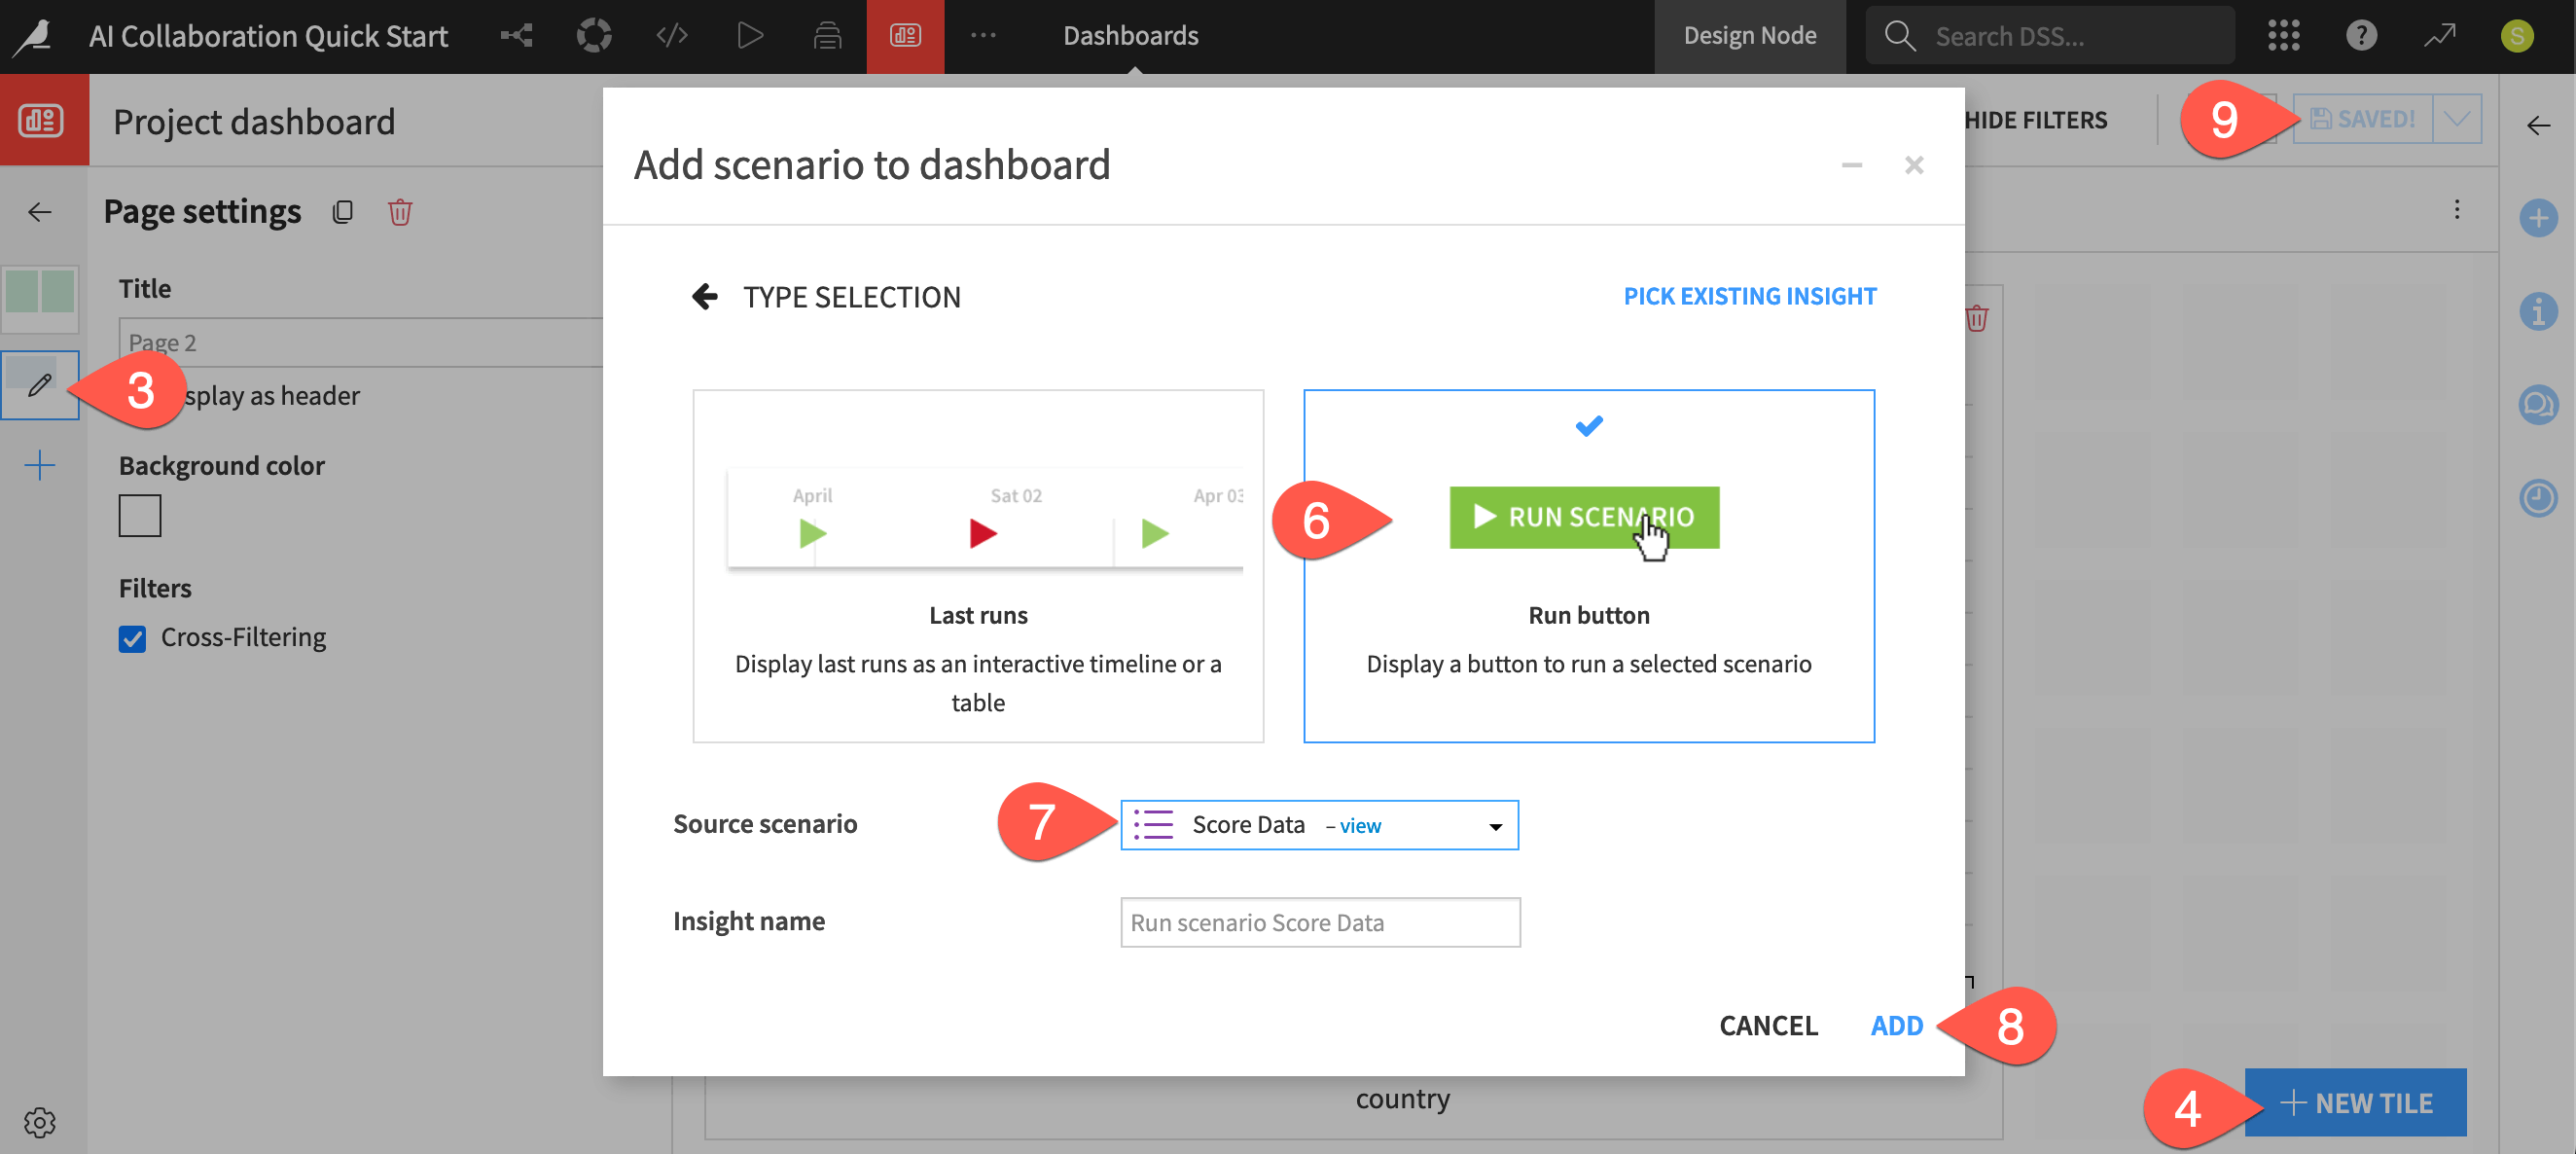
Click + New Tile.
Choose Scenario.
In the dialog, choose the Run button option.
For the Source scenario, select Score Data.
Click Add.
Adjust the size of the tile by dragging the corners, and click Save (
Cmd/Ctrl+S).
Run a scenario from a dashboard#
Now trigger the scenario!
Click View from the dashboard header.
Click Run Now to trigger the Score Data scenario.
Click Logs on the pop-up notification or, beginning from the top navigation bar, go to the Jobs (
) menu > Scenarios > Score Data > Last runs.Click on the job log for the build step to view the output.
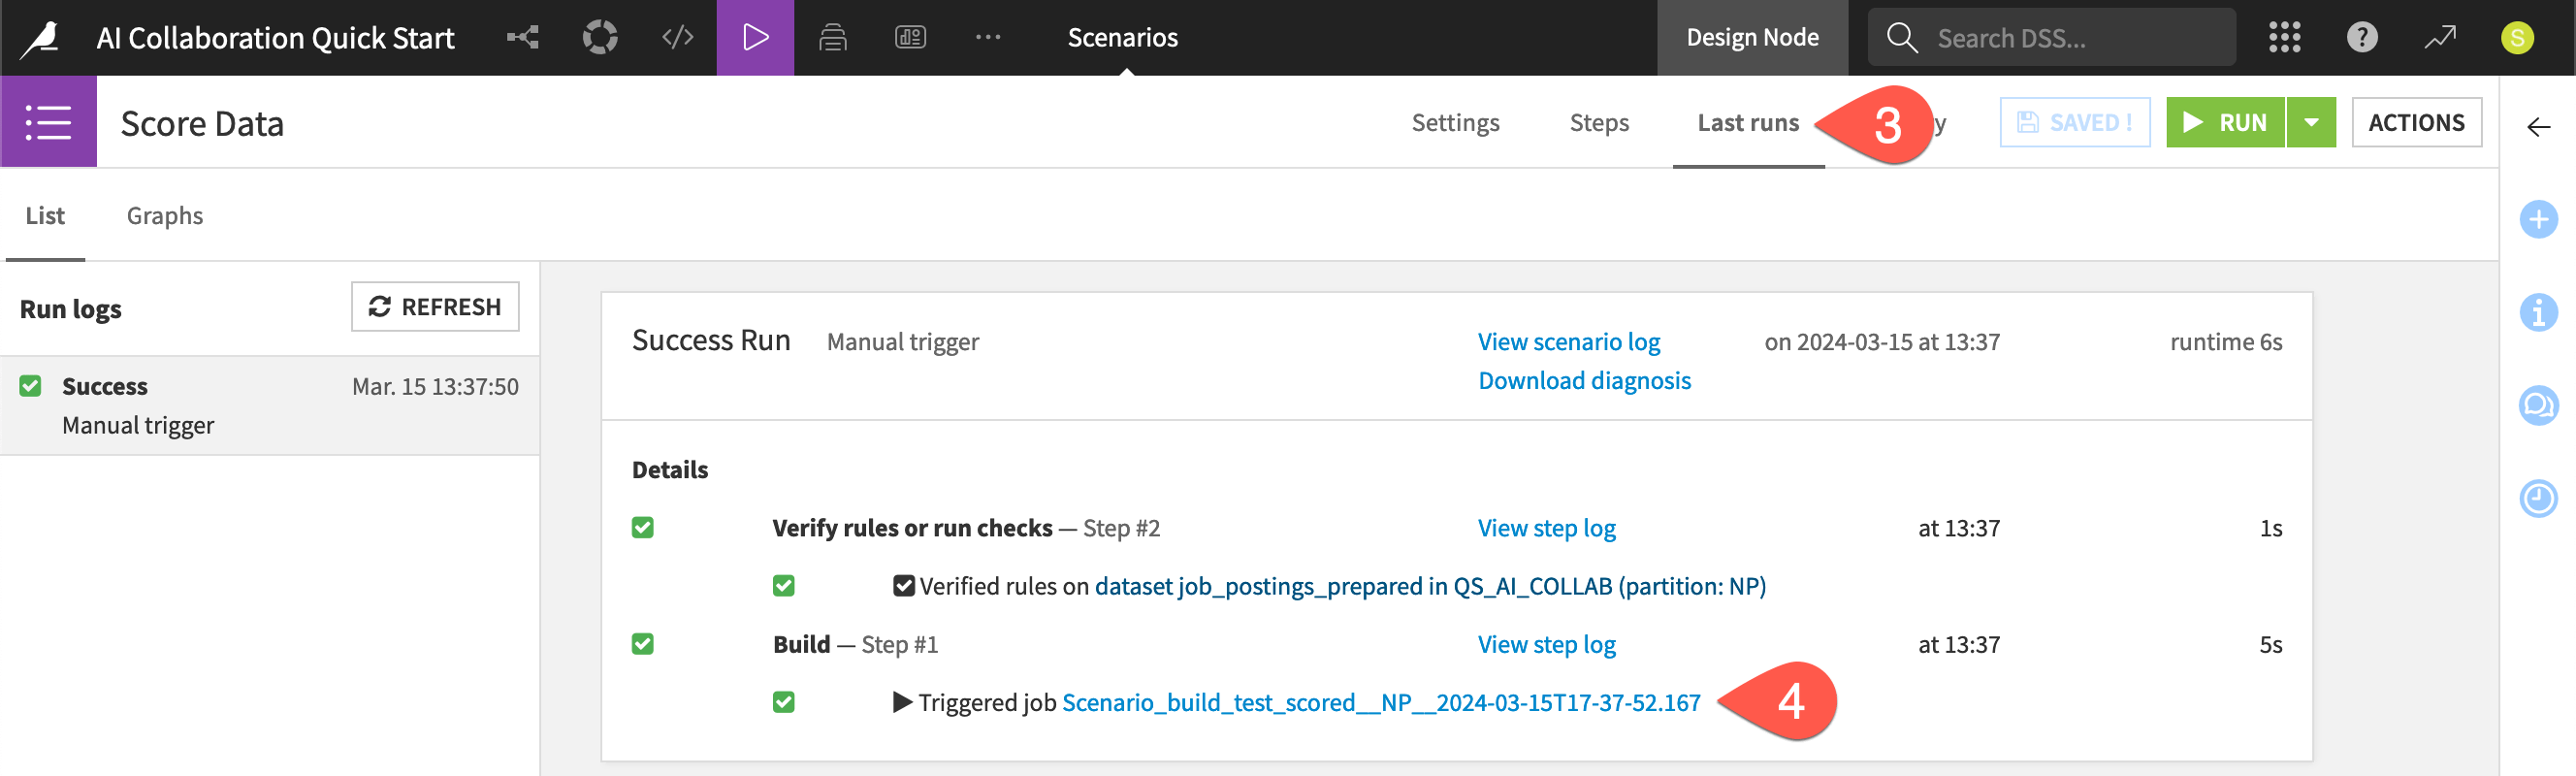
Tip
Can you see why there was “nothing to do” for the build step? The short answer is build modes! Contrast this outcome with what happens when completing the next section!
Run a colleague’s workload using a Dataiku app#
See a screencast covering this section’s steps
Having a scenario run button on a dashboard simplifies the complexity for end users. But for many situations, end users may not even need access to the original project!
Dataiku apps enable builders to package a project as a reusable app. Builders can then share this app with an audience of end users, such as business analysts. These end users can create their own instances of the app, and use it to complete their tasks without ever seeing the original project.
Your project already has been packaged as a Dataiku app. This app allows users to upload a dataset, apply the model to the uploaded data, and download the predictions — using the same scenario you ran above.
View the Dataiku app designer#
Typically, as an end user of a Dataiku app, you won’t need to see the originating project. However, in this case, you can take a look.
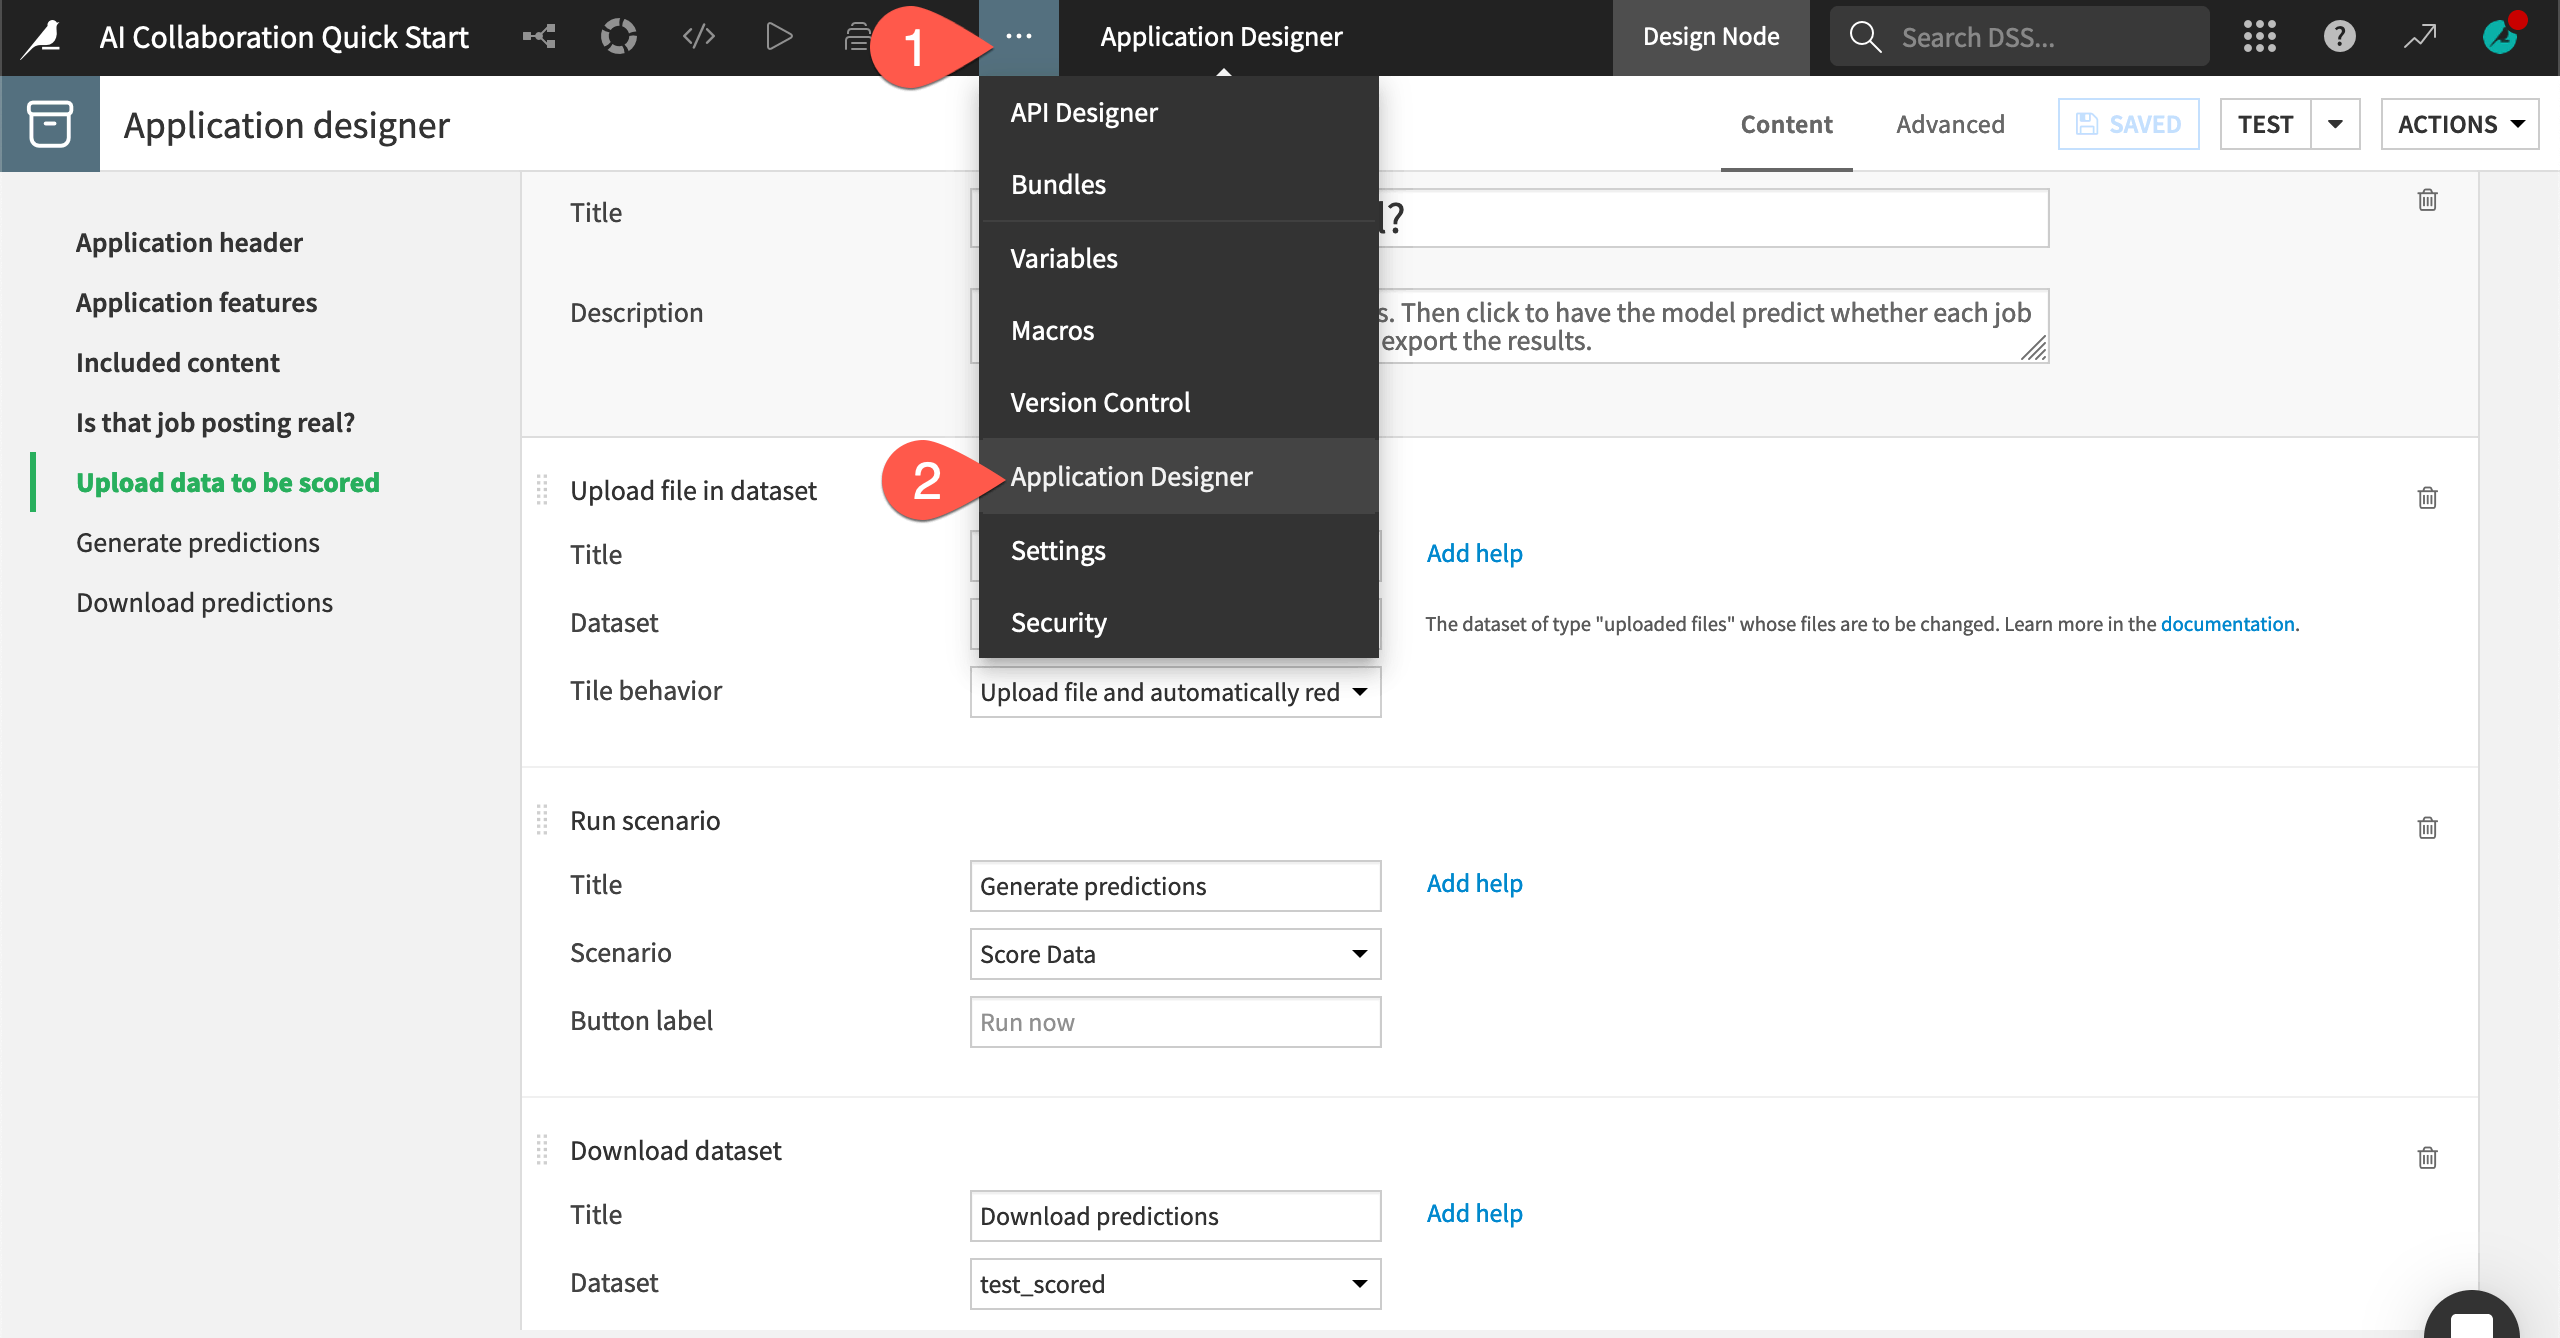
From the top navigation bar, navigate to the More Options (
) menu.Choose Application Designer.
Scroll through the app, and try to understand how you can use it.
Create an instance of a Dataiku app#
Similar to creating your own copy of the starter project for this tutorial, you need to create your own copy (or instance) of the Dataiku app.
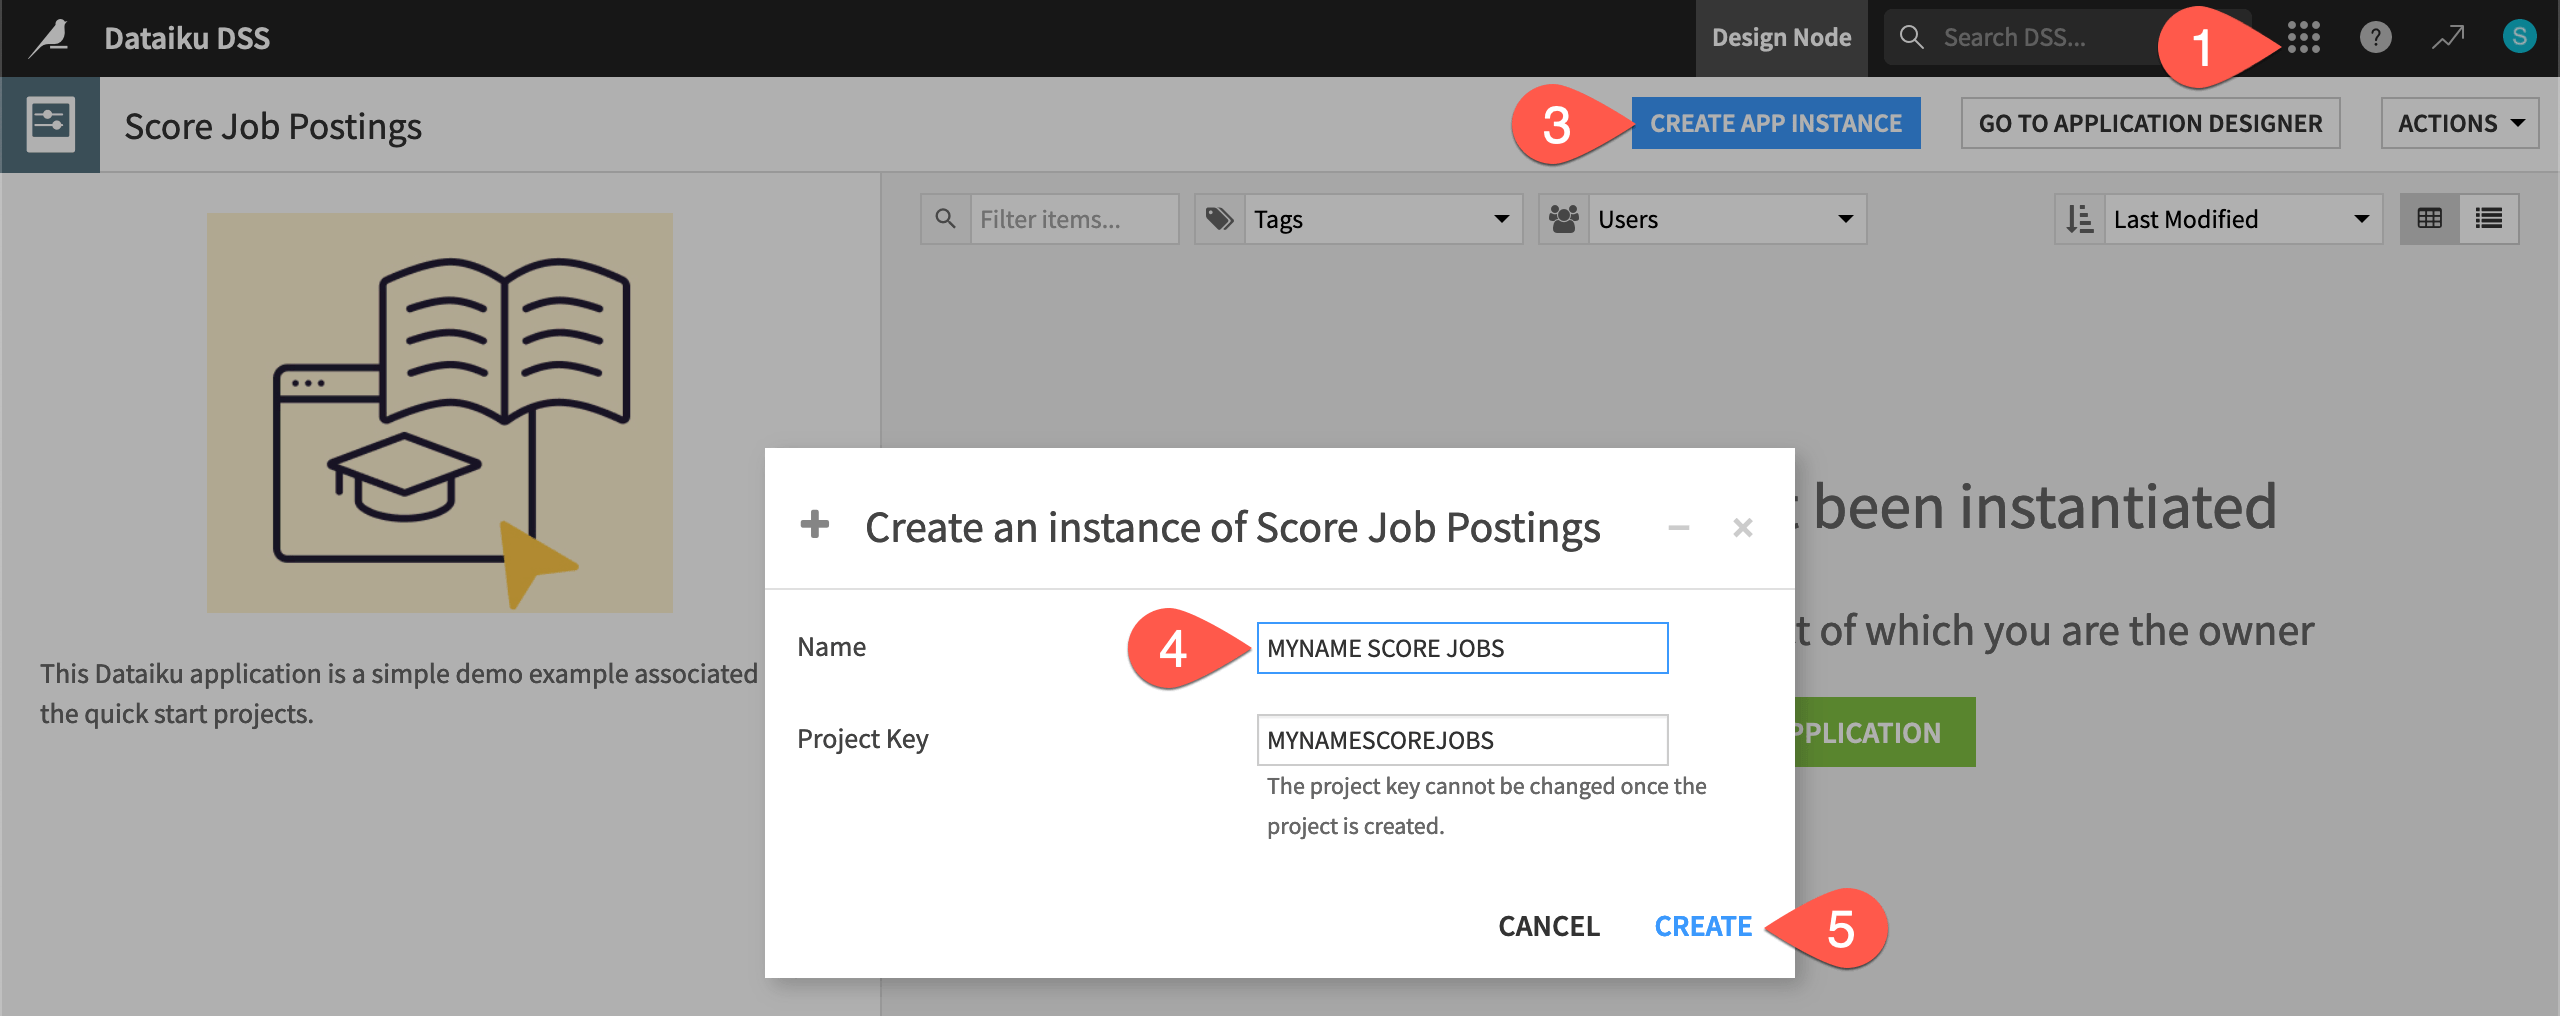
From the top navigation bar, open the waffle (
) menu, and select Dataiku Apps.Search for and select the Score Job Postings app.
Click Create App Instance.
Give it a unique name, such as
MYNAME SCORE JOBS.Click Create.
Use a Dataiku app#
The first field asks you to upload a dataset for the model to score. For this example, use an export of the original job_postings dataset, but filtered for jobs in New Zealand.
Download the nz_job_postings.csv file.
Once you have a file to upload, you can use the app to produce a batch of model predictions.
In the Upload data to be scored tile of your Dataiku app instance, click Add a File, and select the nz_job_postings.csv file.
In the Generate predictions tile, click Run Now.
When the run finishes, in the Download predictions tile, click Download.
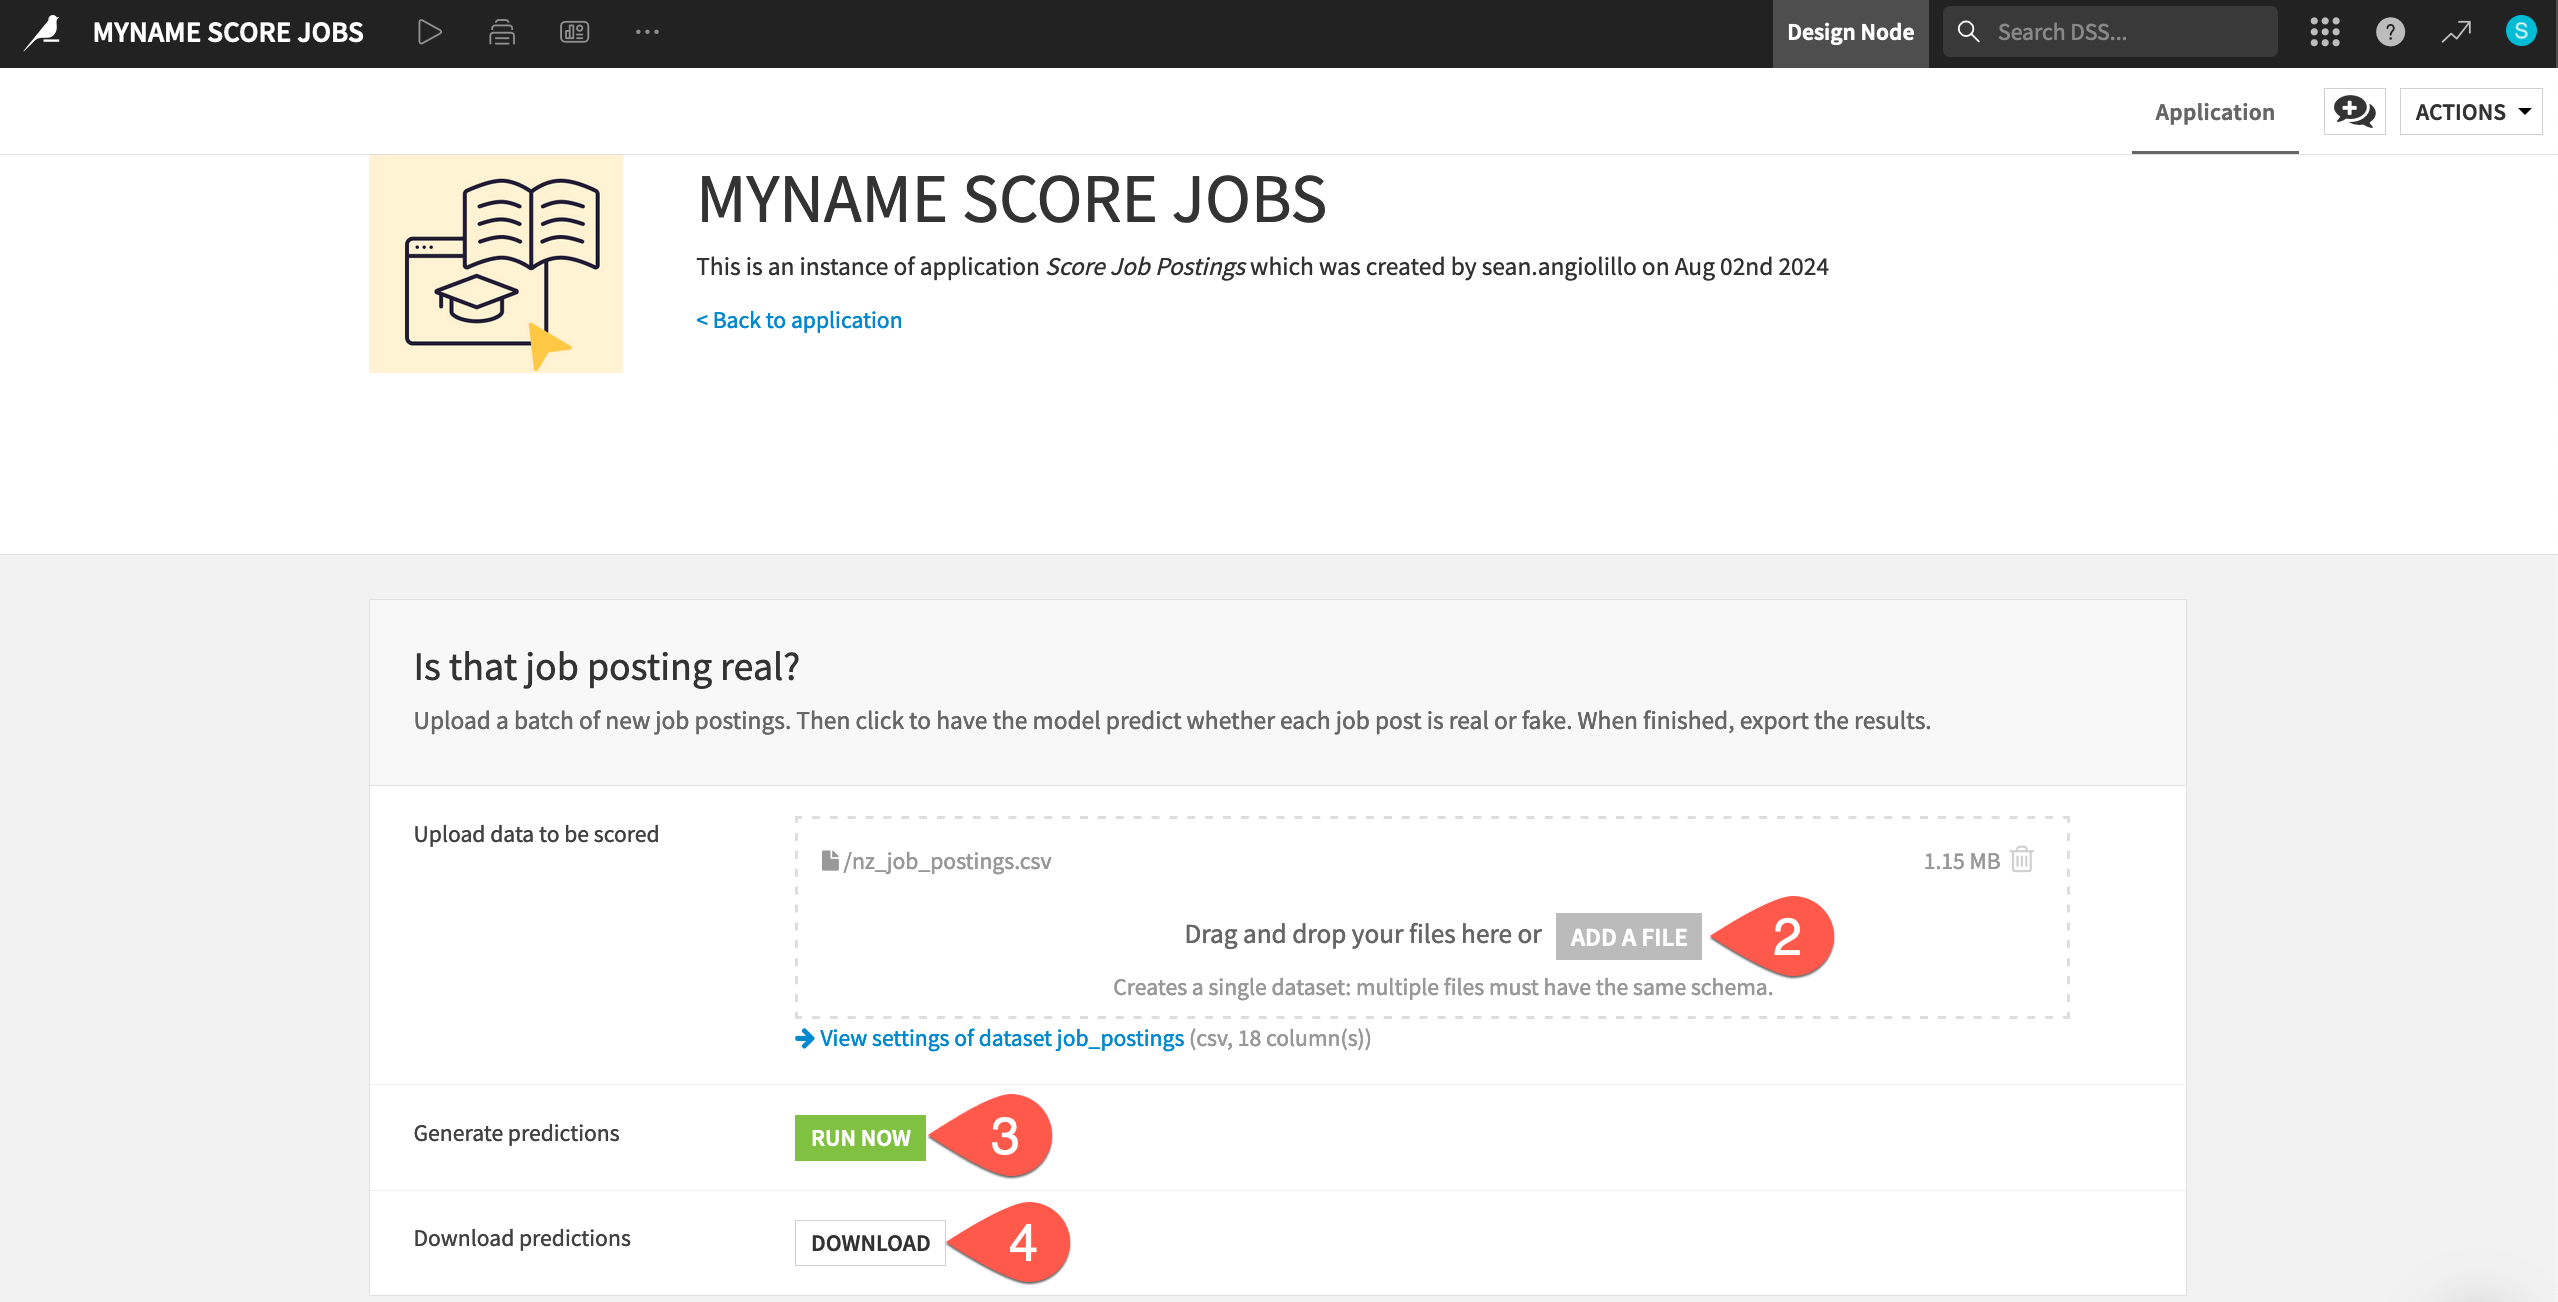
Without ever seeing the original project, clicking Run Now triggered the same Score Data scenario that you ran from the dashboard in the previous section. This time, however, Dataiku detected a new upstream dataset in place of the job_postings dataset. Therefore, the scenario had actual work to do!
Tip
Import the file you downloaded into Dataiku or any other data tool. Confirm that it’s indeed the same as the test_scored dataset found in the Flow — but including only results from New Zealand!
Next steps#
Congratulations! You’ve taken your first steps toward AI collaboration with Dataiku.
If you are interested in learning more about Designer capabilities, please see the other task-based quick starts.
See also
You can also find more Dataiku resources in the following spaces: