Model fairness metrics#
Let’s learn about RAI during the model building and predictive analytics stage. This section will teach you how to design a model with group fairness in mind.
Note
This tutorial specifically measures fairness of supervised classification models. Fairness testing differs for regression models or continuous outcomes.
Fairness metrics#
Let’s continue with our churn use case. When a churn prediction determines if a customer is eligible to receive some kind of promotional pricing, there is a potential to cause a harm of allocation. With this in mind, we have to decide which group fairness metric is best to optimize to avoid causing this harm.
Say we want to minimize errors and maximize performance across all subgroups of our sensitive attribute Age. We can compare this goal against a breakdown of the four main fairness metrics and what their measures mean in our specific context. If churn is a “positive” prediction, then:
Demographic Parity: The percentage of all predicted churn cases is the same across all age groups.
Predictive Rate Parity: The percentage of churn cases predicted accurately out of all predicted churn cases is close to 100 across age groups.
Equality of Opportunity: The percentage of churn cases predicted accurately (or true positives) is equal across age groups.
Equalized Odds: The percentage of churn cases predicted accurately (or true positives) and the churn cases predicted wrongly (false positives) is equal across age groups.
Each of these metrics promotes a different fairness and business goal. For instance, if we prioritize Demographic Parity, we might build a model that has a high churn prediction rate across all age groups, even if those predictions are inaccurate. In this case, we’ll have to be okay with recommending promotional pricing to customers who might not churn, resulting in a loss to the business.
Alternatively, prioritizing Equalized Odds would ensure that we build the model to do a good job predicting true churn and minimizing false positives evenly across the different age groups.
We could also optimize for Equality of Opportunity to focus on the recall of a model, making sure the model doesn’t miss true churn cases at a higher rate for the sensitive age group.
Think about which of these metrics would make the most sense from a business and fairness perspective. In your own organization, is it more important to minimize false positives (or negatives) or accurately capture as many true instances as possible? Before moving to the next section:
Determine which metric you think is best for this use case.
Go to the project wiki and make a new article called
Model Experimentation.Document your choice of metric and reasoning in this article.
Return to the Flow.
Model fairness report#
To understand how we can measure model fairness with Dataiku, we will first train a baseline model without changing any parameters. (This will be our control.)
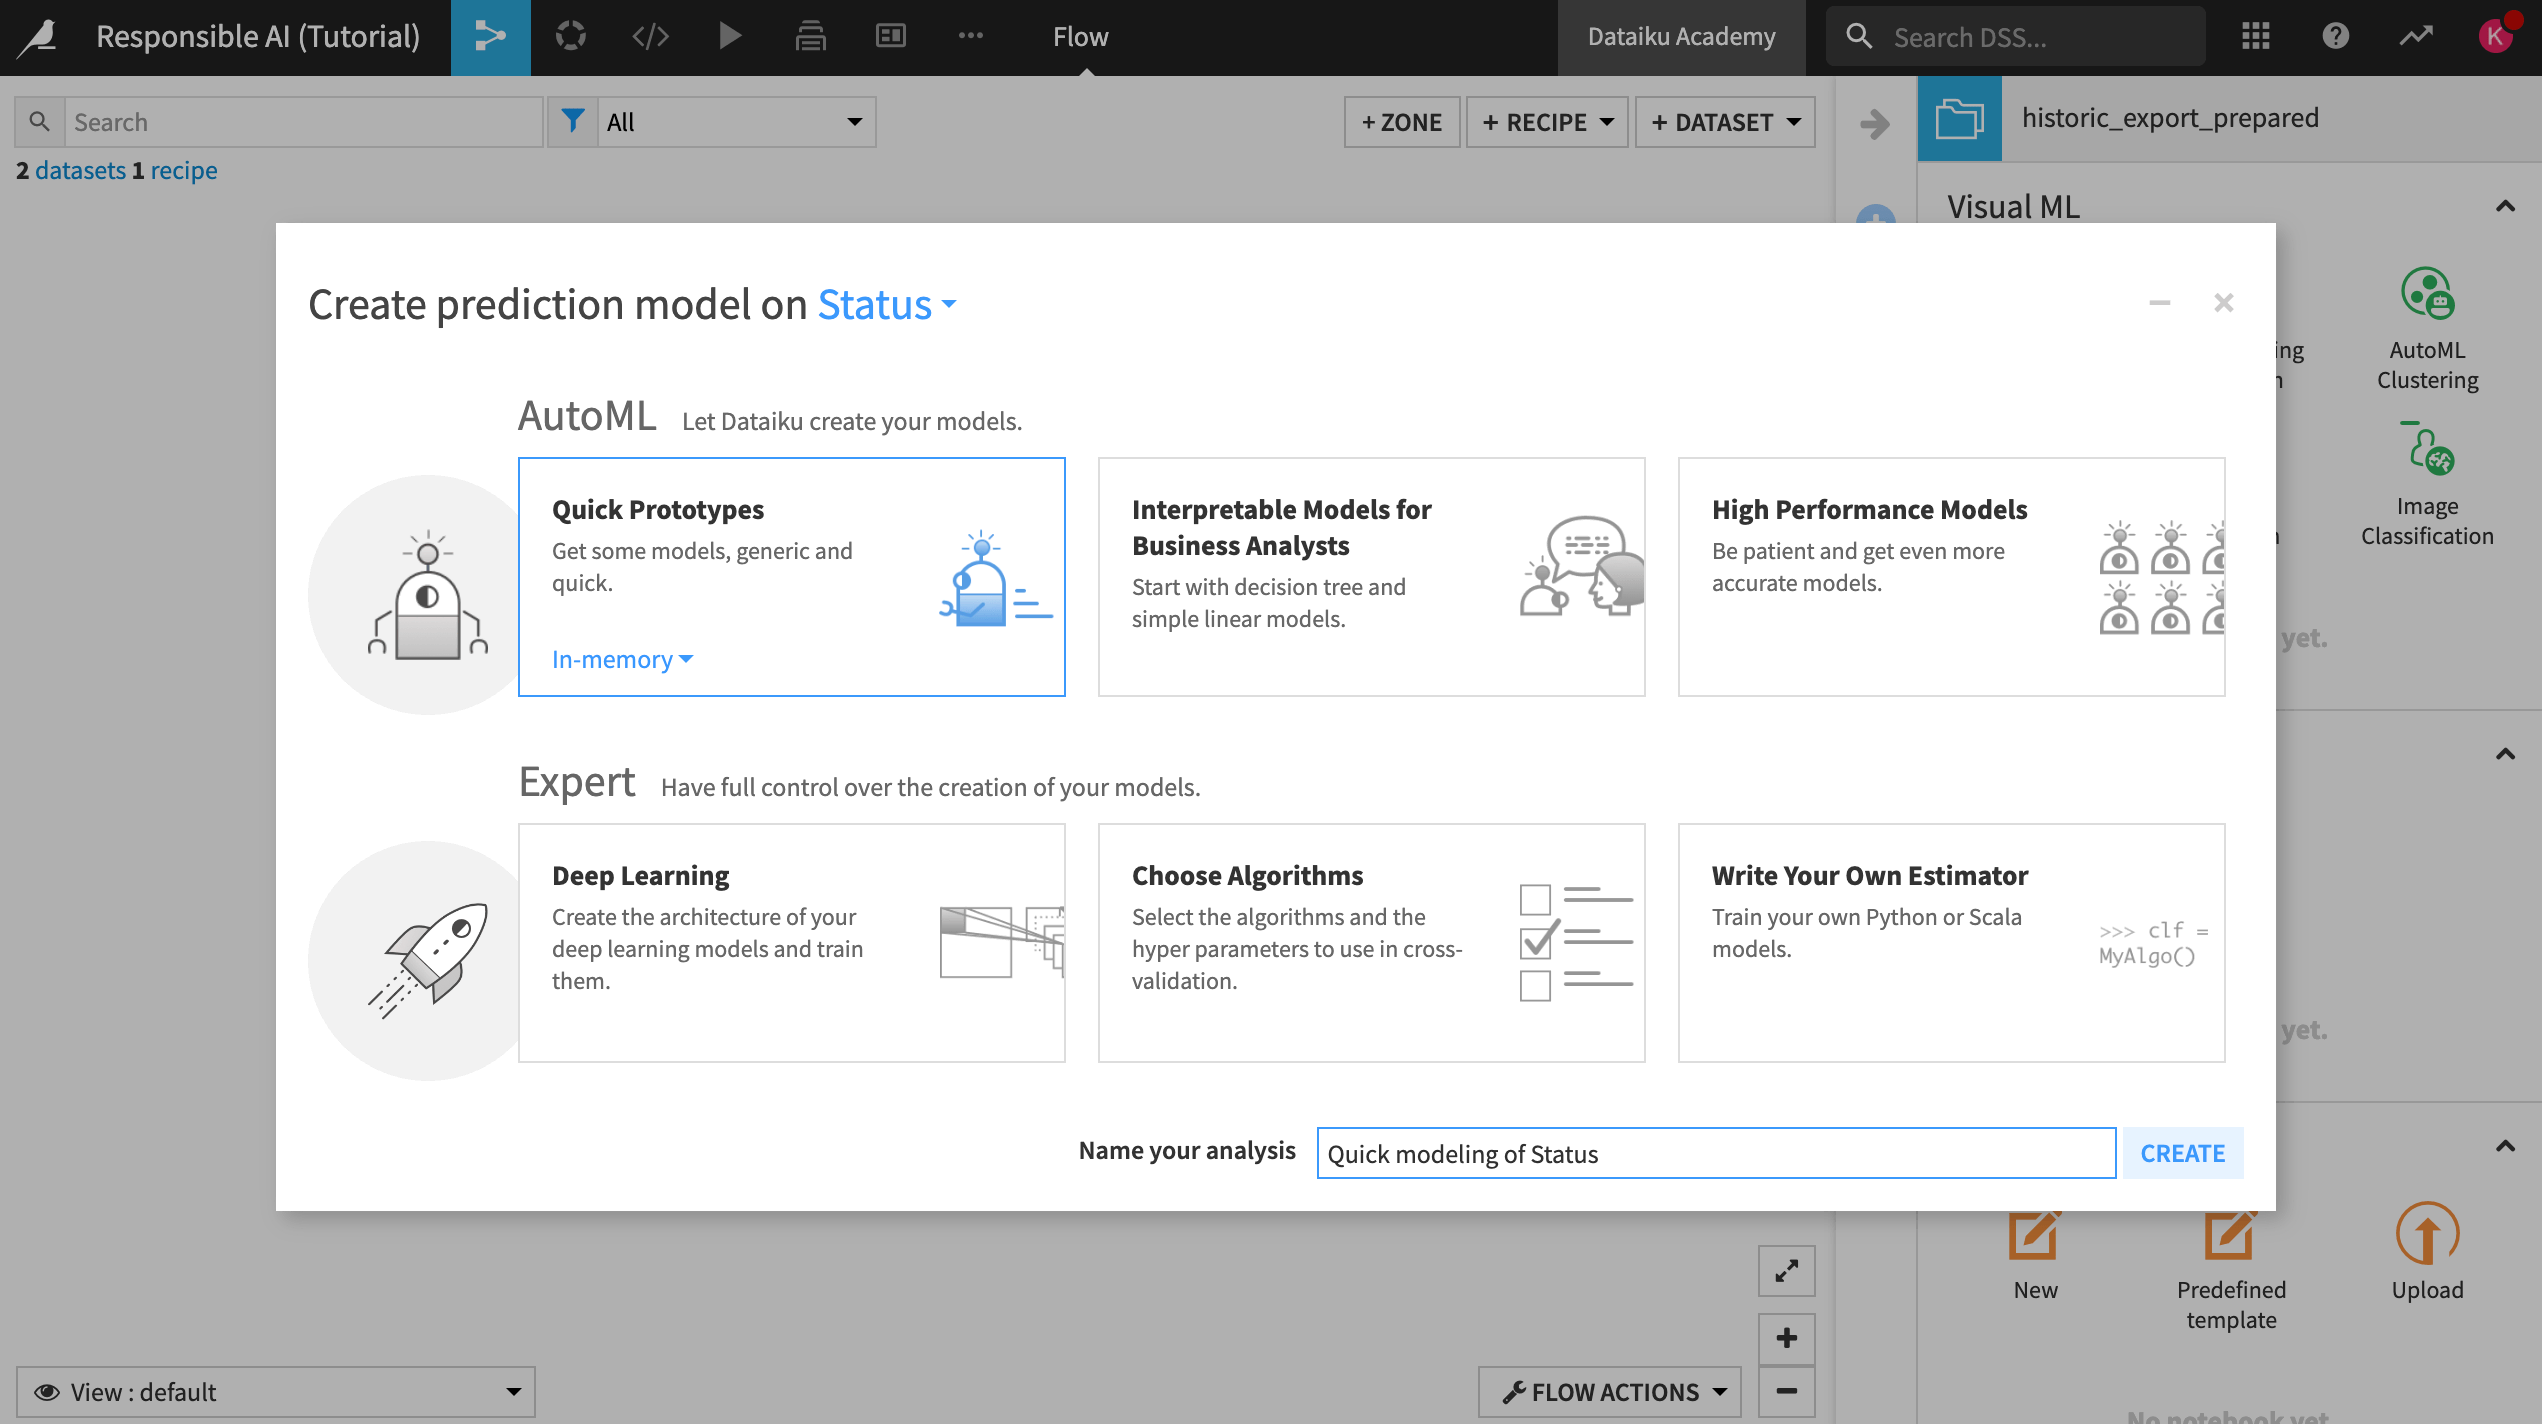
Start by selecting the historic_export_prepared dataset.
Open the Actions tab and click on Lab.
Click on Auto ML Prediction and create prediction model on Status.
Choose Quick Prototypes, name your analysis
Quick modeling of Status, and click Create.
For our baseline model, we won’t adjust the design of the model at all, so:
Train the model without making any changes.
After training, open the Random forest model to see a summary and additional views on the model.
Important
Before continuing, take a moment to reflect on why training this model without making any adjustments to the design or feature selection could be a problem based on what we discovered during the data exploration phase of this project. Consider what you would tweak, knowing that the dataset has pre-existing biases.
Analyze metrics#
Within the Random Forest model summary:
On the left, select Explainability > Model fairness report.
Note
If you are working on an earlier version than Dataiku 12.5, go to Model Views > Model fairness report instead.
Set the sensitive attribute to Age Group New and the group to 55 +. This is our group of interest.
Make the positive outcome Churned and select Compute.
Select the Equality of Opportunity metric.
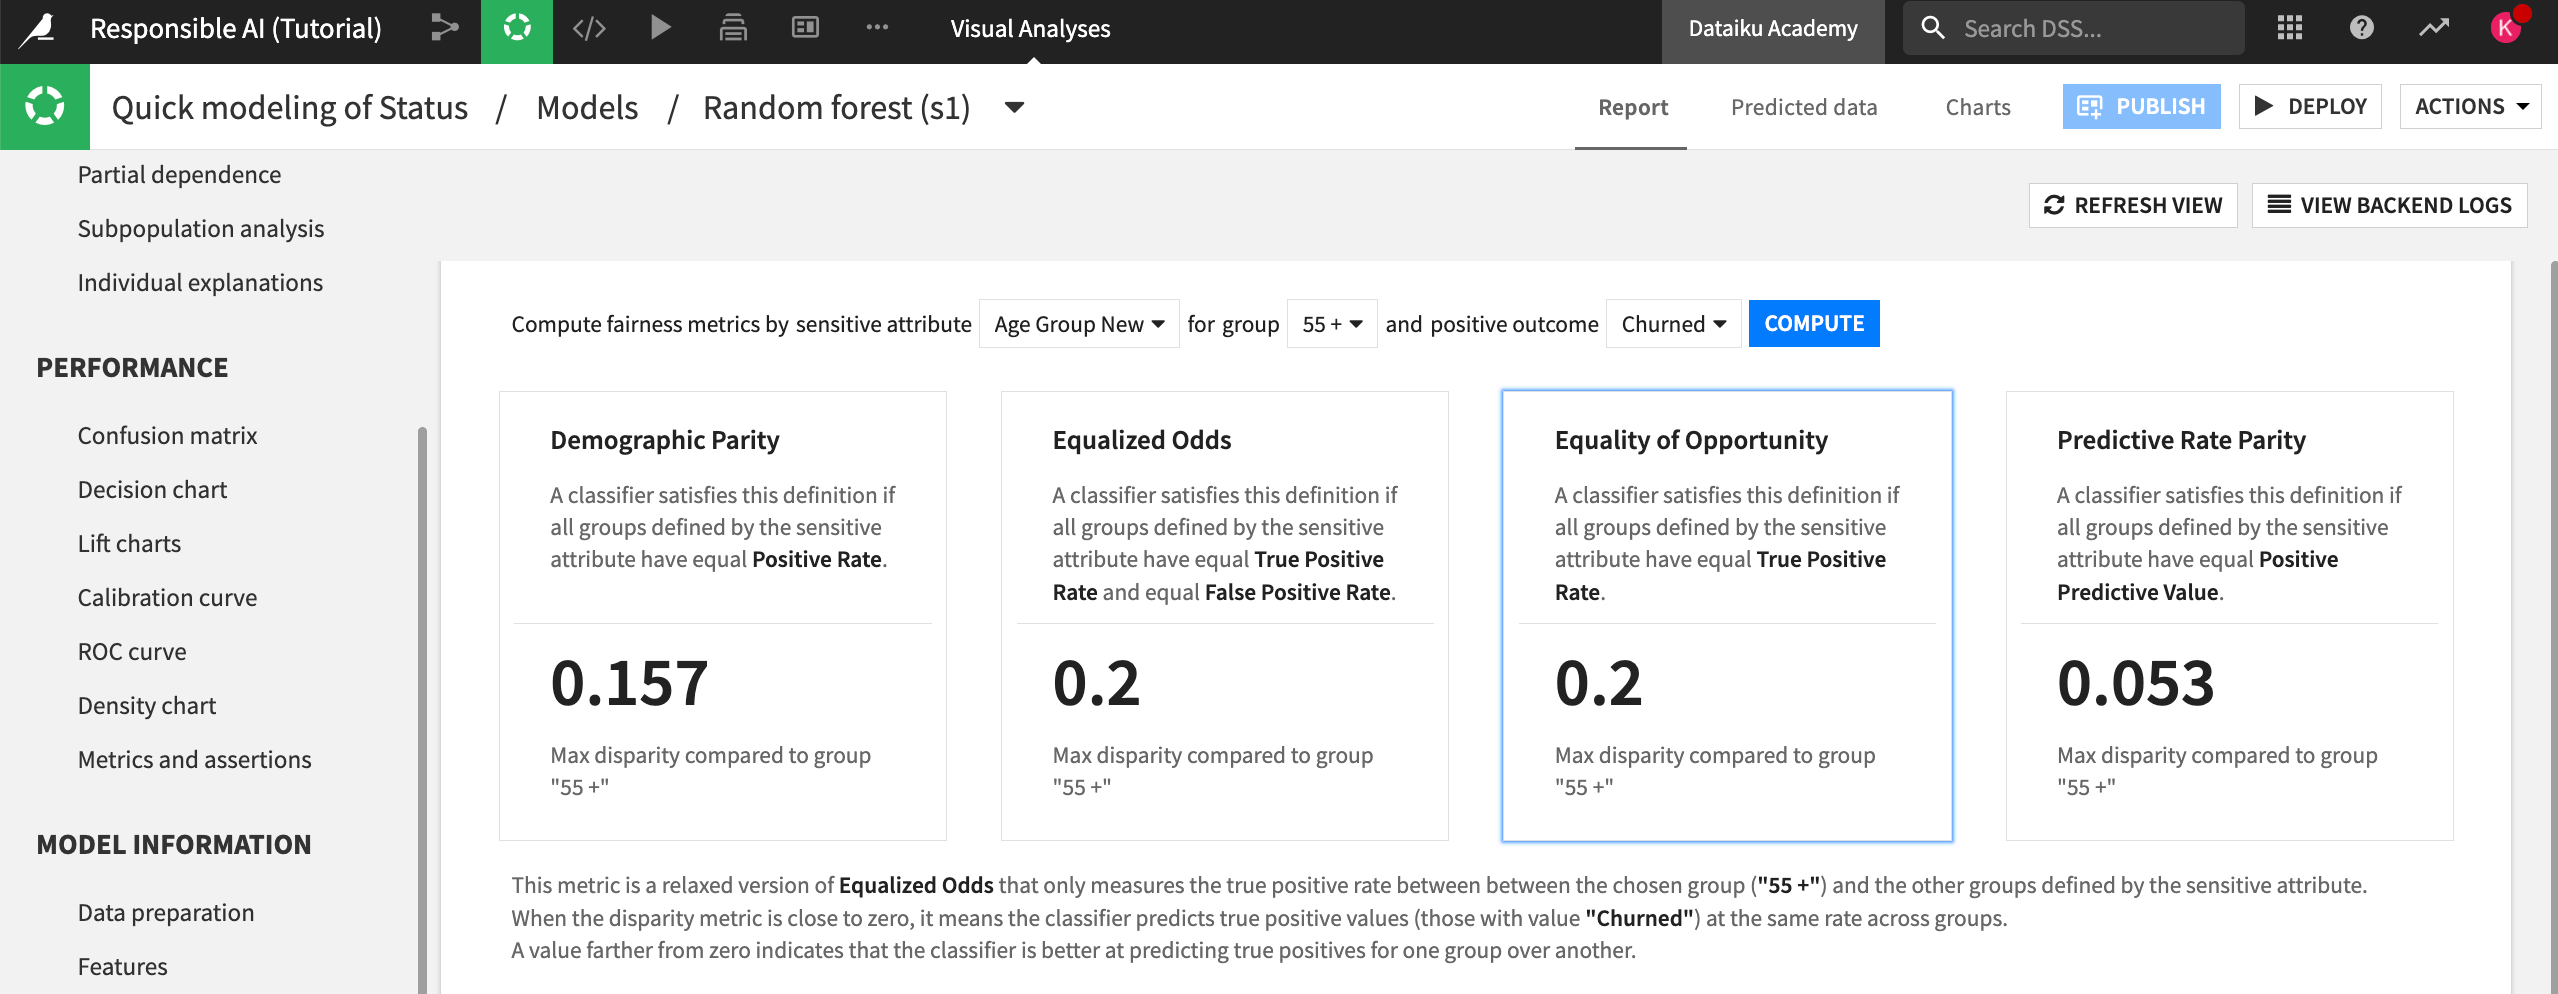
In this case, we chose the Equality of Opportunity metric to assess fairness because we want to ensure that the model finds true churn cases at an equal rate across the different age groups. This would support our end goal of making sure that older clients who are at risk of churn get the appropriate discounts and promotions.
Now, let’s review the results of the Model fairness report. Note that your metrics may not exactly match what we describe below, as your random forest model might differ slightly.
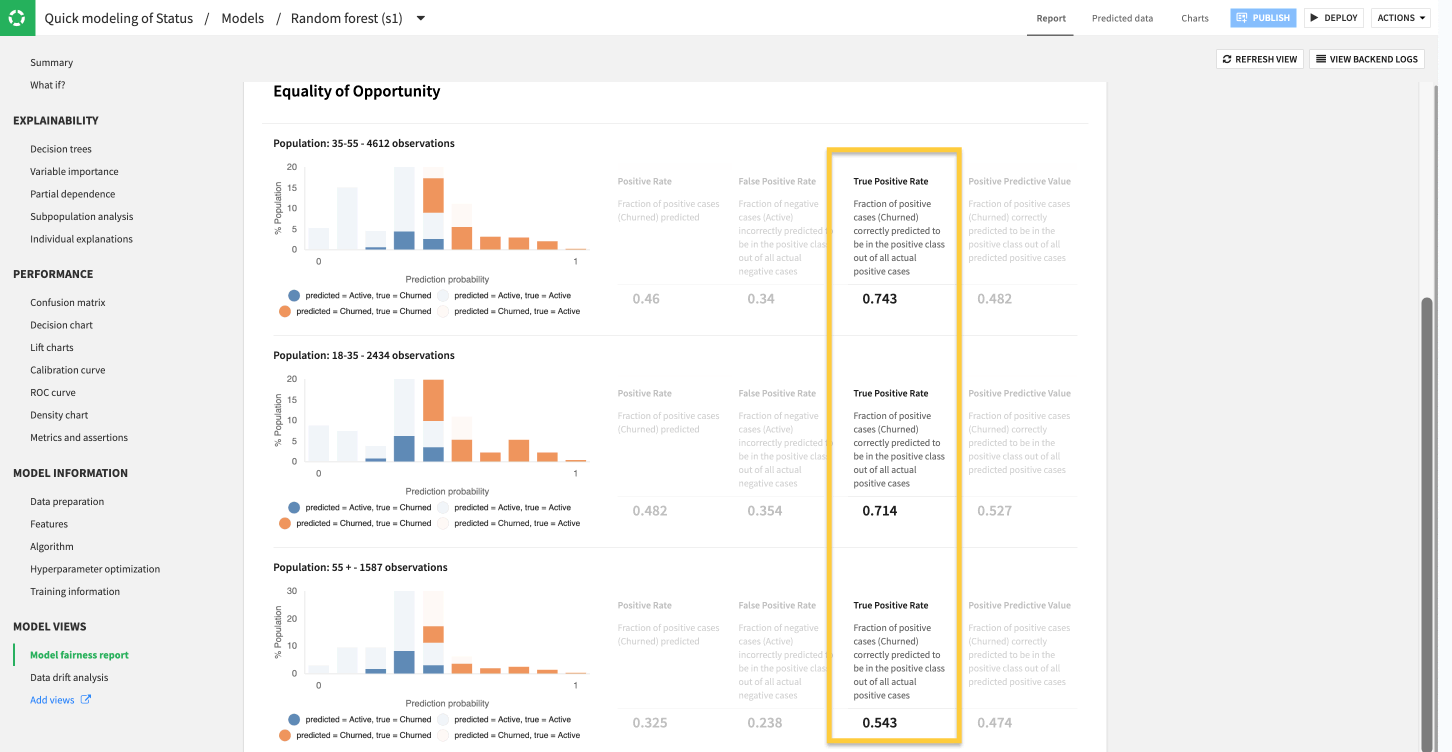
The results show a notable discrepancy in model performance among the different age groups in the dataset.
According to the model fairness report, the model finds far fewer true cases of churn (true positives) among older customers than younger age groups. To be more precise, the difference in performance between the 35 : 55 and 18 : 35 group is about 3%, but the max difference compared to the 55 + group is 20%.
The 0.543 True Positive Rate in our example indicates that even though the overall model might perform with a reasonable AUC, it misses around half of true churn cases for older customers who could actually benefit from promotional pricing or outreach to prevent potential churn.
Note
In this example, while 20% is a large discrepancy, should we pay attention to the 3% difference? The degree to which this difference is statistically or practically significant depends on each organization’s approach to measuring model risk. Currently, there are no overarching guidelines on what’s an acceptable threshold for model fairness, calling attention back to the importance of documenting these results and determining how well they align with your organization’s goals and visions for Responsible AI before the model is sent to production.
Document ideas#
Now we’re aware that our model may be biased in terms of age. Next, take some time to repeat these steps for some of the other sensitive attributes that were highlighted in part one of this series (gender, location, marital status).
Do you have similar concerns about the unfairness of this model relative to those features?
Return to your Model Experimentation article in the project wiki.
Document these concerns to establish traceability of ideas and thinking that went into building a more responsible AI pipeline.
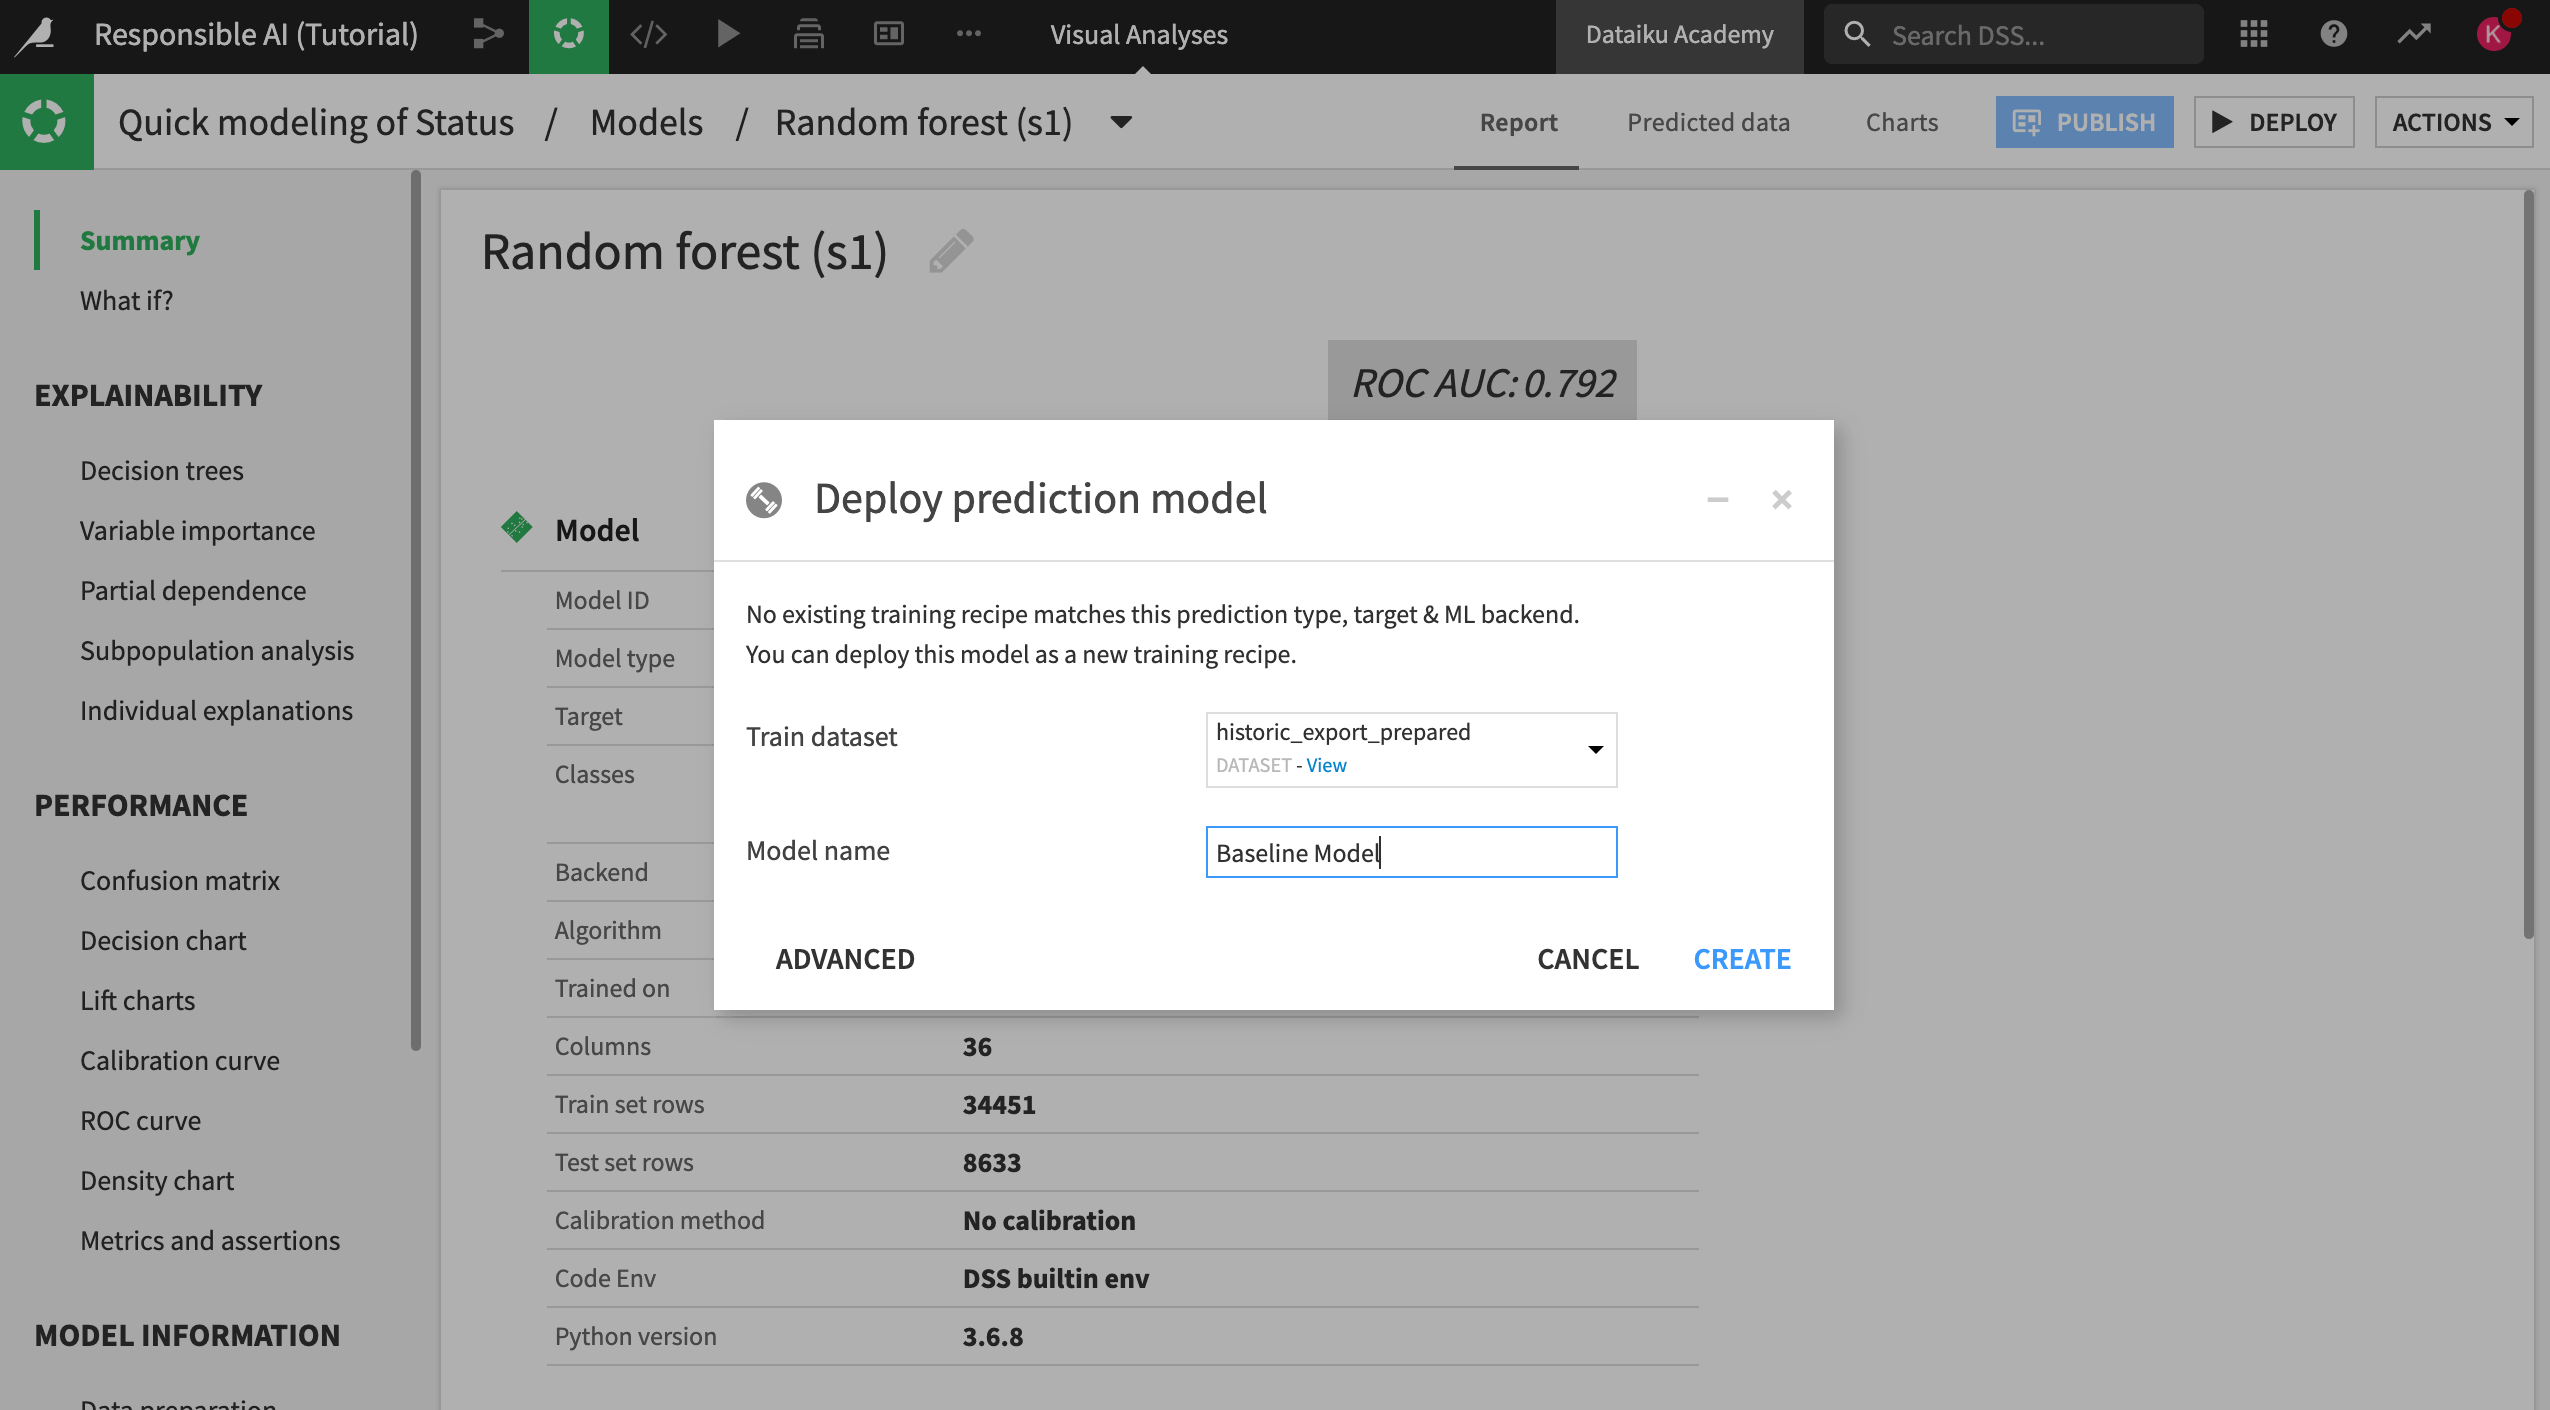
Deploy the model#
Return to your random forest quick model.
Deploy this model to the Flow under the name
Baseline Modelso we can use it as our control model in the future.