
Tutorial | Use dashboards to build reports#
Get started#
In this tutorial, let’s build a dashboard to communicate key insights from your project.
Objectives#
In this tutorial, you will:
Publish insights to a dashboard.
Design a dashboard page.
Export a dashboard to a PDF.
Prerequisites#
To complete this tutorial, you’ll need the following:
Dataiku 14.0 or later.
Create the project#
From the Dataiku Design homepage, click + New Project.
Select Learning projects.
Search for and select Build Reports with Dashboards.
If needed, change the folder into which the project will be installed, and click Create.
From the project homepage, click Go to Flow (or type
g+f).
Note
You can also download the starter project from this website and import it as a ZIP file.
Use case summary#
Let’s say we’re a financial company that uses some credit card data to detect fraudulent transactions.
The project comes with several datasets, the main one being tx_prepared, which is a clean join of the three source datasets (tx, cards and merchants).
In short, tx_prepared contains comprehensive information about credit card transactions (from tx), including the associated merchant details (from merchants) and credit card specifics (from cards), such as transaction status and amount, merchant location and category, and cardholder creditworthiness.
Most importantly, this dataset already has several charts created for you. You’ll use them to build and structure your dashboard. If you’re unfamiliar with charts in Dataiku, you can refer to the Charts section to learn more.
Publish charts to a dashboard#
Let’s publish some charts to a dashboard.
From the Flow, open the tx_prepared dataset.
Click on the Charts tab (or use the keyboard shortcut
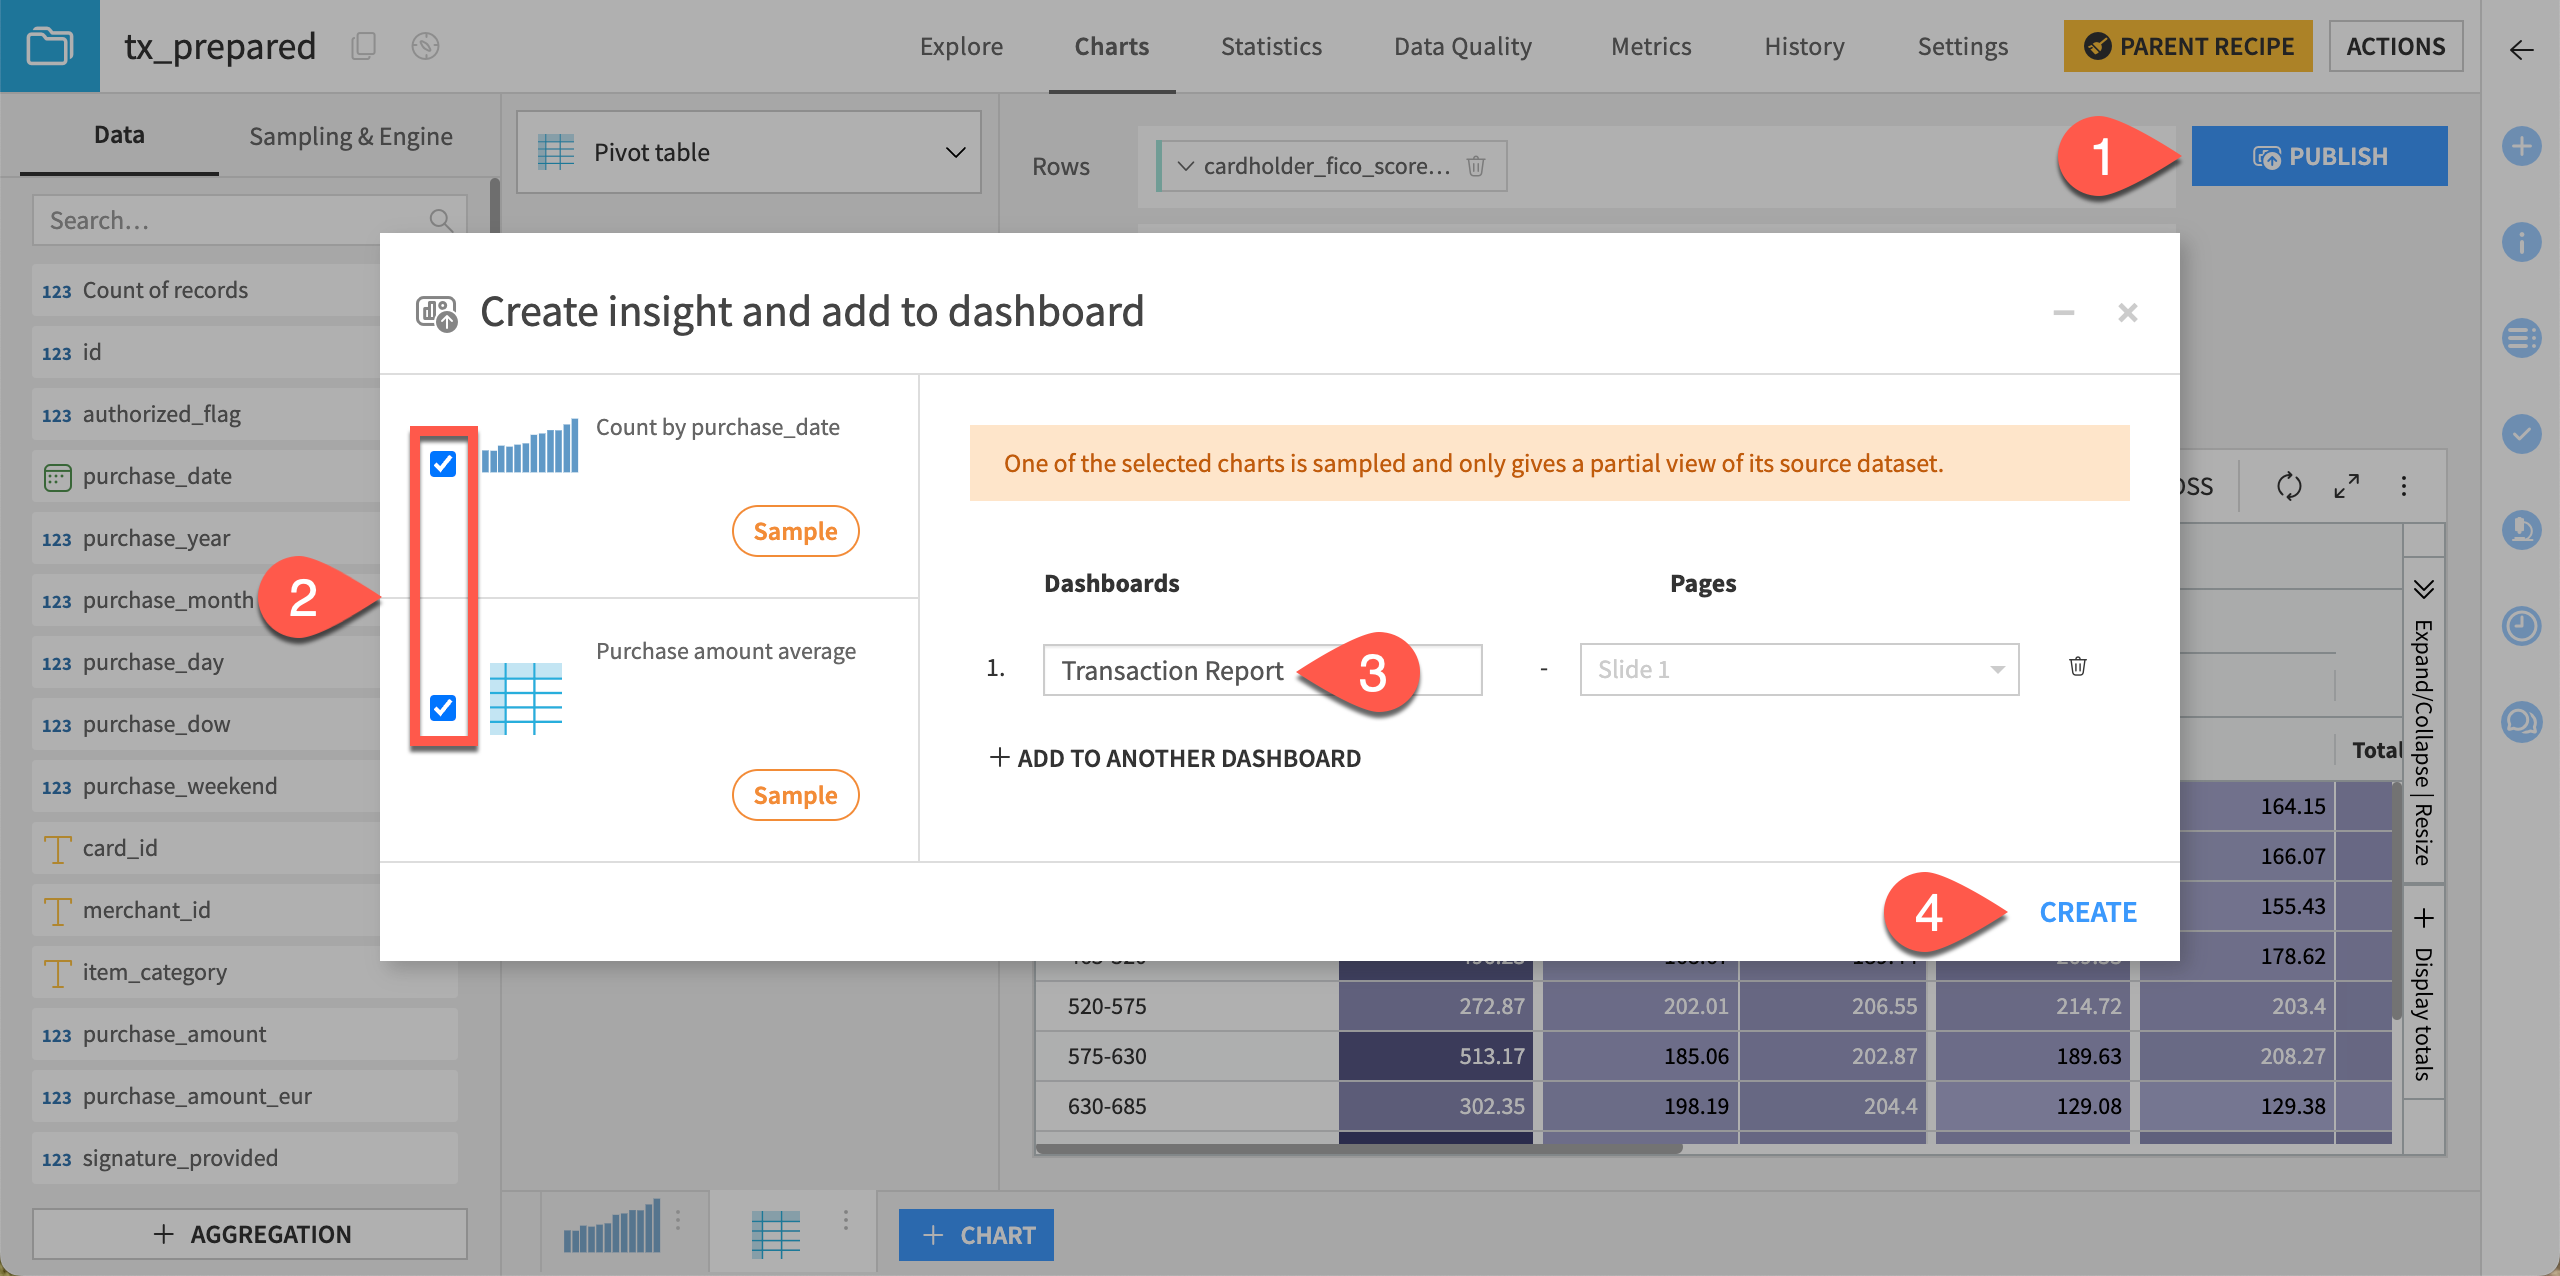
g+v).Click the Publish button in the top-right corner.
Select all charts.
In the Dashboards dropdown, select Create new dashboard, and name it
Transaction Report.Under the Theme field, select the option Source.
Note
If you’re using a version of Dataiku prior to 14.0, you may not see the Theme field. This tutorial uses the DSS Default theme, so if the option isn’t available, you can simply skip it—the result will be the same.
For more information about theming, refer to Visualization themes.
Click Create to turn the charts into insights and publish them to the new dashboard.
Important
Clicking Create performs two actions:
It turns the charts into insights.
It publishes these insights to the selected dashboard.
To better understand this, you can open the Insights page from the top navigation bar (![]() ), or by pressing
), or by pressing g + i. You’ll see that the insights now exist independently—they’re not tied to the original chart or to a specific dashboard. This means that:
Updating a chart won’t update the insight.
An insight can be reused across multiple dashboards.
Learn more about chart insights in the reference documentation.
Explore dashboard options#
Now, let’s refine the dashboard by adjusting how each tile looks and behaves.
Edit the dashboard tiles#
Once you’ve published the insights to the dashboard, it opens in edit mode.
Let’s apply a few visual changes:
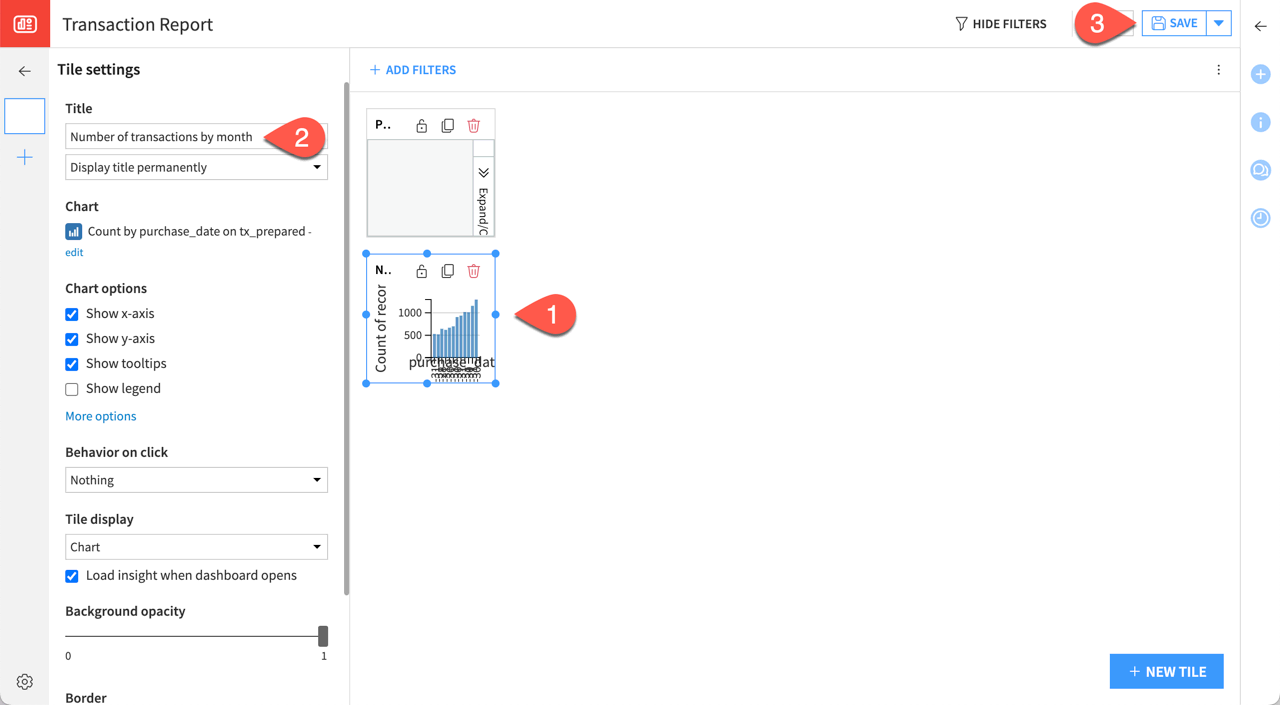
Click the Count by purchase_date on tx_prepared vertical bar chart insight.
In the Tile settings panel on the left, change the Title to
Number of transactions by month.In the top-right corner, click Save (or use the keyboard shortcut
Cmd/Ctrl+S).
Adjust the dashboard layout#
In a dashboard, you can:
Drag each tile to change the layout.
Adjust the size of each tile for a clearer view of its insight.
To do so:
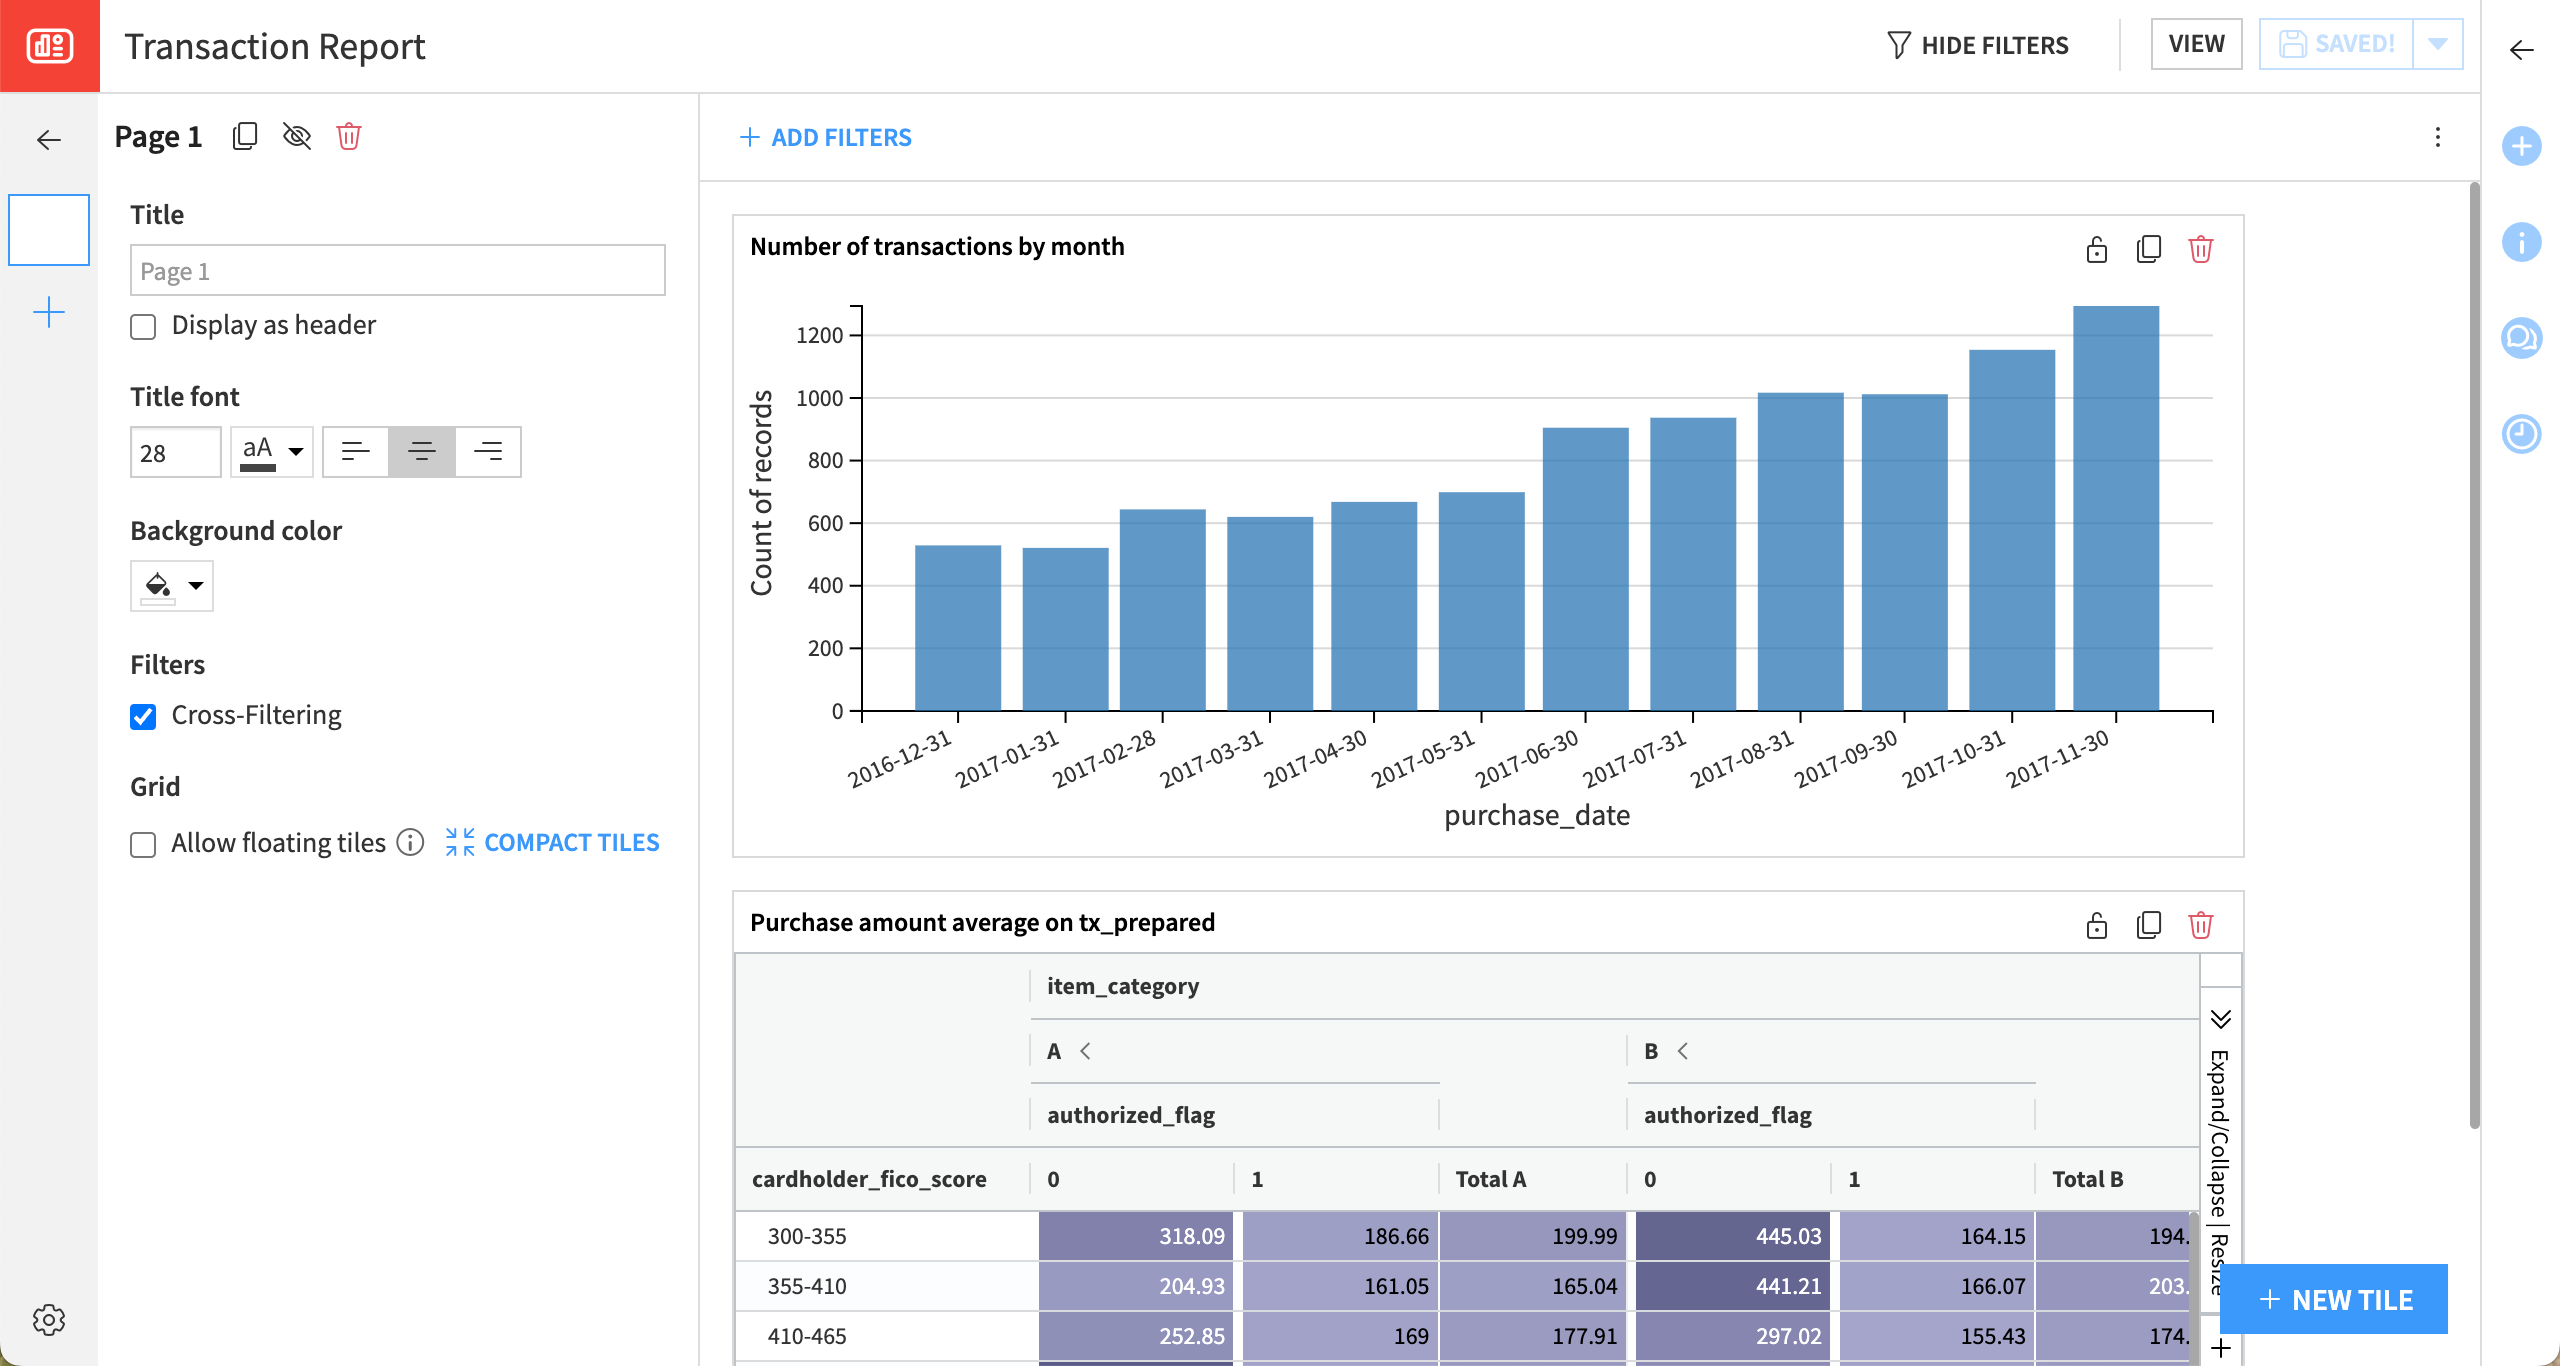
Click on the Number of transactions by month bar chart.
Drag it down and increase its width and height to obtain a wider view of the table.
Adjust the other insight to improve its display.
Click Save.
Note
Note how the insights include a Sample warning label to indicate that they don’t represent the complete dataset.
Tip
Users of Dataiku 14+ can organize their dashboard layout by grouping tiles. To do so, hold Cmd/Ctrl and click to select multiple insights. Then, click the Group Tiles button or press Cmd/Ctrl + Option/Alt + G.
Grouping allows you to move tiles as a unit, customize the group’s background color, and control the spacing between tiles—ideal for creating clear, organized sections in your dashboard. For more information, see Group tile in the reference documentation.
Starting with Dataiku 14.2, you can also enable Stack up automatically in the dashboard or profile settings to remove and prevent vertical gaps between tiles.
Add an insight to a dashboard#
Let’s add another insight to a new page on the dashboard.
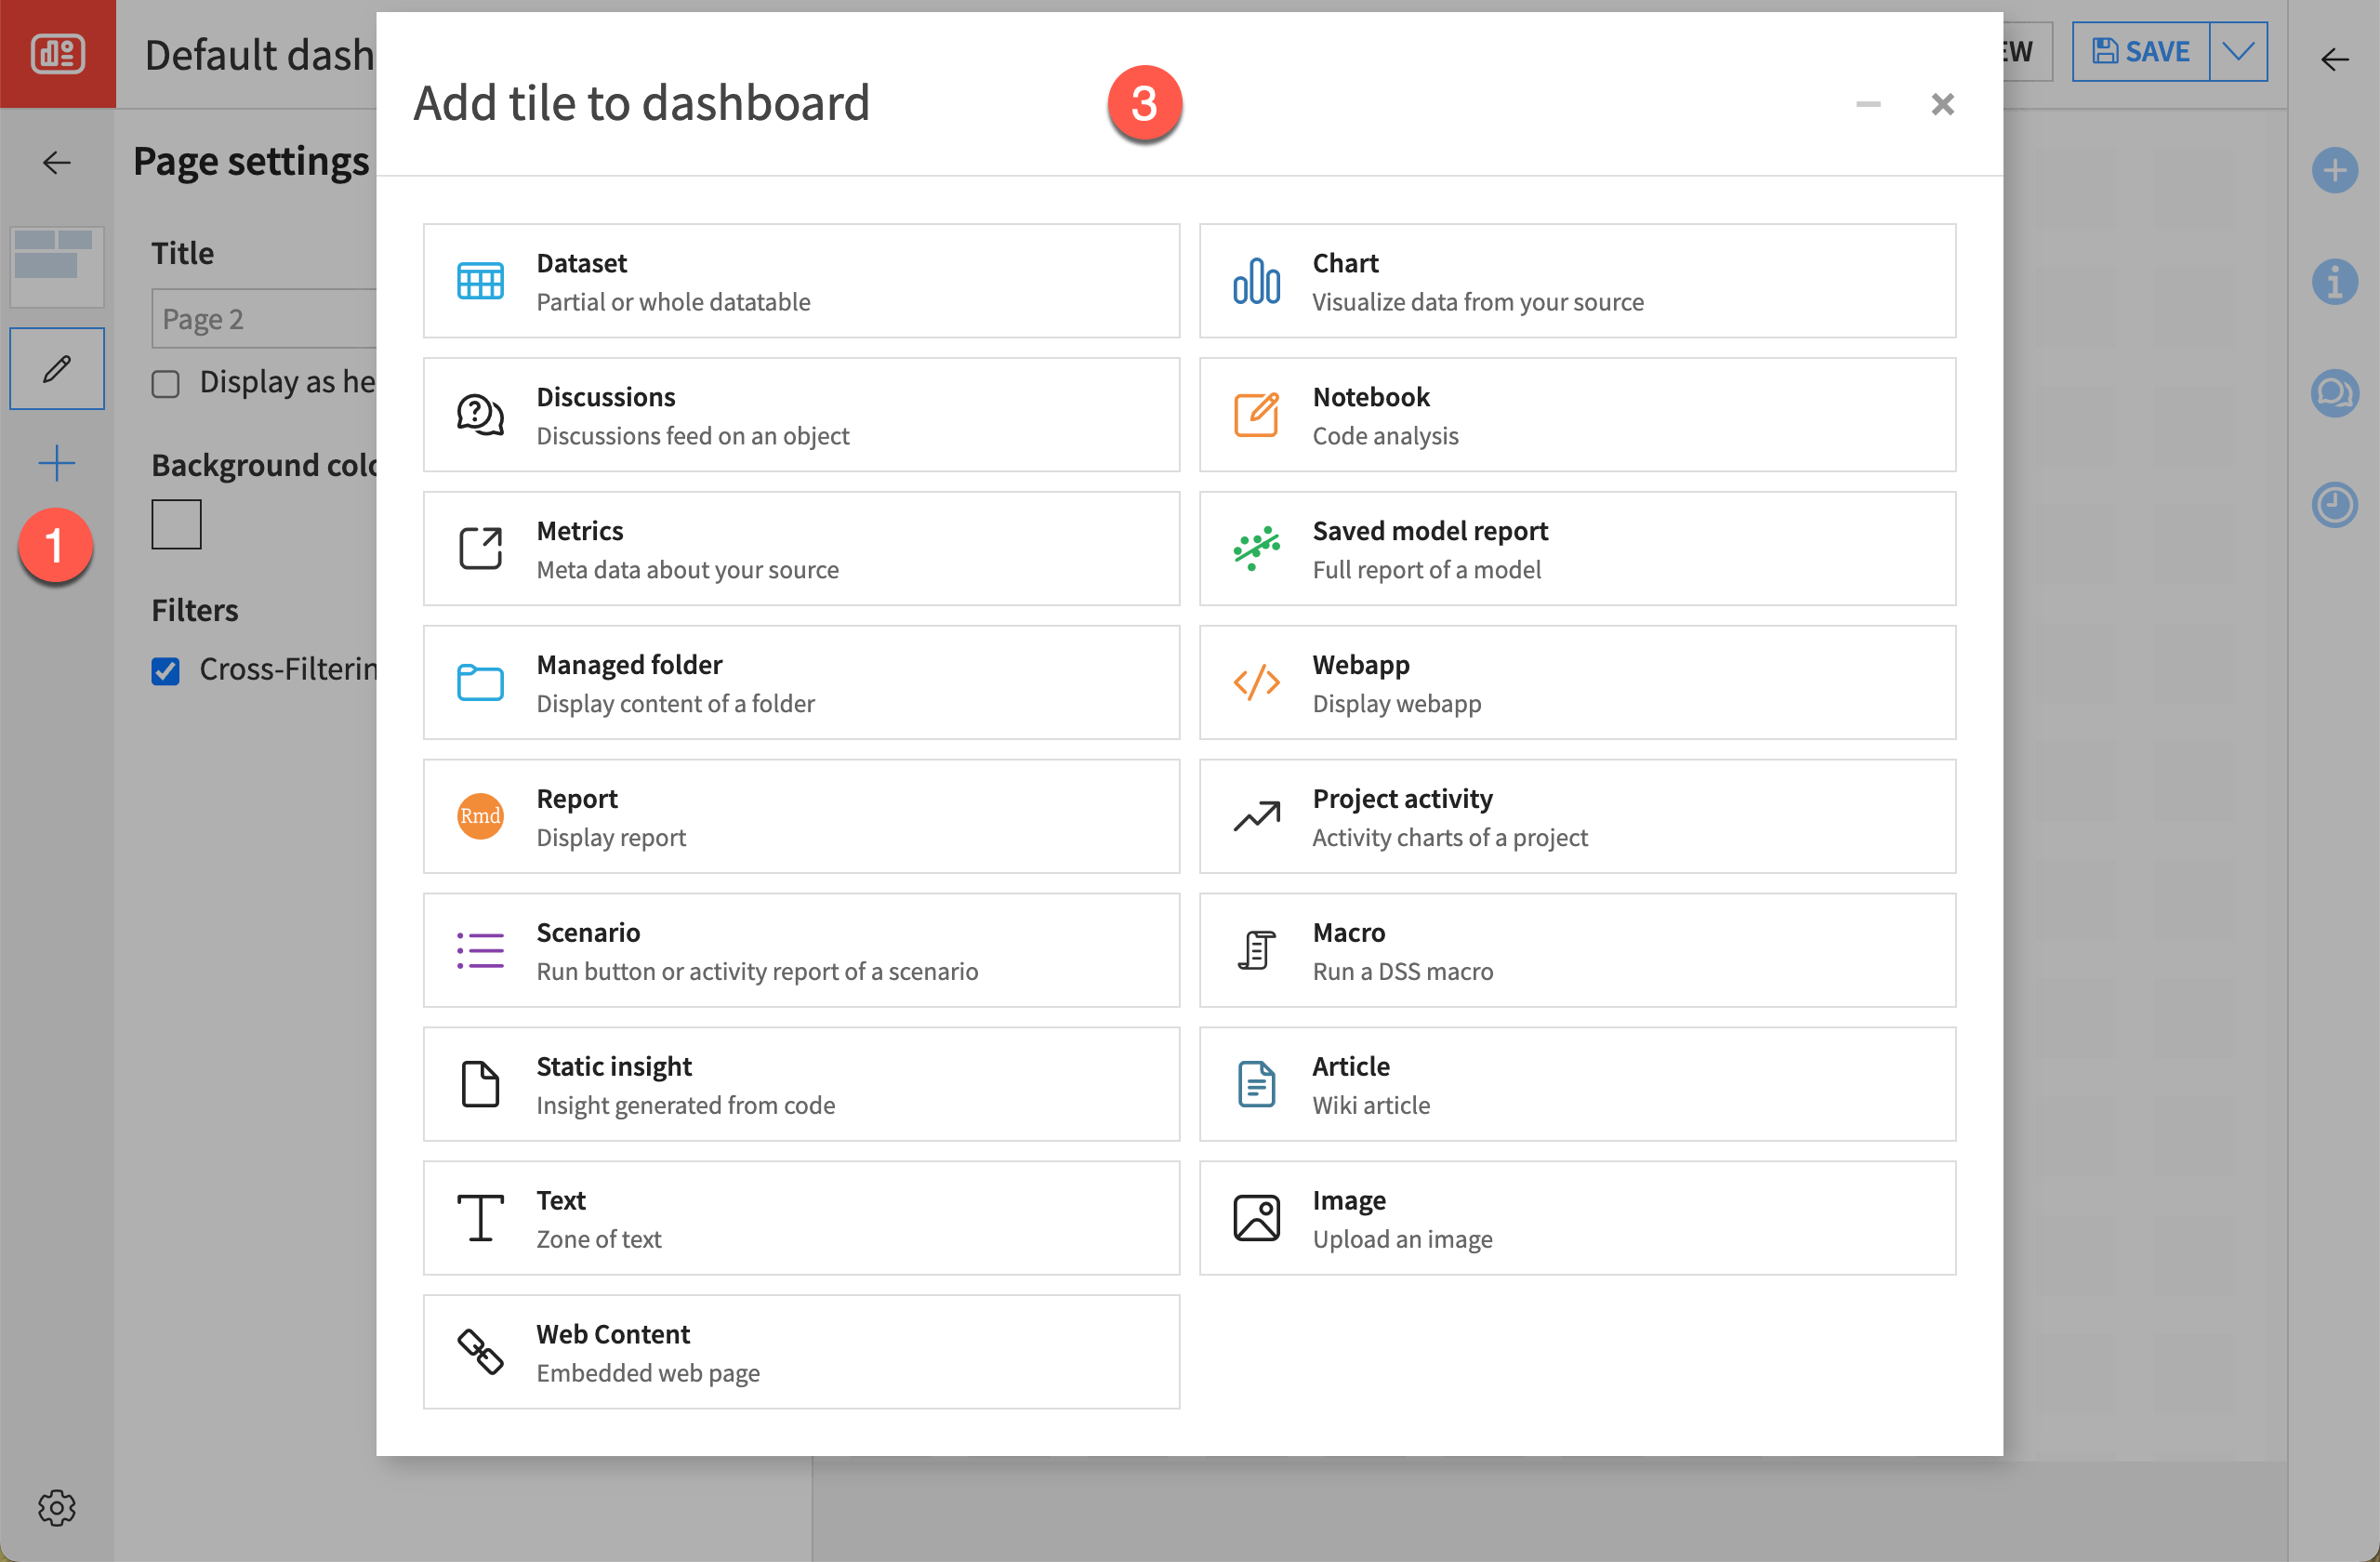
Click the + icon in the left bar to add a new page.
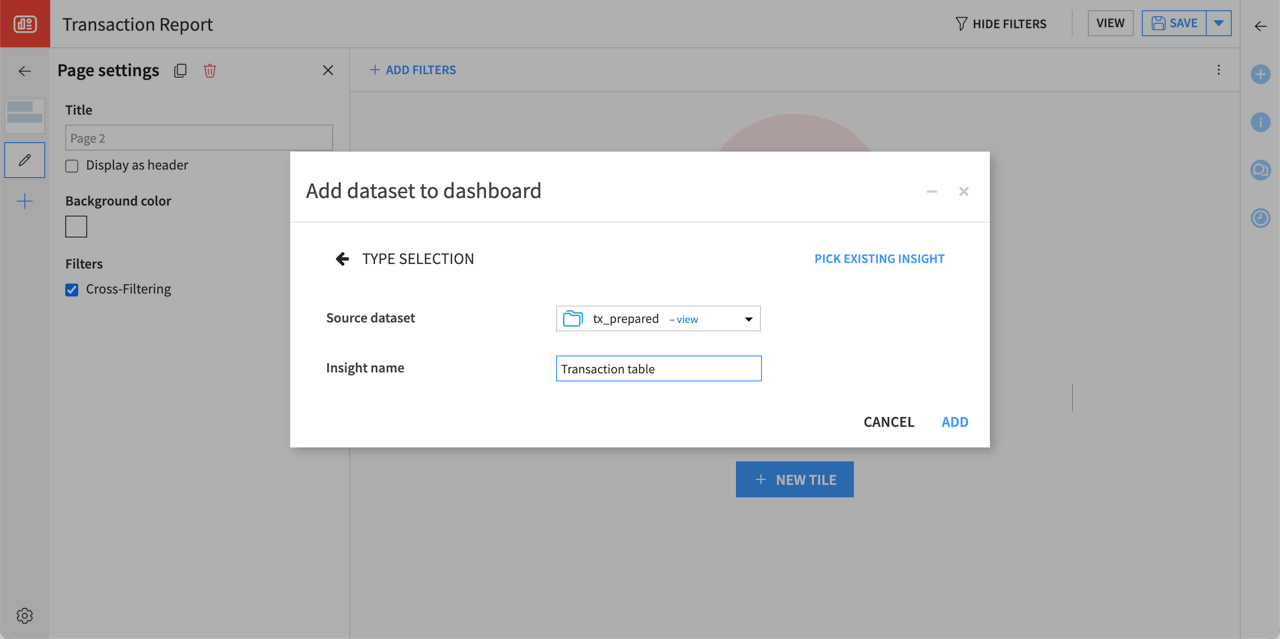
Click the + New Tile button to add a new tile and select Dataset.
In the dialog that opens:
Select tx_prepared as the source dataset.
Enter
Transaction tableas the insight name.Click Add.
Feel free to experiment adding different kinds of tiles, such as another chart or dataset.
Important
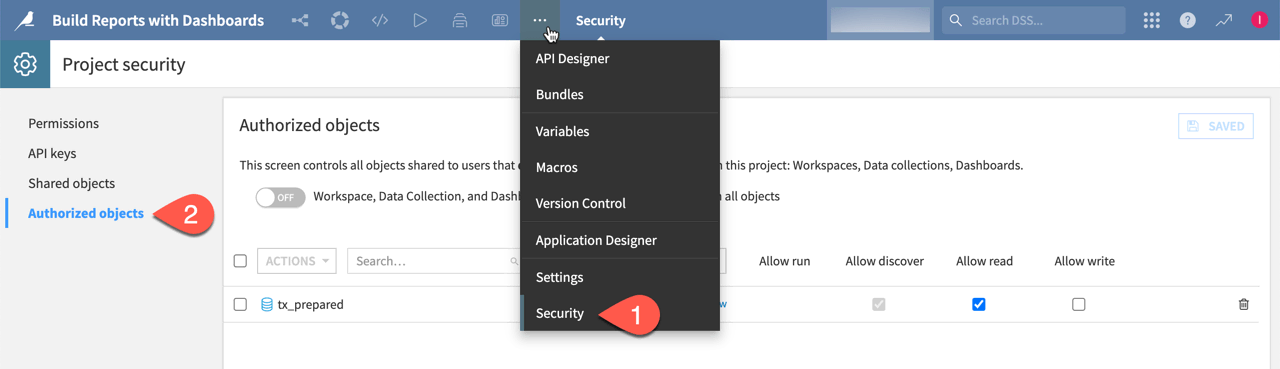
You may get a warning stating that the object isn’t yet shared with dashboard-only users and offering to add it to authorized objects.
The Project security page controls object permissions. To access it:
From the top navigation bar, select the More Options (
 ) > Security menu.
In the left panel, click on Authorized objects.
Export a dashboard#
Warning
For this last step, users on a self-managed instance will need to have an administrator first enable the graphics export feature.
When satisfied with your dashboard, you can export it.
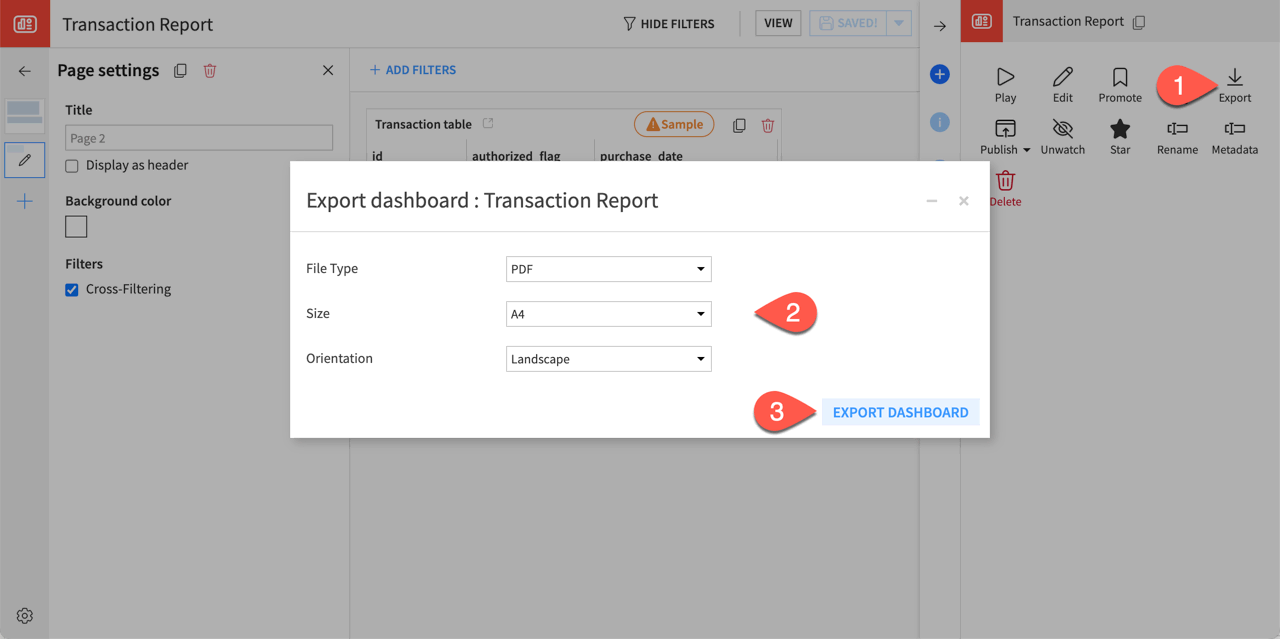
In the Actions (
 ) tab of your dashboard, click the Export button.
Adjust the file type, size, and orientation of your export as needed.
Click Export Dashboard.
Next steps#
You’ve just created your first dashboard. Follow the Tutorial | Dashboard management to master all the features of this visualization and reporting tool.