Tune the model#
You have built a basic model to classify high revenue customers and looked at a few ways to evaluate its performance. Because modeling is an iterative process, let’s now turn our attention to improving the model’s results and speeding up the evaluation process.
Return to the model design#
We first need to return to the design of the modeling task.
Navigate to the High revenue analysis attached to the customers_labeled dataset by clicking on Models within the High revenue analysis/Models/Random forest title at the top of the page.
Click on the Design tab near the top center of the page.
Configure the train / test split#
One setting we may wish to tune is the split between training and testing sets.
Click on the Train / Test Set panel of the model’s design.
By default, Dataiku randomly splits the first N rows of the input dataset into a training set and a test set. The default ratio is:
80% for training.
20% for testing.
This means Dataiku will take the first N rows of the dataset and randomly take 80% of those rows to train the model. This could result in a biased view of the dataset.
If we return to the customers_labeled dataset in the Flow, and analyze the high_revenue column, our target column, we can see that there is a class imbalance.
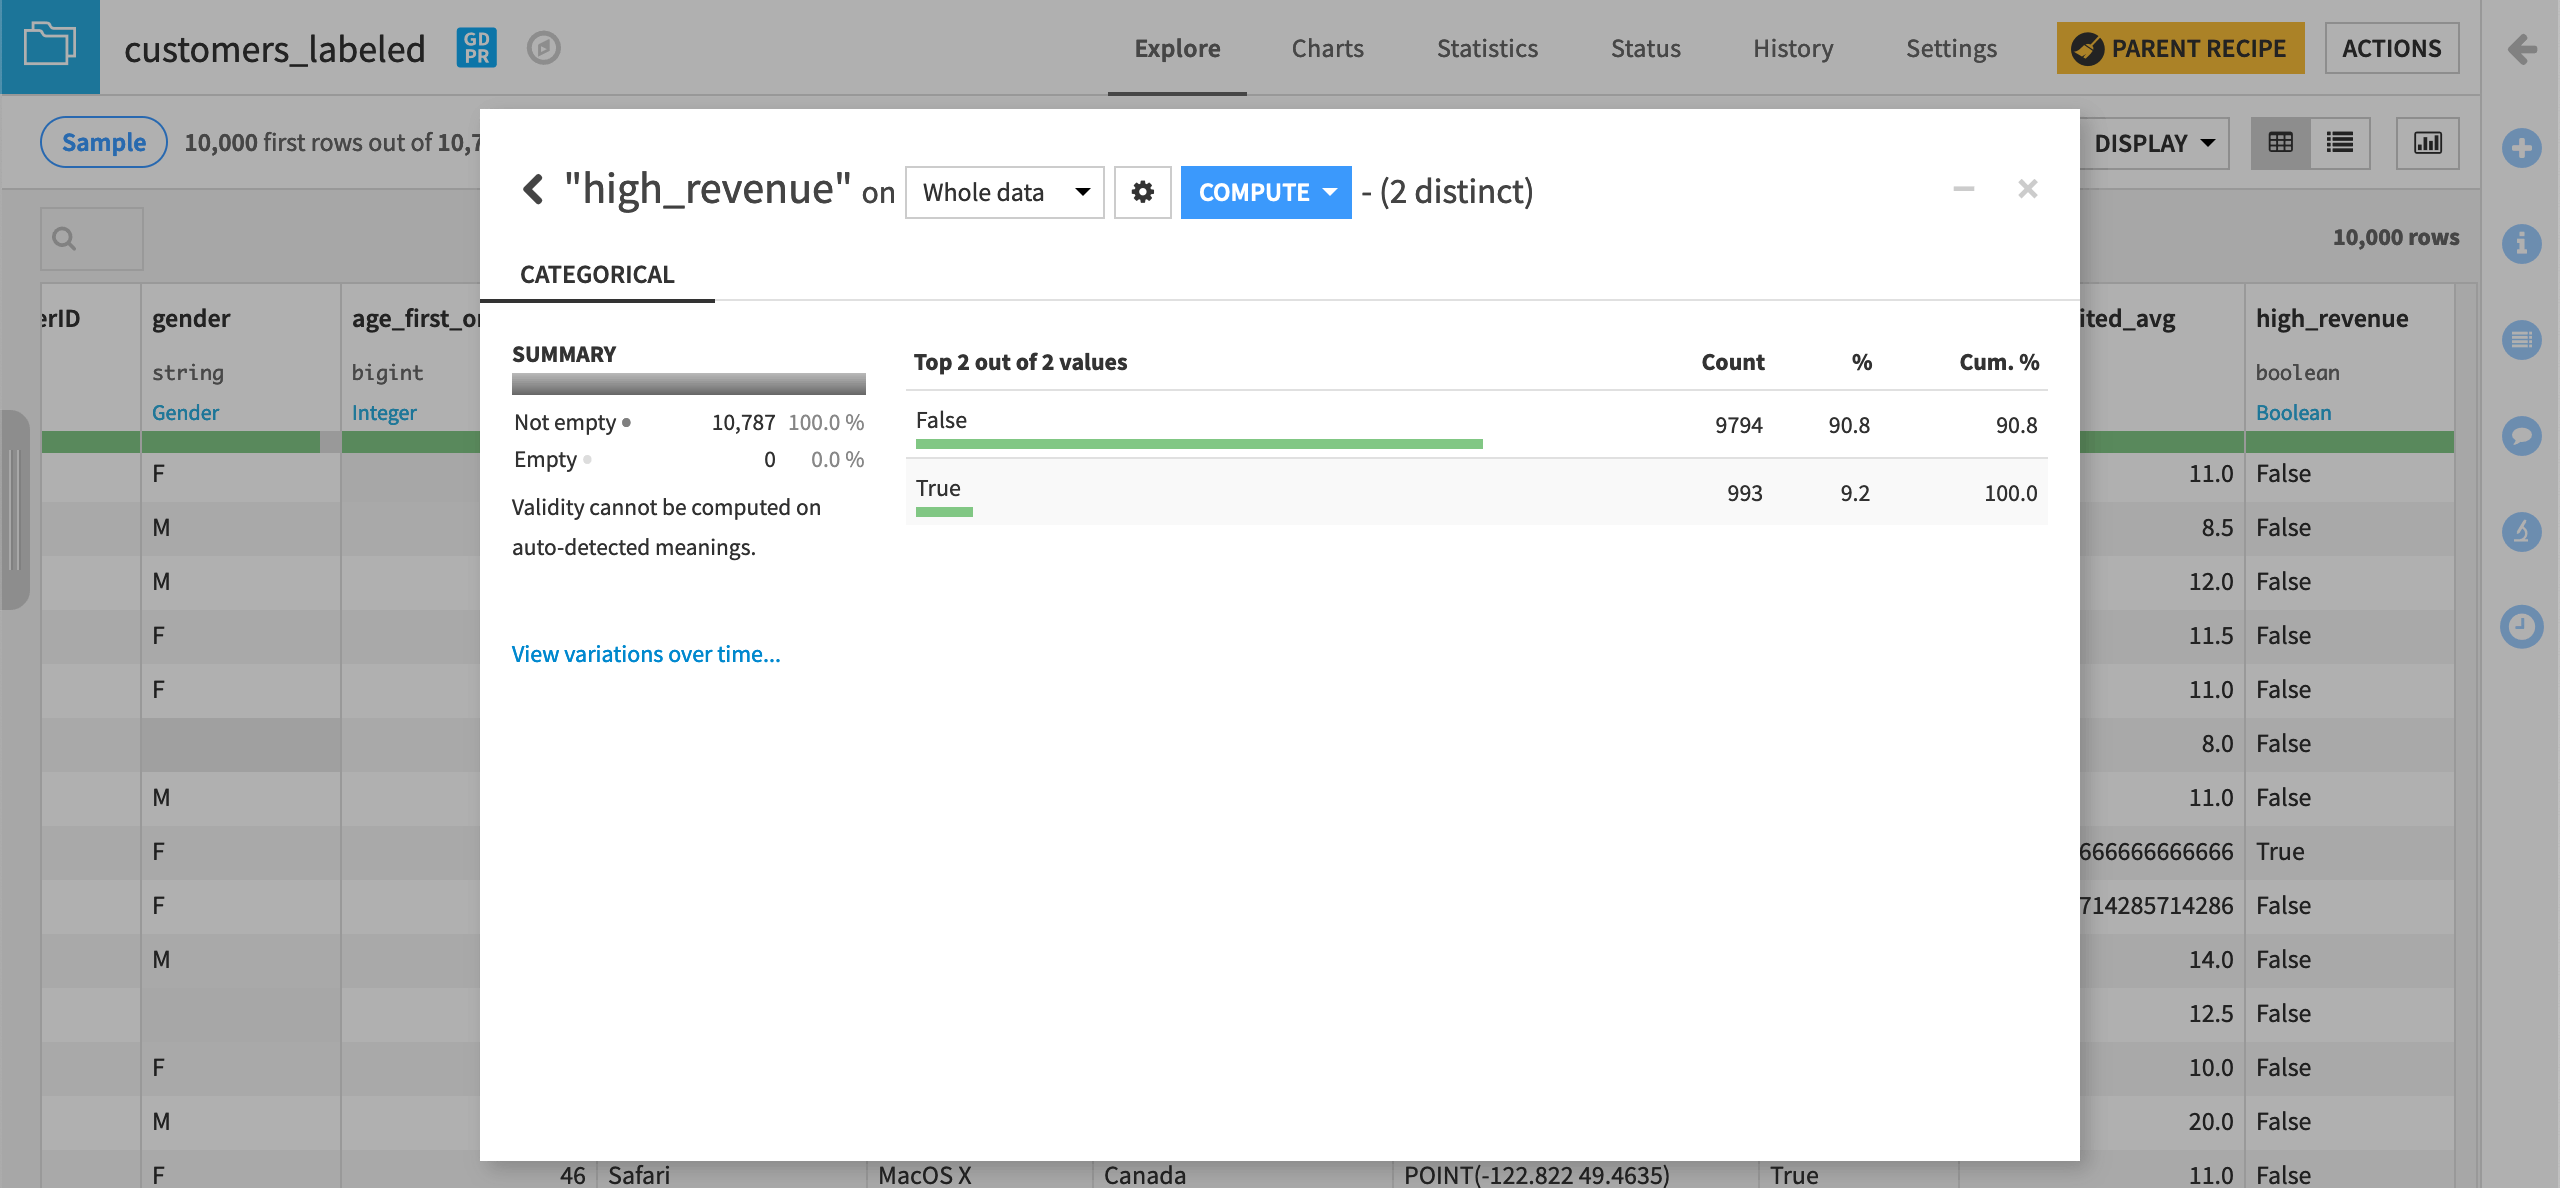
This could be problematic when taking only the first N rows of the dataset and randomly splitting it into train and test sets. However, since our dataset is small, we’ll keep the default sampling & splitting strategy.
See also
One way to try to improve a class imbalance is to apply a class rebalance sampling method. Visit the reference documentation on train/test set settings to discover how Dataiku allows you to configure sampling and splitting.
Adjust feature handling settings#
To address the issue about pre-processing of variables before training the model, we’ll use the Features handling panel. Here, Dataiku will let you tune different settings.
Reject GeoPoint feature#
Let’s decide which variables should be used or not used for model training.
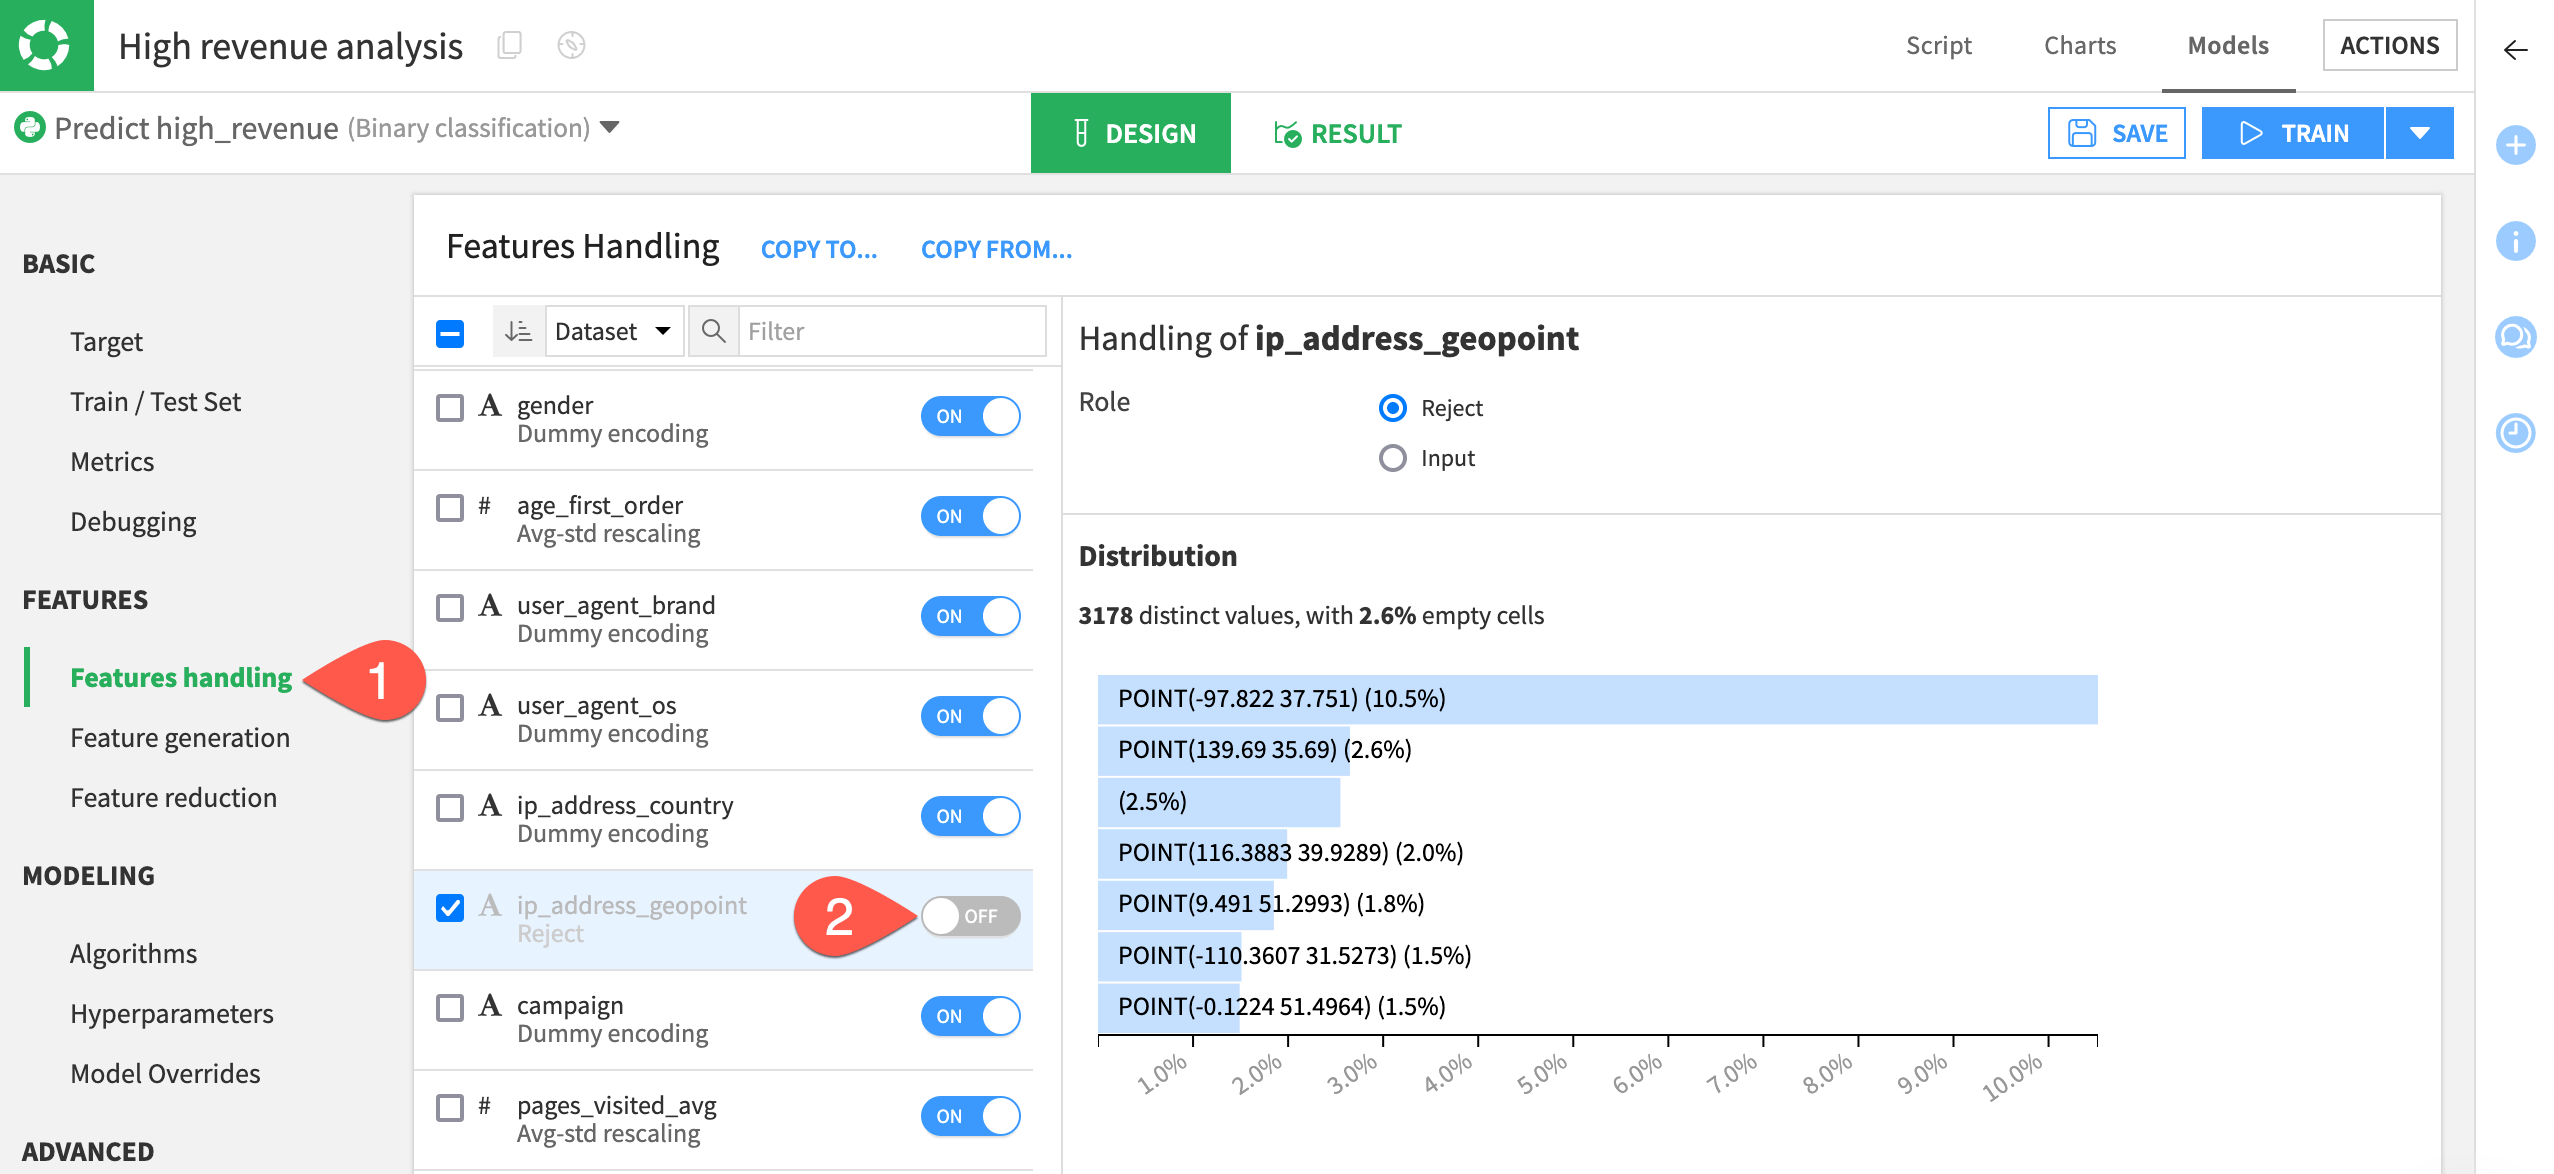
Since criteria like a GeoPoint isn’t relevant for our prediction because it doesn’t generalize well on new records, we’ll remove ip_address_geopoint from the model.
Select Features handling in the Features section of the left panel.
Toggle off ip_address_geopoint to exclude the feature from the model.
Disable rescaling behavior#
The Type of the variable is important to define how it should be preprocessed before it’s fed to the machine learning algorithm:
Variable type |
Contents |
|---|---|
Numerical |
Real-valued data. They can be integer or numerical with decimals. |
Categorical |
Nominal values: red/blue/green, a ZIP code, a gender, etc. Also, there will often be times when a variable that looks like numerical should actually be categorical instead. For example, this will be the case when an “id” is used instead of the actual value. |
Text |
Raw blocks of textual data, such as a social media post or customer review. Dataiku is able to handle raw text features with specific preprocessing. |
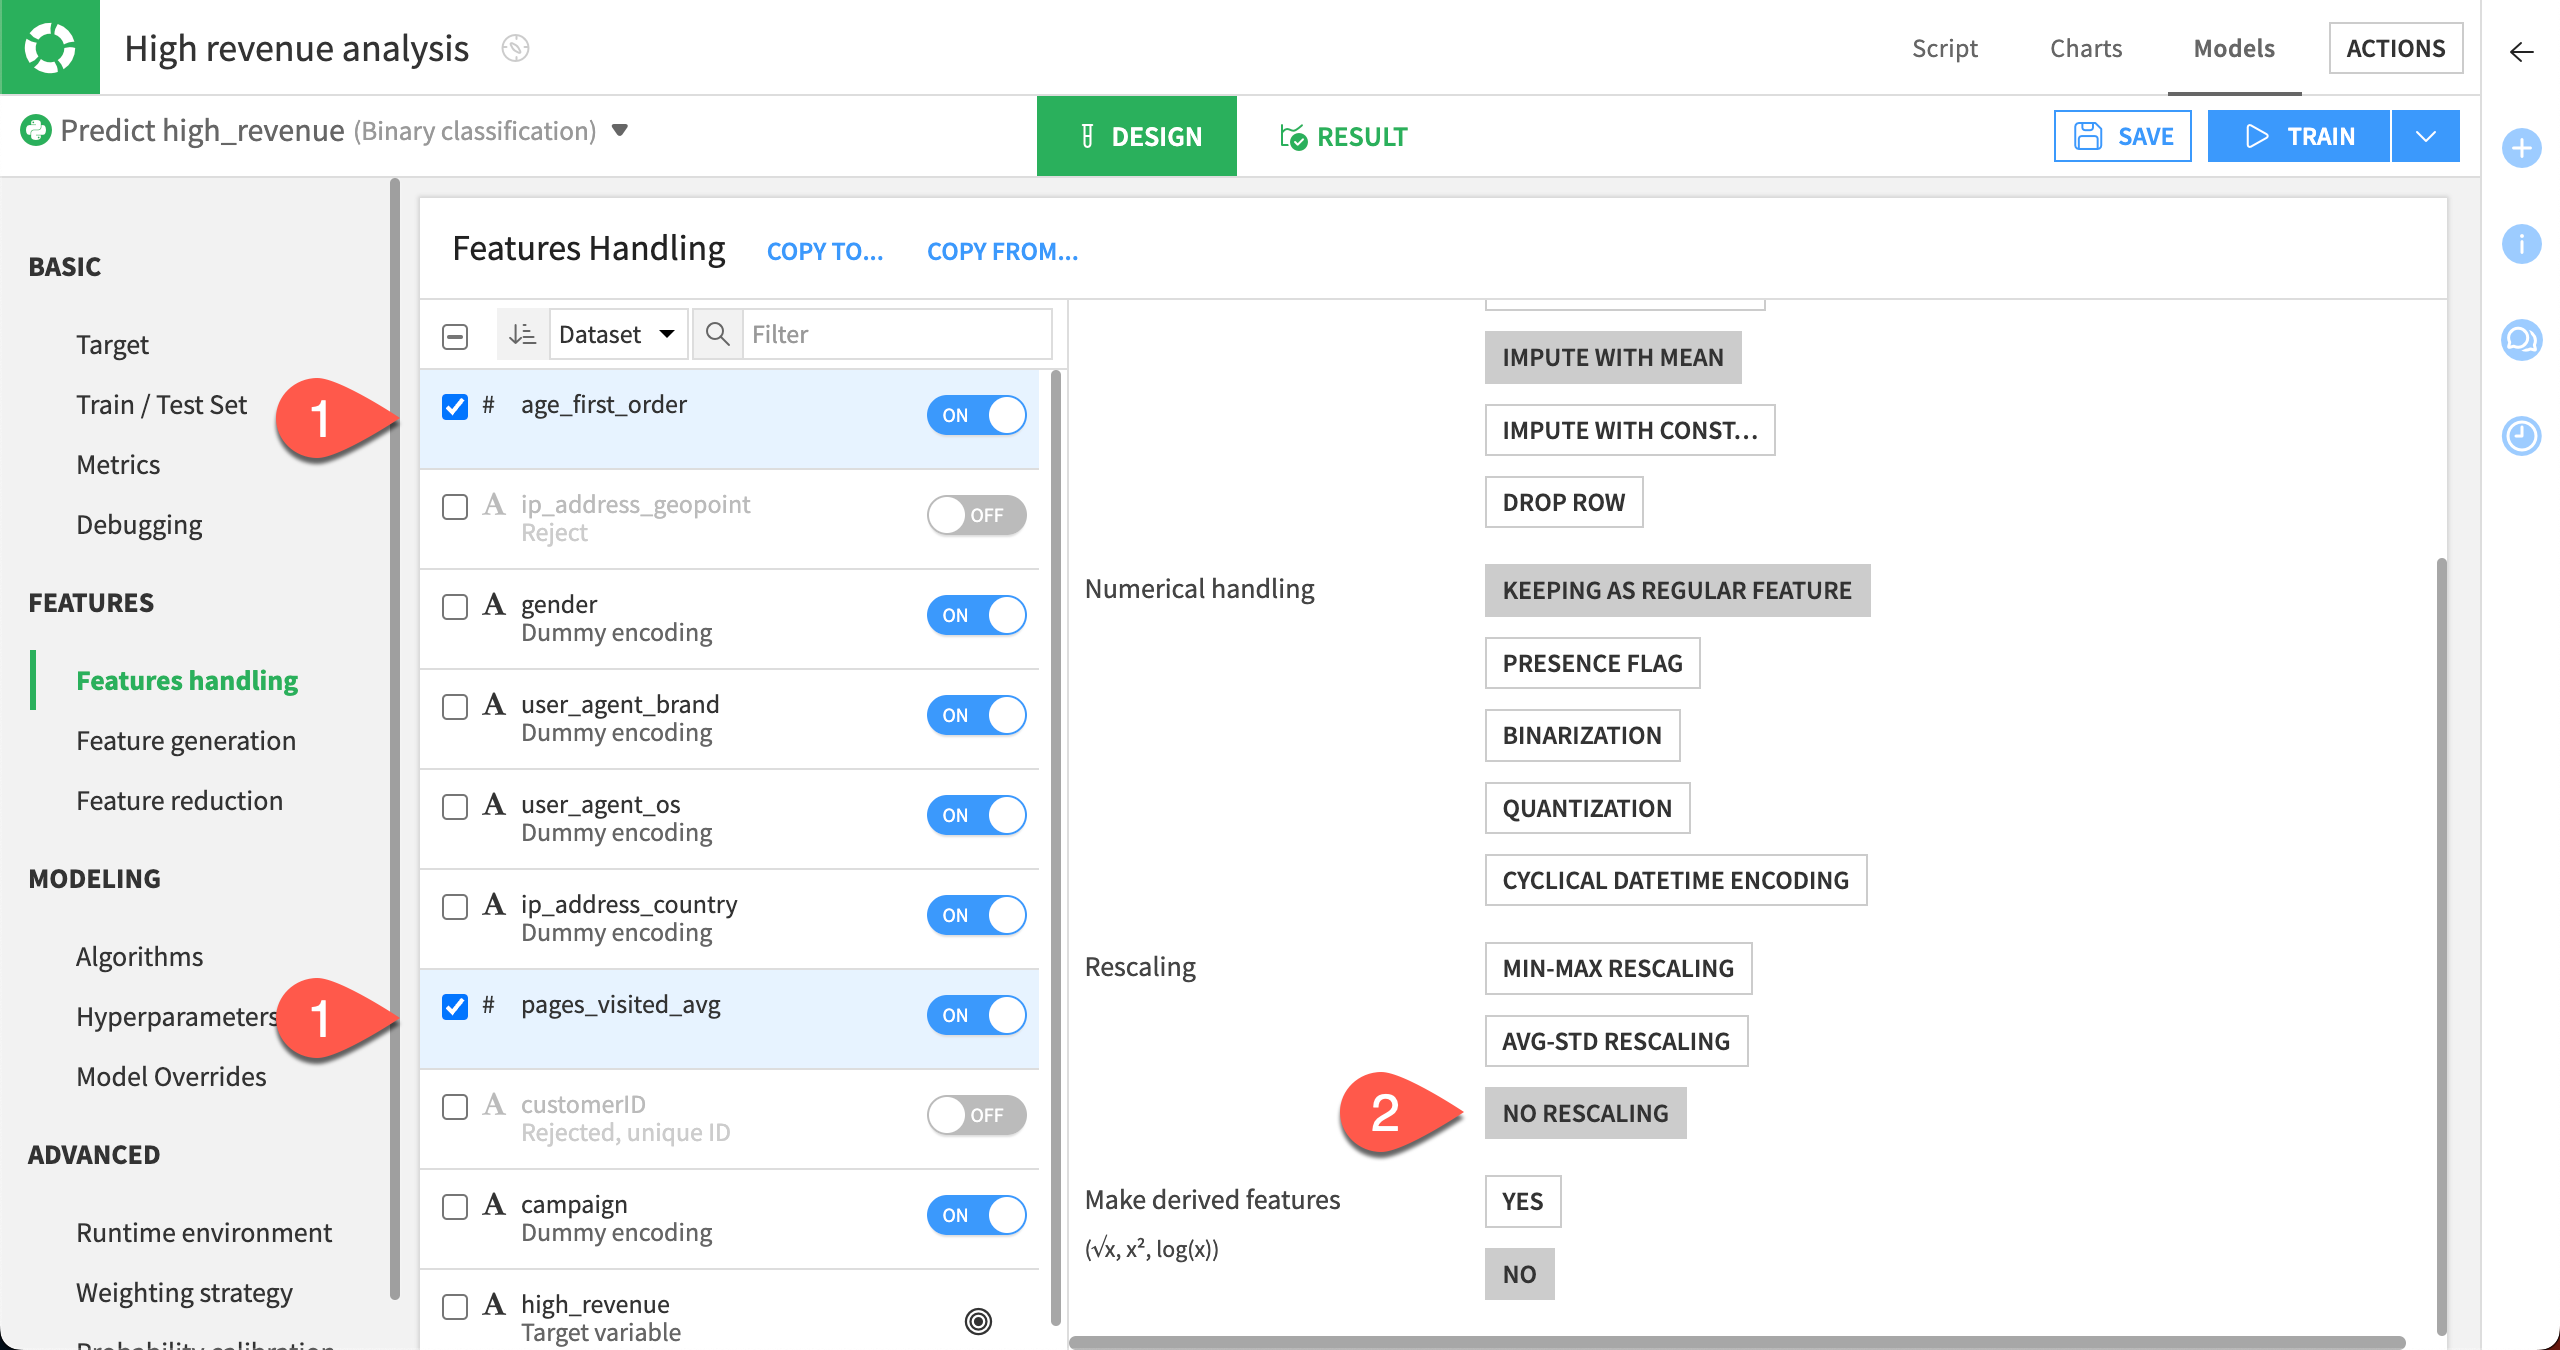
The numerical variables age_first_order and pages_visited_avg have been automatically normalized using a standard rescaling (this means that the values are normalized to have a mean of 0 and a variance of 1).
Let’s disable this behavior, and use No rescaling instead.
Select the checkboxes for the variables age_first_order and pages_visited_avg.
In the menu for handling the two selected features, under Rescaling, select No Rescaling.
Generate new features#
Generating new features can reveal unexpected relationships between the inputs (variables/features) and the target.
We can automatically generate new numeric features using Pairwise linear combinations and Polynomial combinations of existing numeric features.
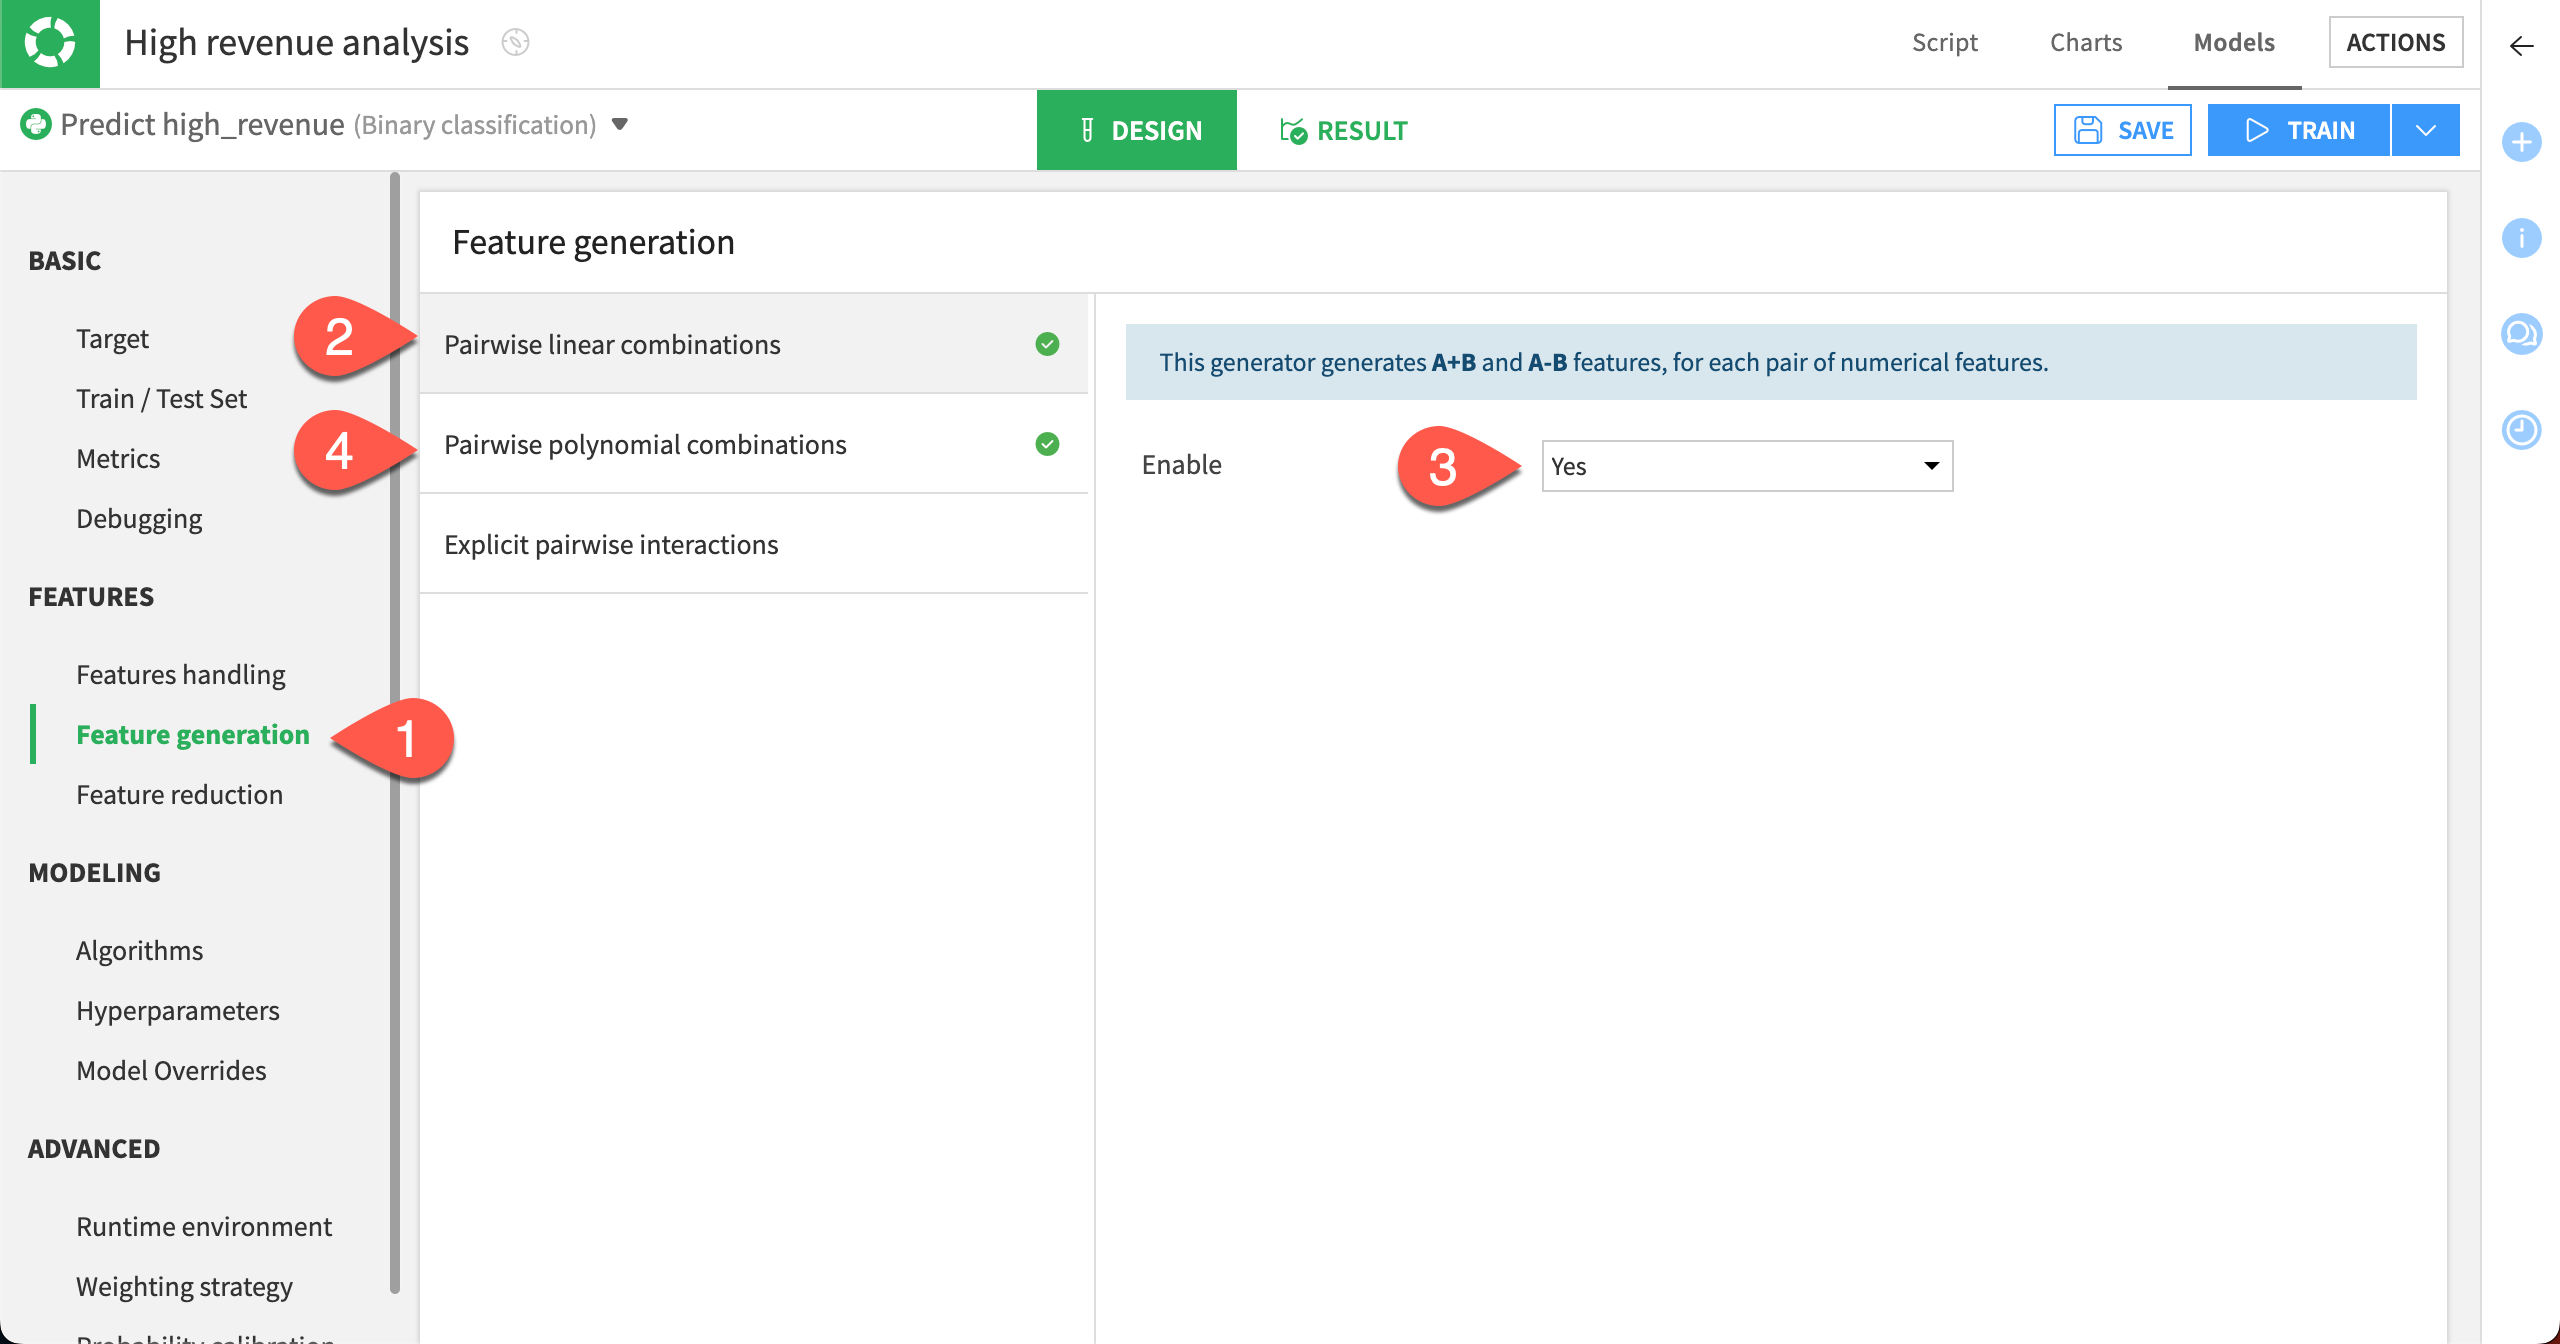
In the Features section, select the Feature generation panel.
Select Pairwise linear combinations.
Set Enable to Yes.
Select Pairwise polynomial combinations.
Set Enable to Yes.
Train new models#
After altering the Design settings, you can build some new models.
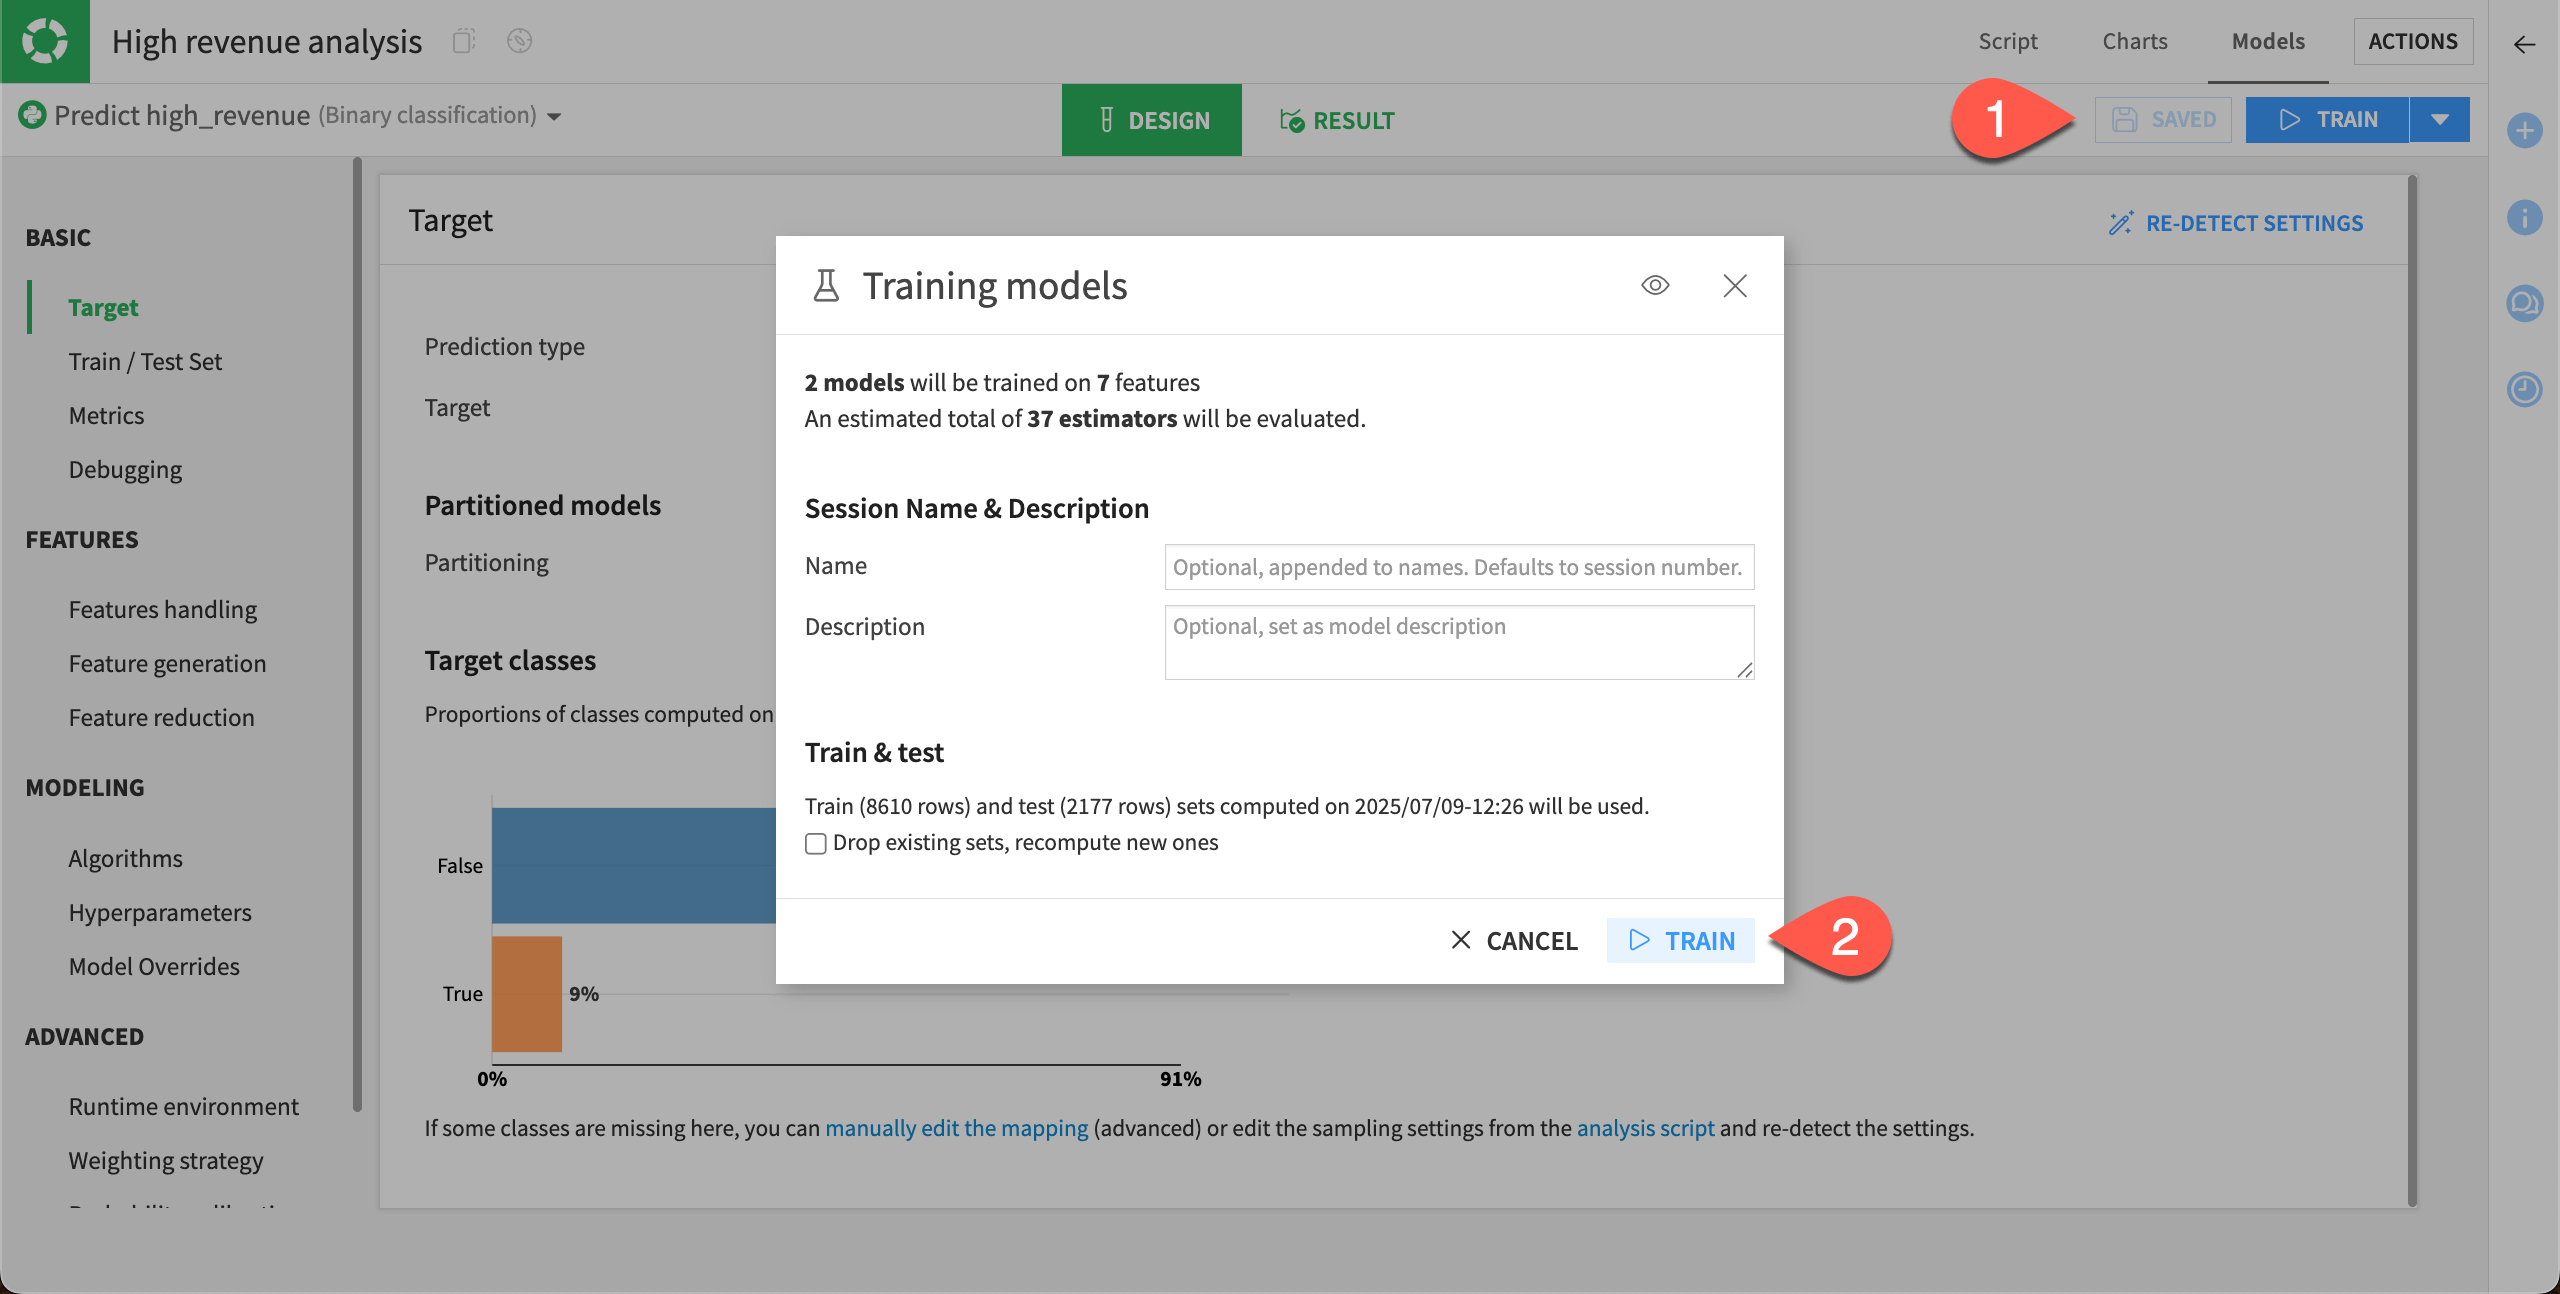
Select Save, and then click Train.
Select Train again to start the second training session.
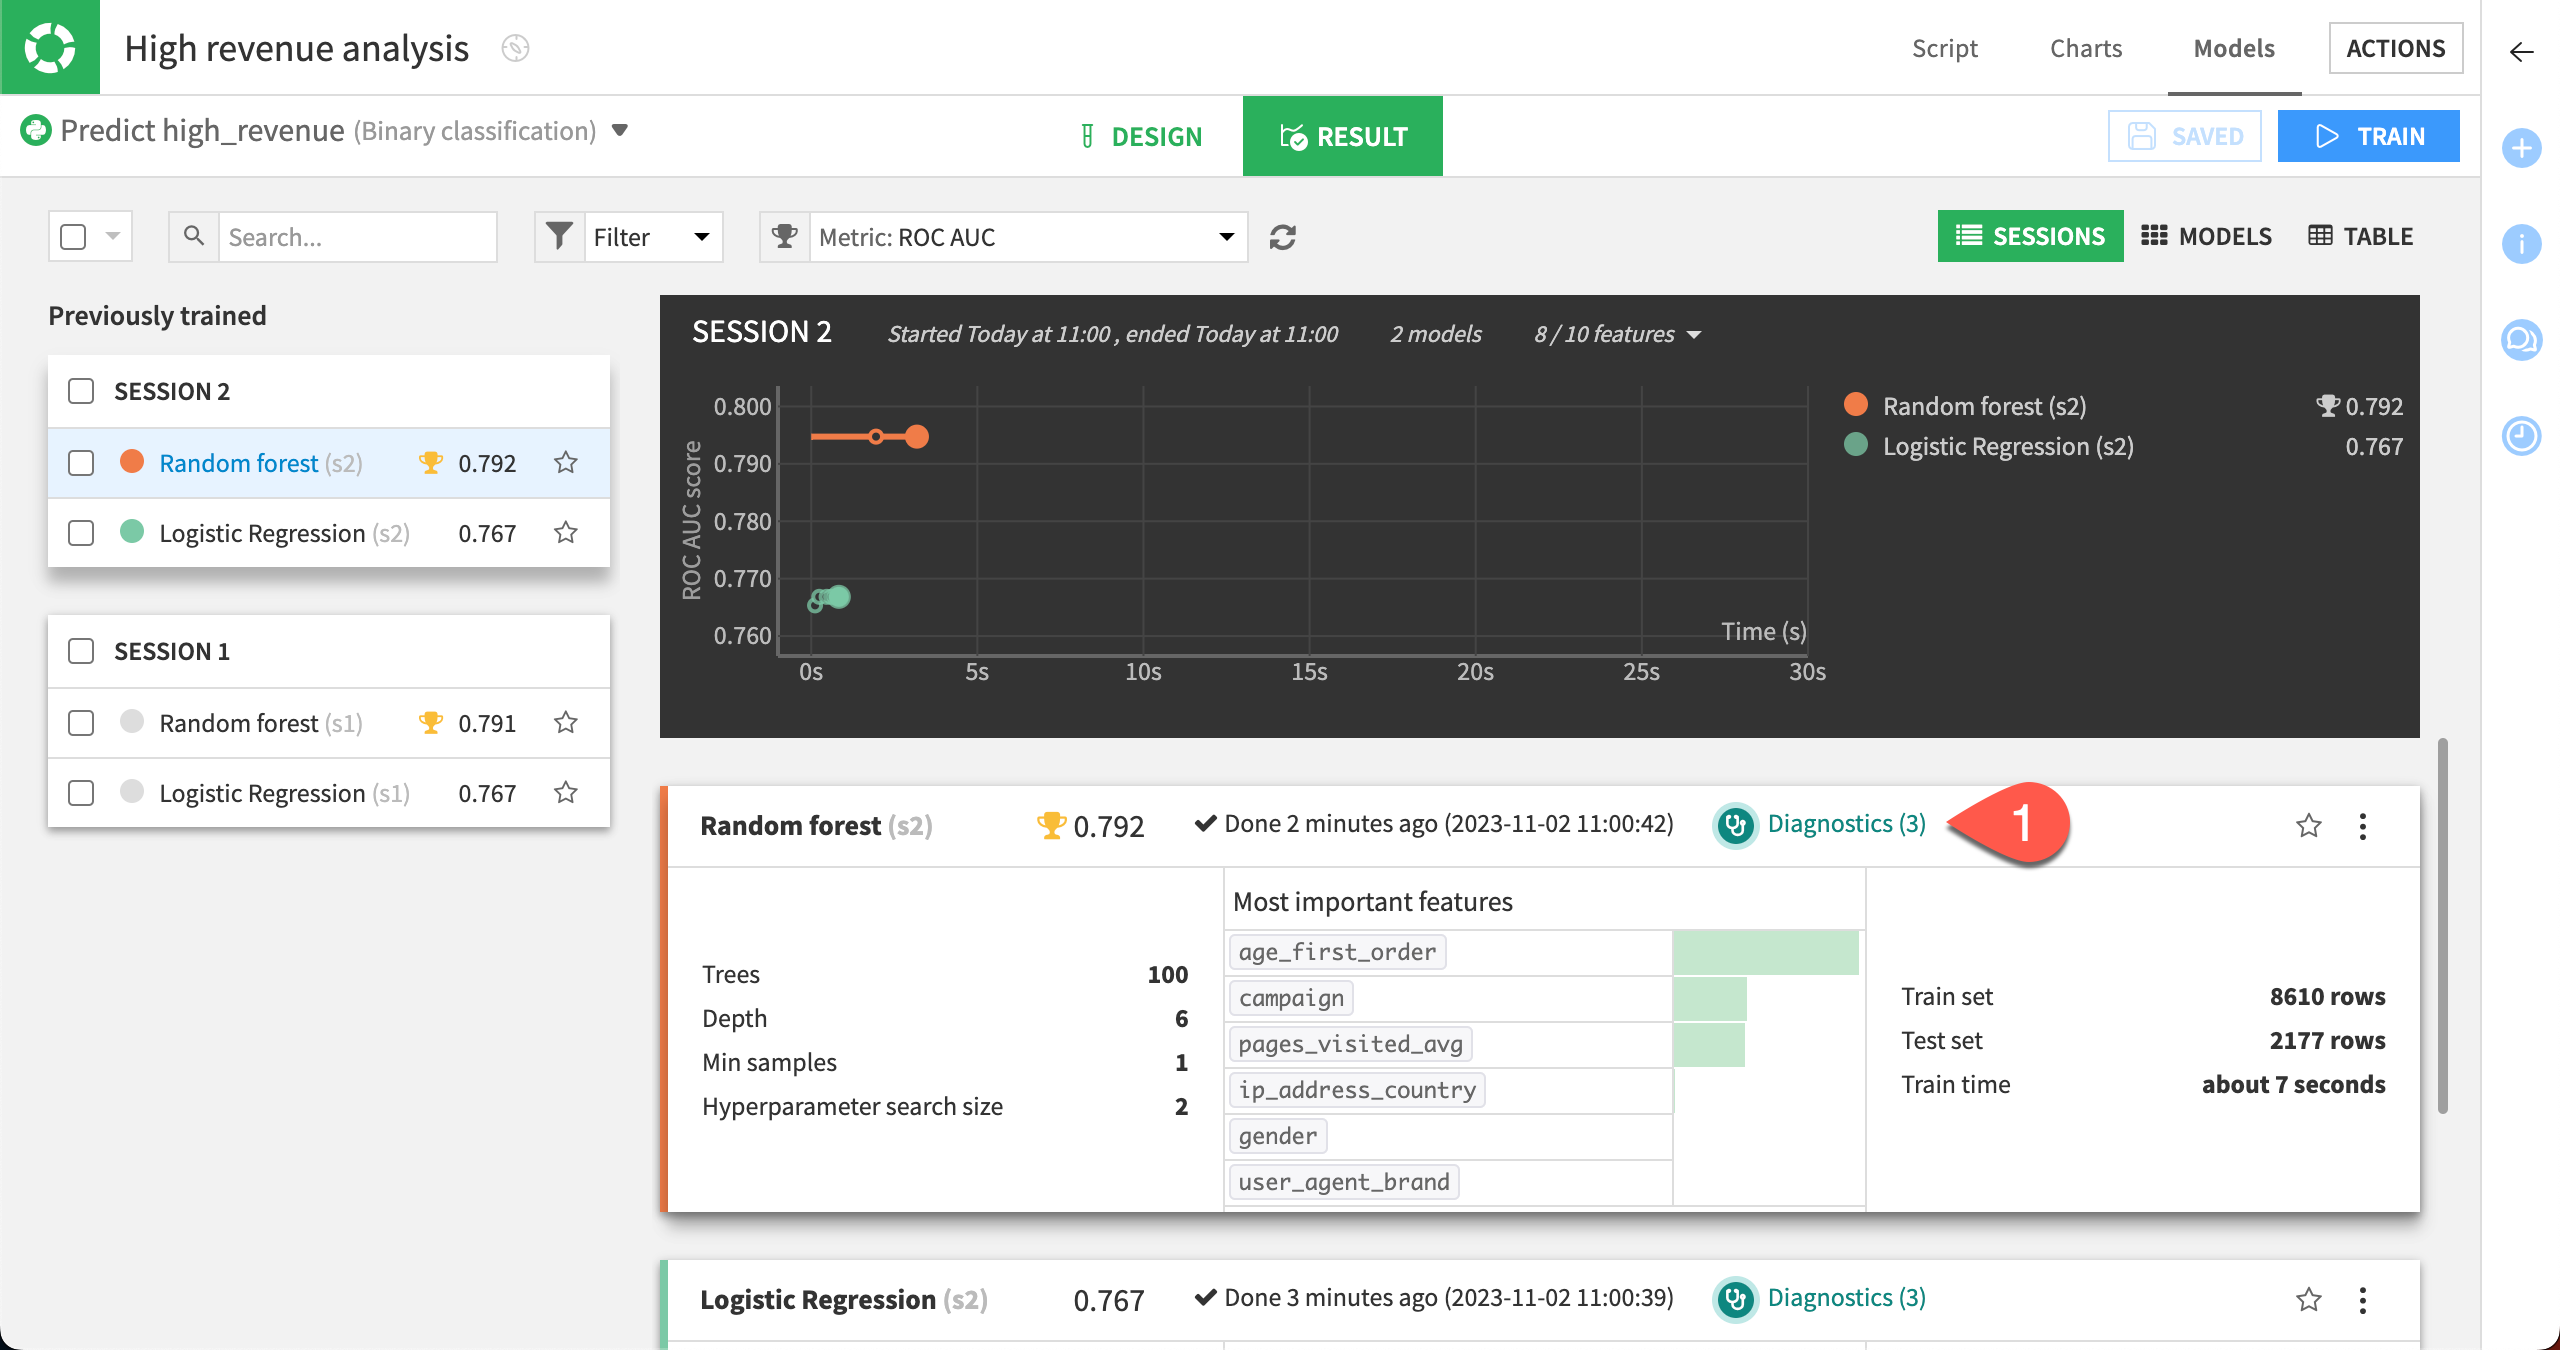
Once the session has completed, you can see that the performance of the random forest model has now slightly increased.
Evaluate the new models#
In our case, session 2 resulted in a Random Forest model with an AUC value that’s slightly higher than the first model.
Diagnostics#
When training is complete, we can go directly to ML diagnostics.
Select Diagnostics in the Result tab of the random forest model to view the results of the ML diagnostics checks.
Dataiku displays Model Information > Training information. Here, we can view warnings and get advice to avoid common pitfalls, including if a feature has a suspiciously high importance — which could be due to a data leak or overfitting.
This is like having a second set of eyes that provide warning and advice, so that you can identify and correct these issues when developing the model.
Feature importance#
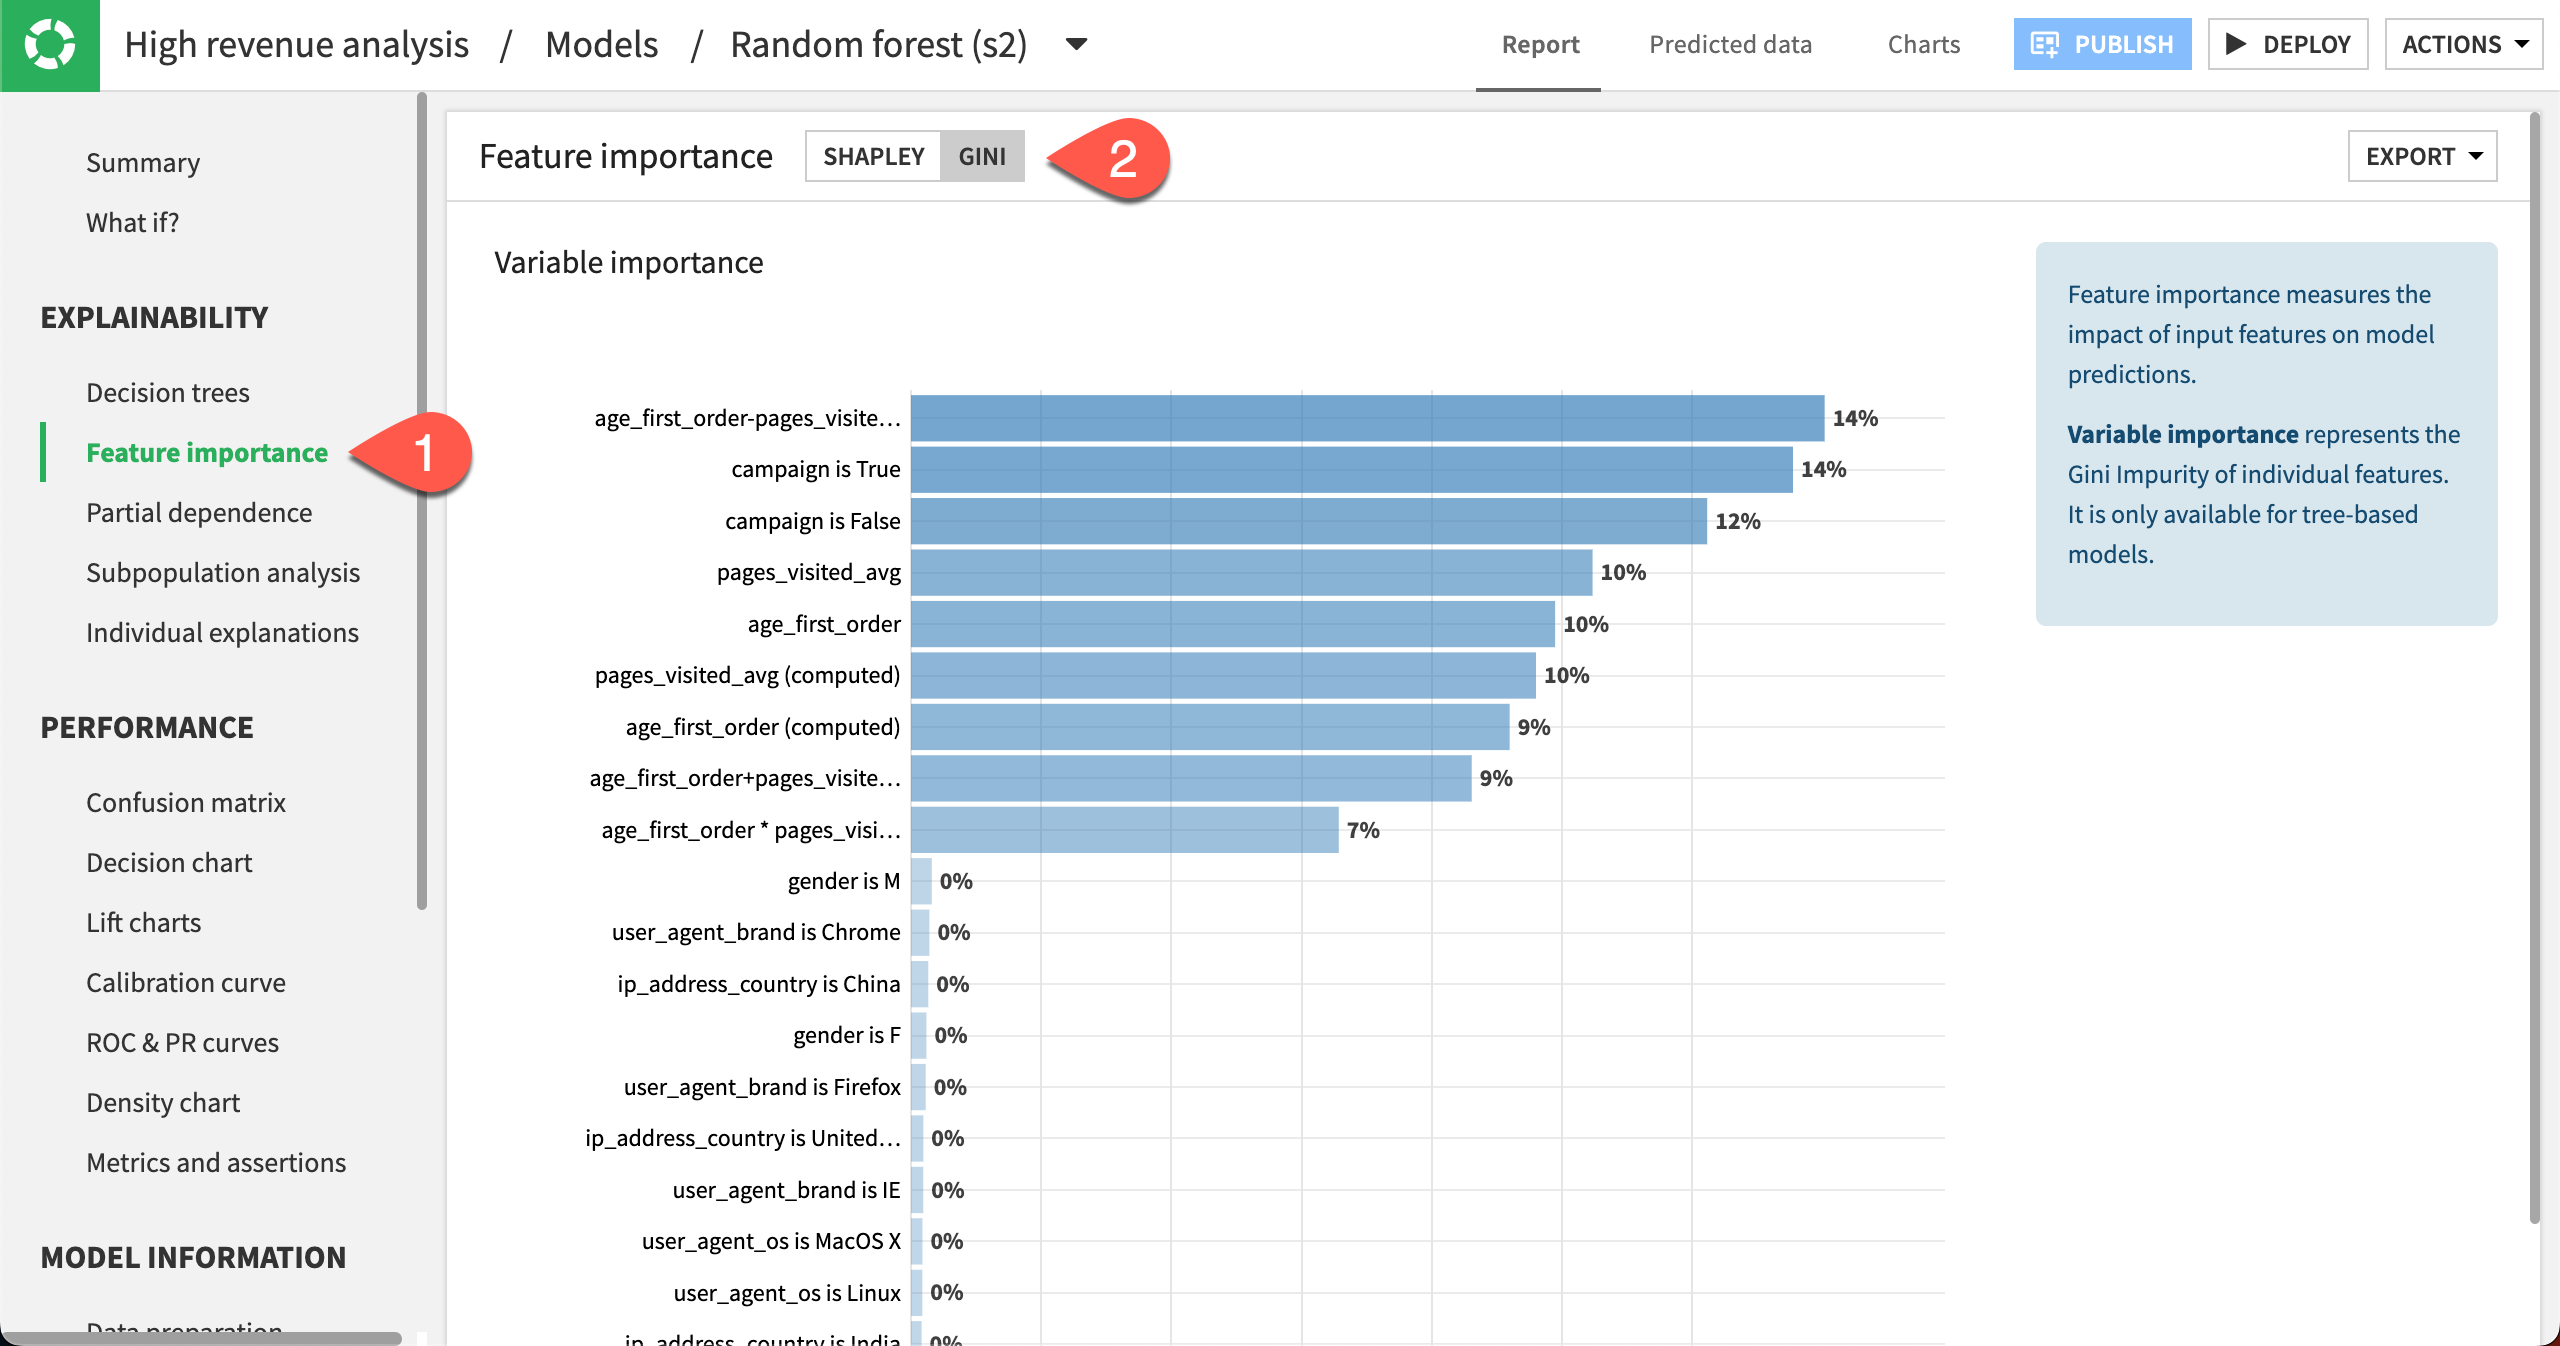
Finally, let’s look at the Feature importance charts for the latest model.
Select Feature importance in the Explainability section.
At the top of the page, change the Feature importance method to Gini to view the Variable importance chart.
We can see that the importance is spread across the campaign variable along with the features automatically generated from age_first_order and pages_visited_avg. The generated features may have uncovered some previously hidden relationships.
You can also switch the Feature importance method back to Shapley to view more feature importance charts such as Feature effects and Feature dependence plots.
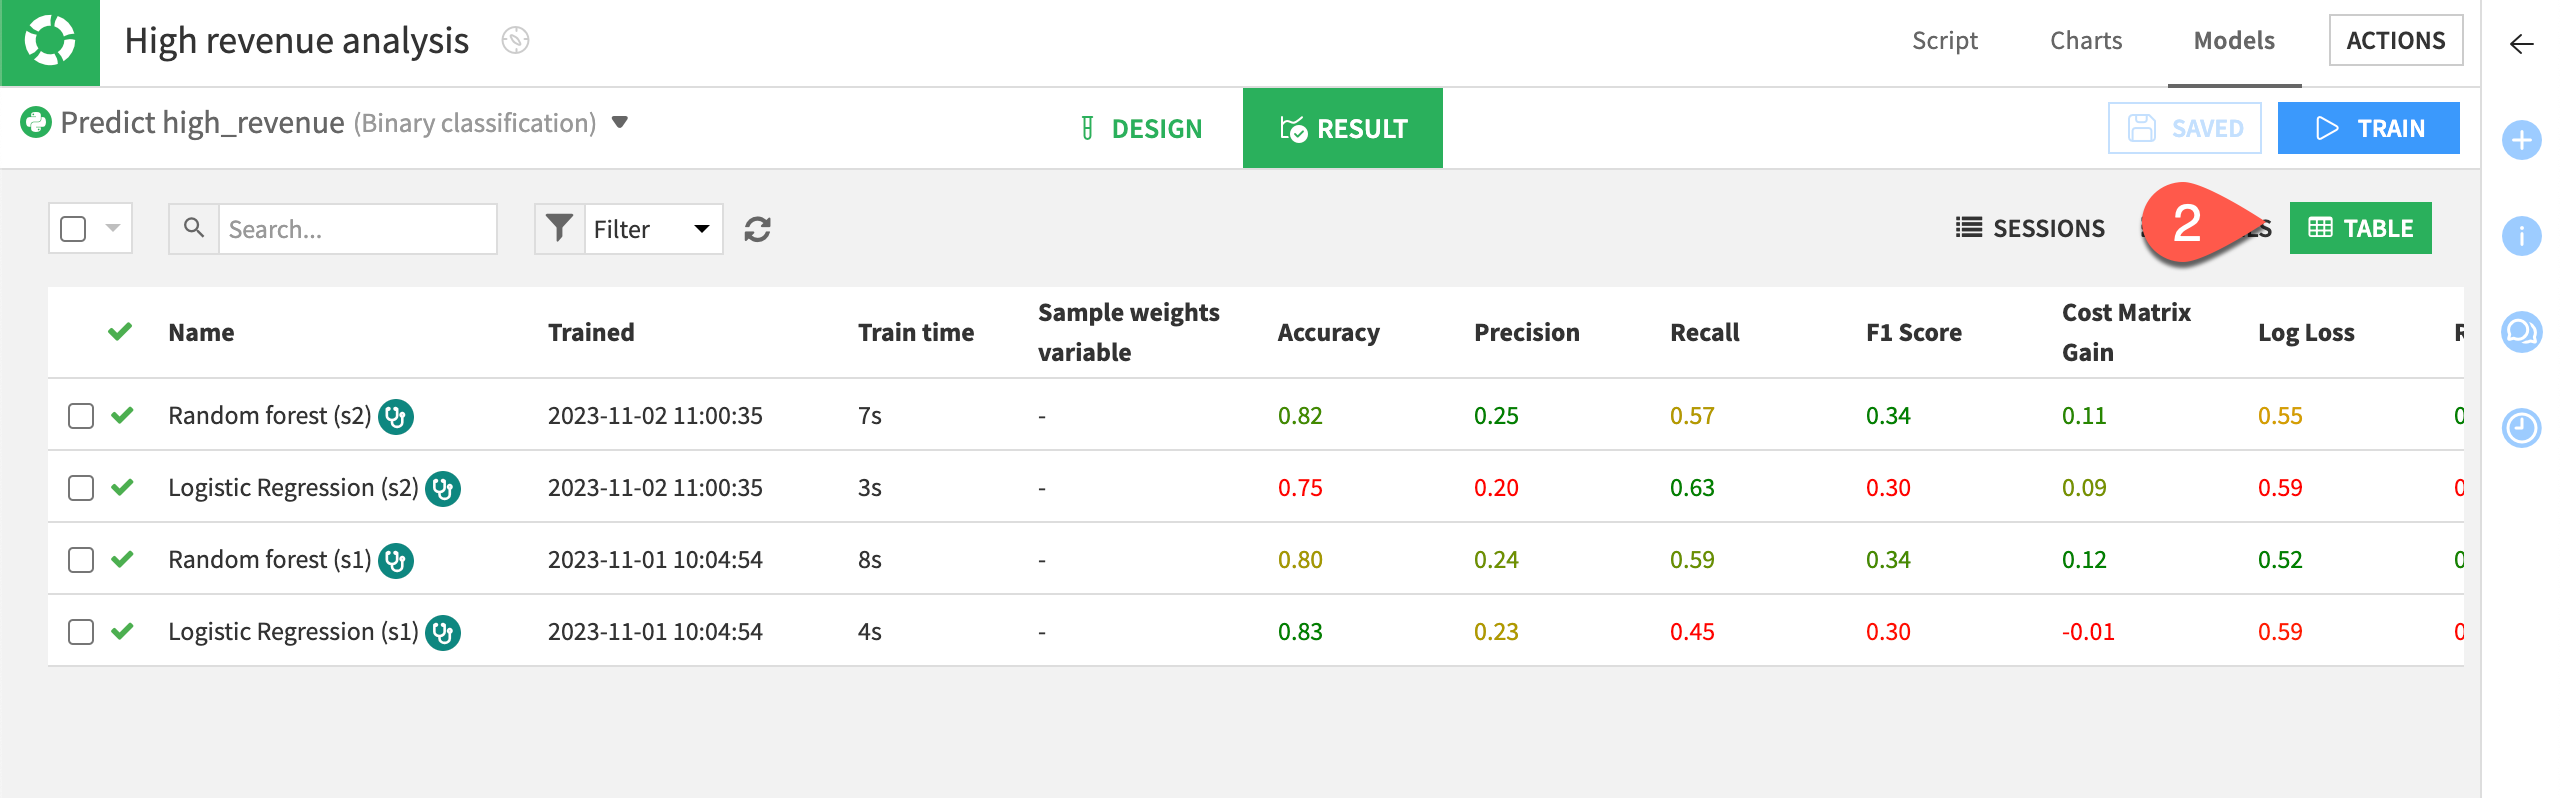
Table view#
Now that you have trained several models, all the results may not fit your screen. To see all your models at a glance:
Go back to the Result tab. You can do this by clicking on Models in the High revenue analysis/Models/Randomforest (s2) title.
Switch to the Table view.
You can sort the Table view on any column, such as ROC AUC. To do so, just click on the column title.