
A batch workflow within Dataiku#
Many data science workloads call for a batch deployment framework.
As a means of comparison to other deployment contexts, this section presents how to monitor a model under a batch deployment framework staying entirely within Dataiku.
Additional prerequisites#
For this case, you’ll only need to satisfy the requirements included in the shared prerequisites, including creating the starter project found there.
Score data within Dataiku#
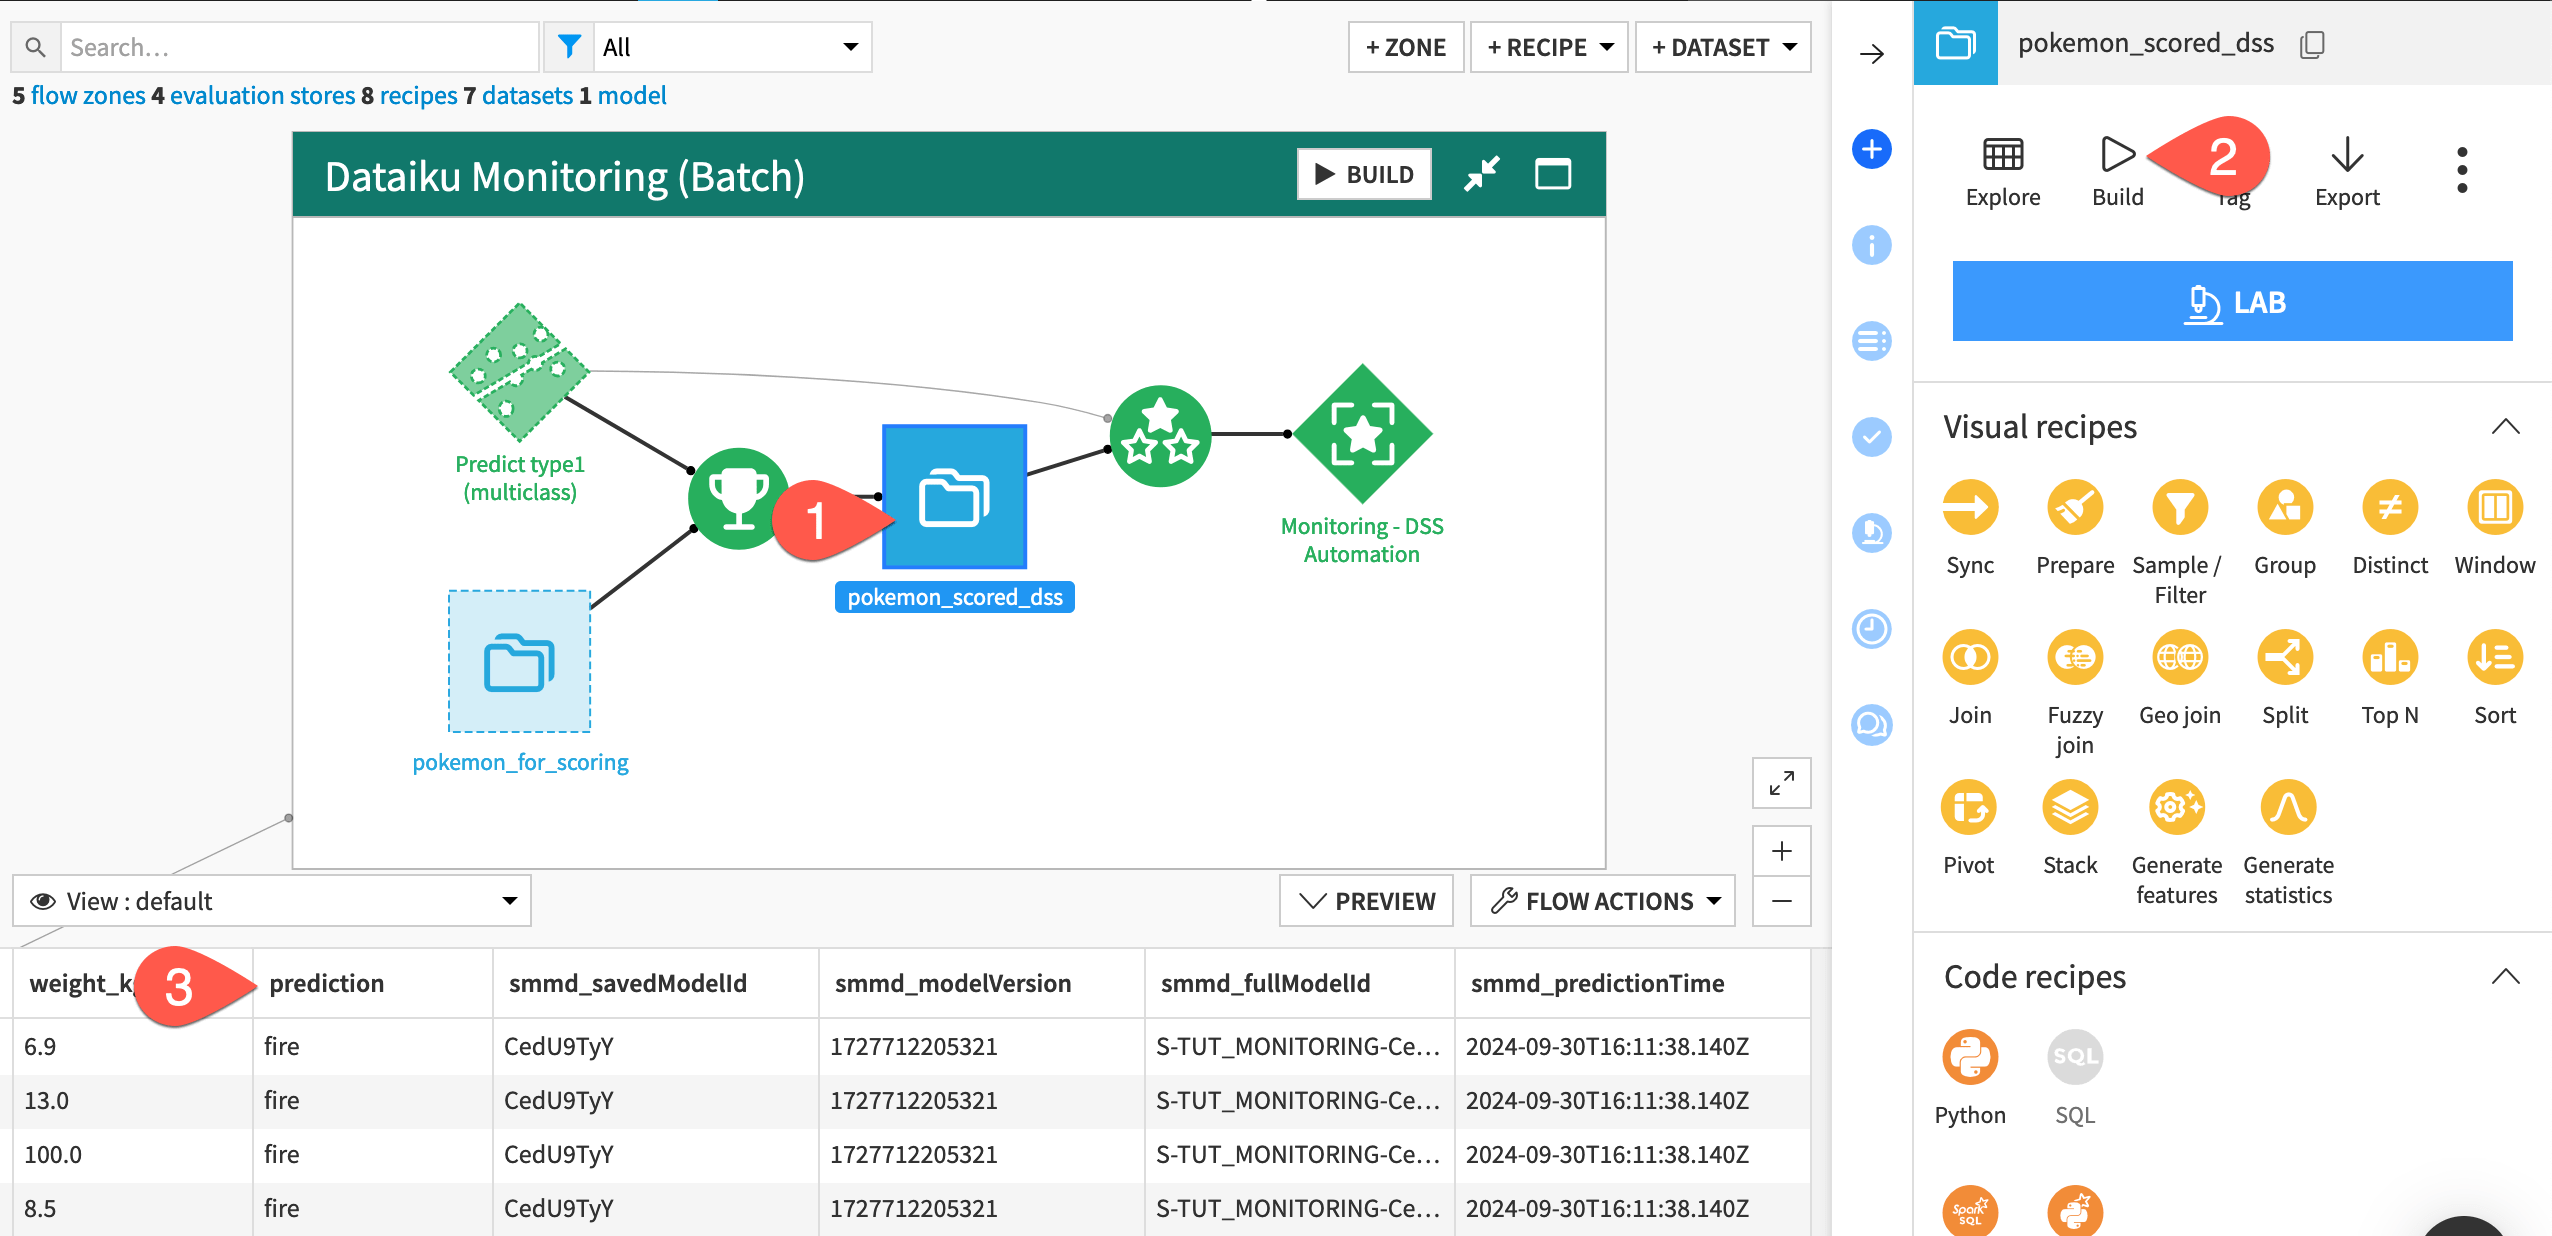
For this case, you’ll be using the Dataiku Monitoring (Batch) Flow zone found in the starter project.
In the Dataiku Monitoring (Batch) Flow zone, select the pokemon_scored_dss dataset.
Click Build > Build Dataset with the Build Only This setting to run the Score recipe.
Before moving to the monitoring setup, examine the schema of the output to the Score recipe compared to the input. You should notice the addition of a prediction column containing the predicted type of Pokemon.
Note
You’ll notice that, in addition to a prediction column, the schema of the pokemon_scored_dss dataset includes four columns beginning with smmd_. This is because the parent Score recipe chose to output model metadata.
Monitor model metrics#
The monitoring setup in this case is the same as that presented in Tutorial | Model monitoring with a model evaluation store, but let’s review the core tenets for completeness.
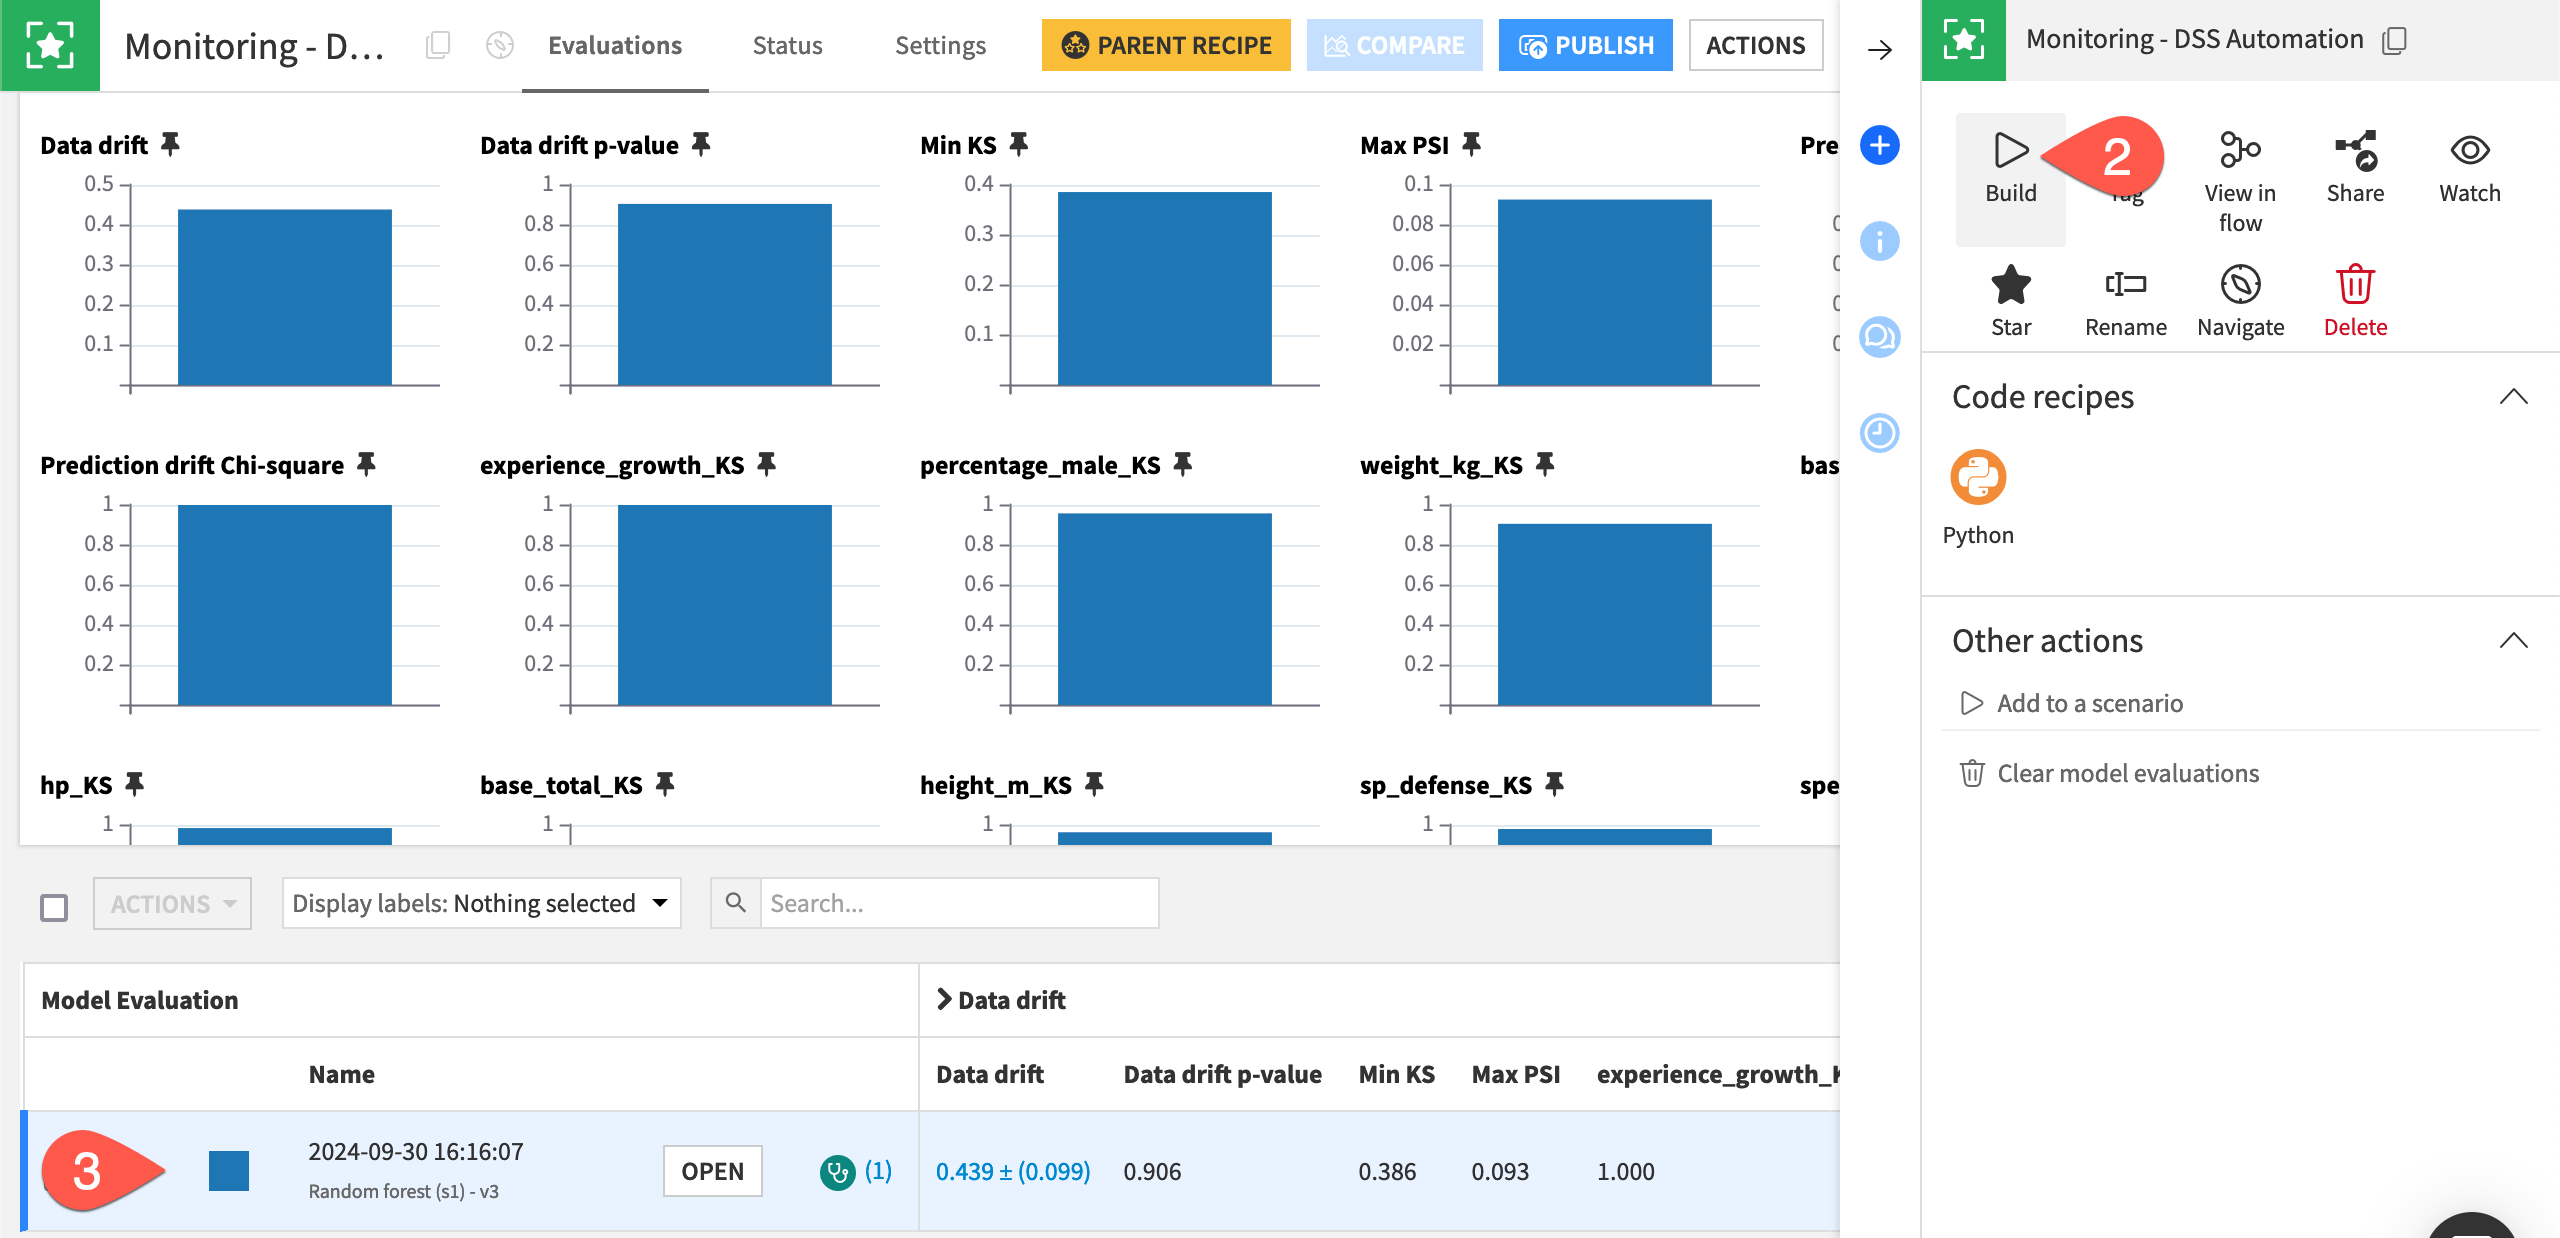
In Dataiku’s world, the Evaluate recipe takes a saved model and an input dataset of predictions. It computes model monitoring metrics and stores them in a model evaluation store (MES). This case assumes the ground truth is unavailable and so doesn’t compute performance metrics.
In the Dataiku Monitoring (Batch) Flow zone, open the empty model evaluation store called Monitoring - DSS Automation.
From the Actions tab of the right panel, click Build > Build Evaluation Store, thereby running the Evaluate recipe.
When the job finishes, refresh the page to find one model evaluation.
See also
Review the reference documentation on model evaluations if this is unfamiliar to you.
Automate model monitoring#
The same automation toolkit of metrics, checks, and scenarios that you find for Dataiku objects like datasets also is available for model evaluation stores.
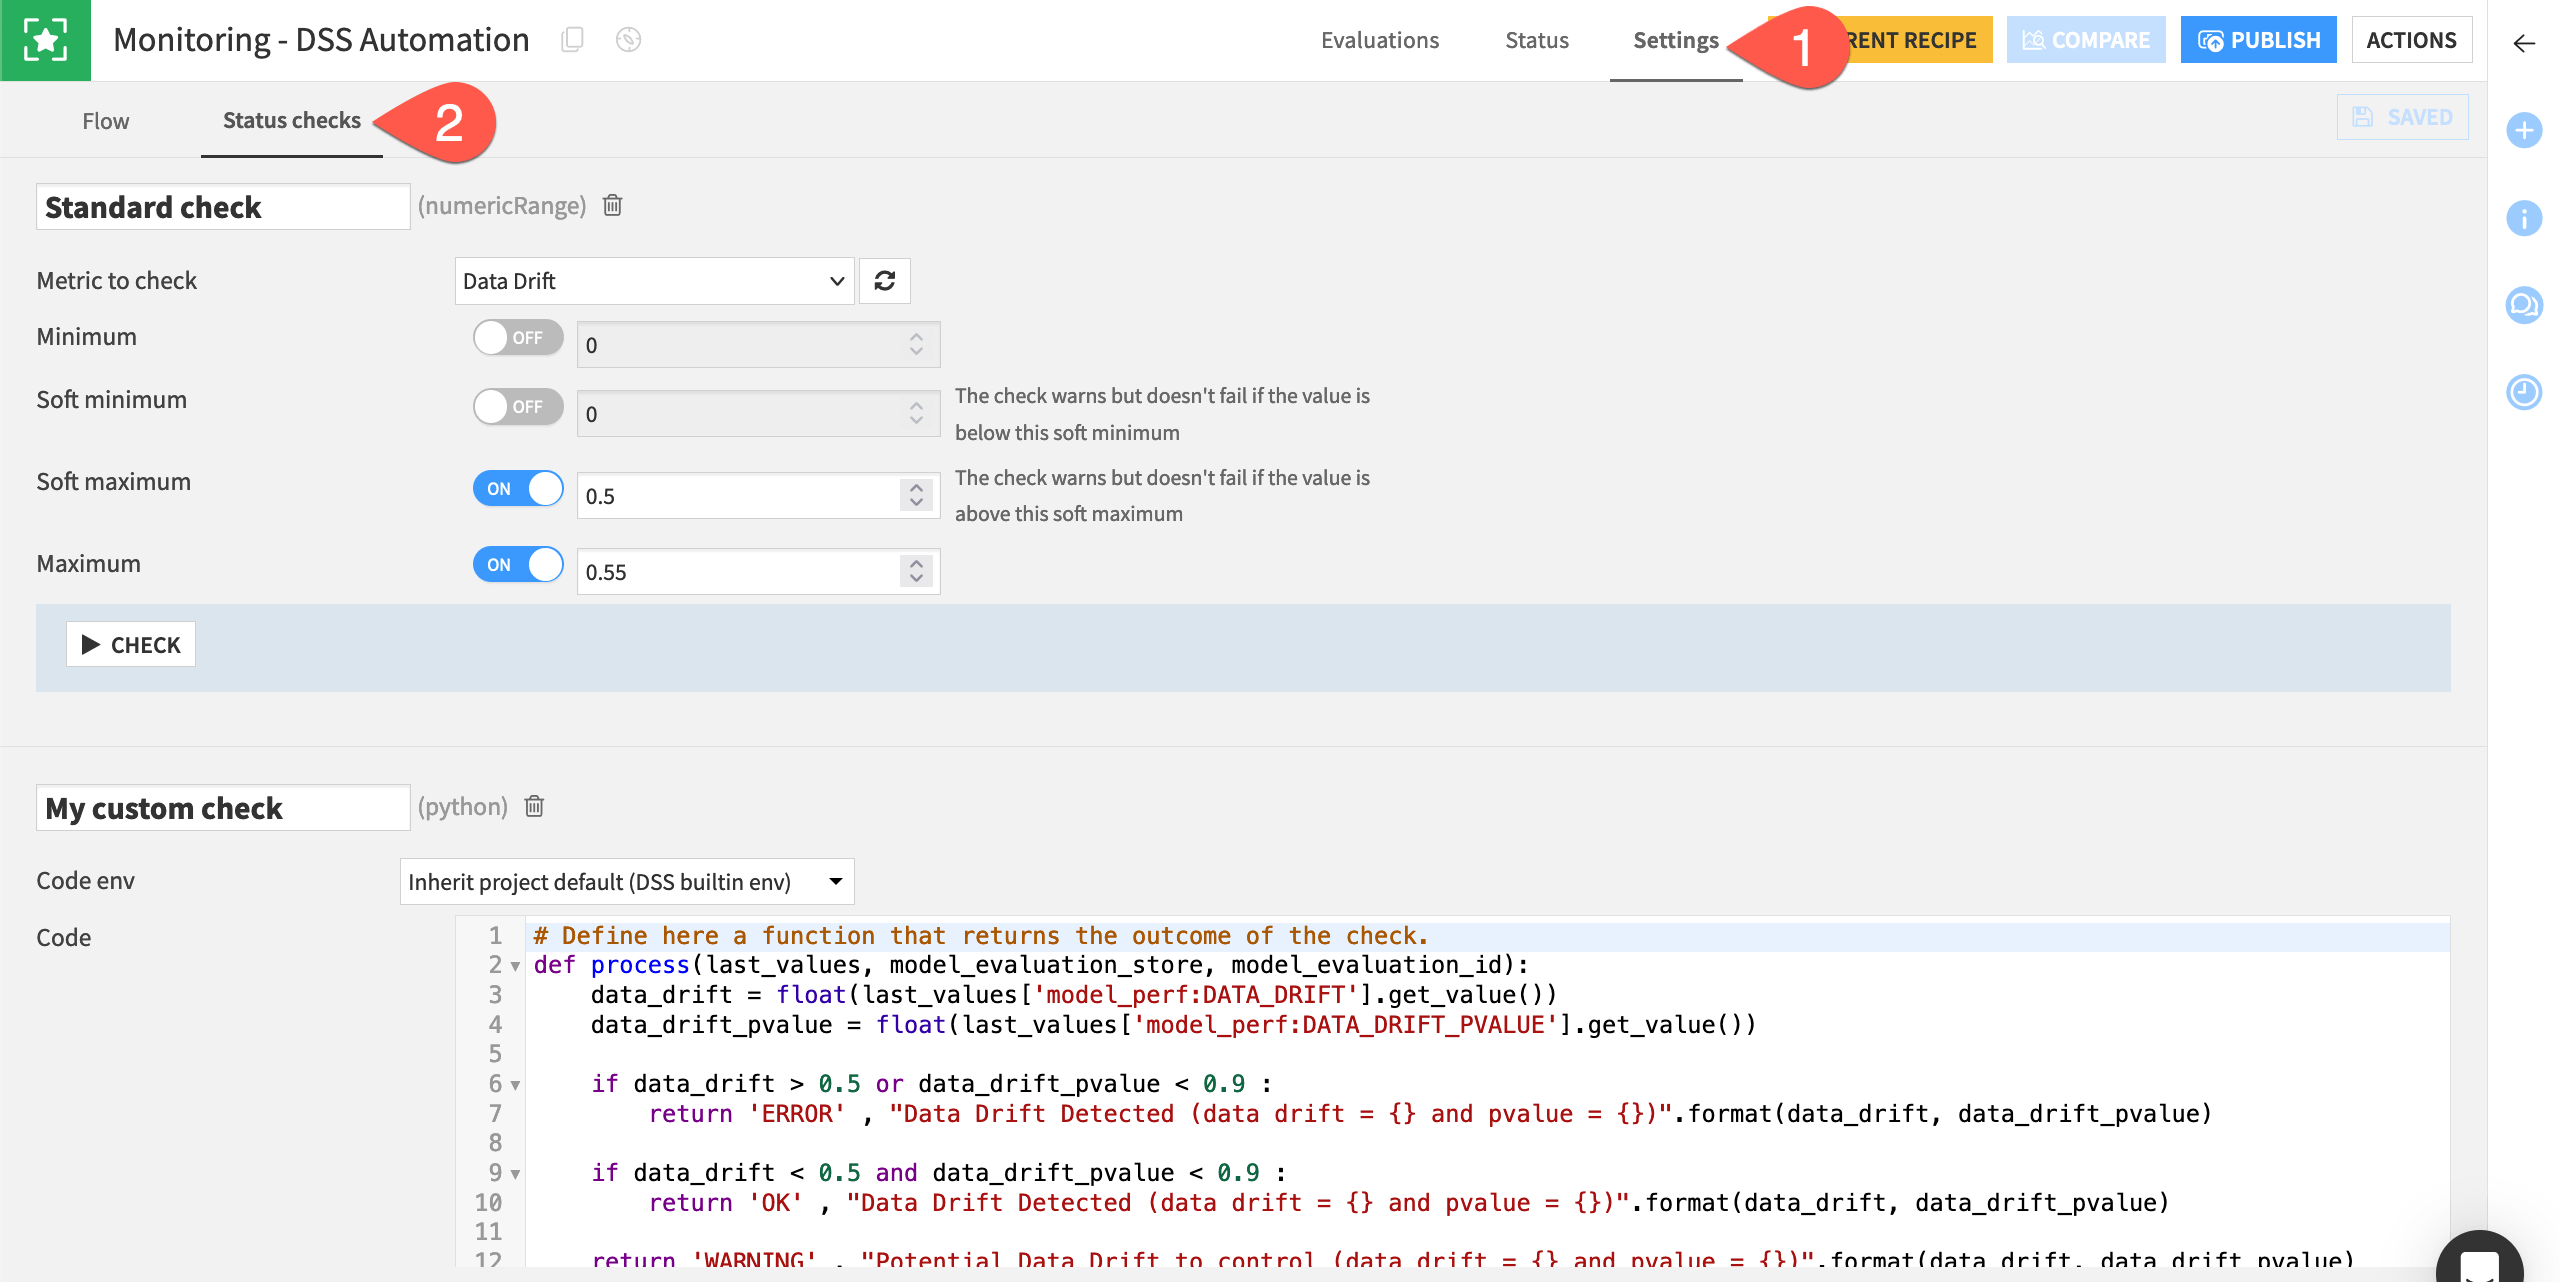
Within the Monitoring - DSS Automation MES, navigate to the Settings tab.
Go to the Status Checks subtab.
Observe the example native and Python checks based on the data drift metric.
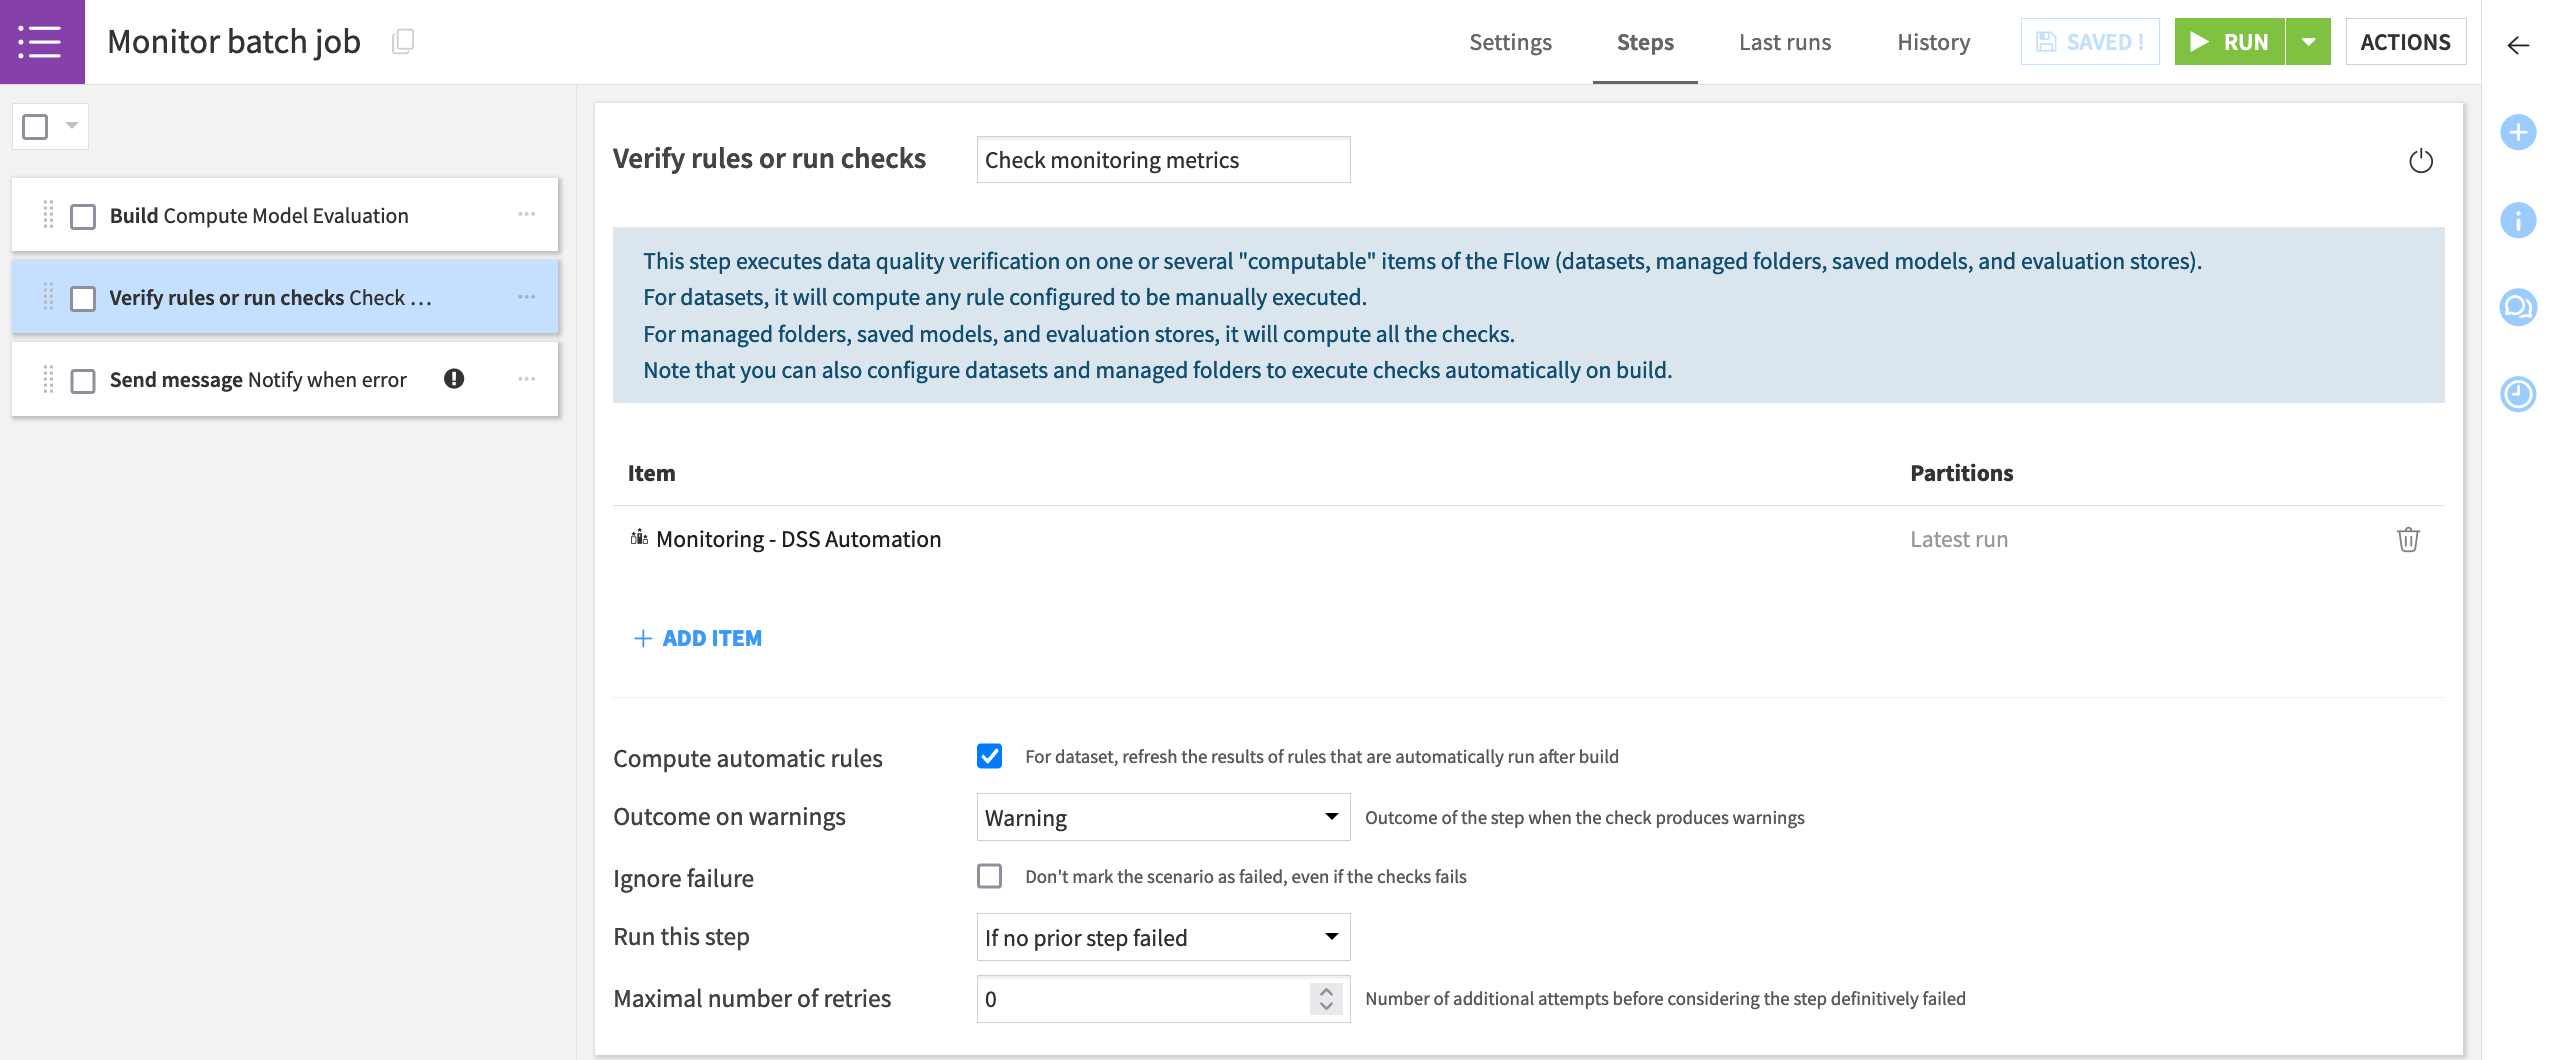
With acceptable limits for each chosen metric formally defined in checks, you can then leverage these objects into a scenario. For example, the Monitor batch job scenario included in the project:
Computes the model evaluation with the data at hand.
Runs checks to determine if the metrics have exceeded the defined threshold.
Sends alerts if any checks return an error or trigger other actions.
Note
The Monitor batch job scenario found in the project uses a Microsoft Teams webhook, but many other reporters are available.
You’ll also notice that the scenario has no trigger attached. Determining how often your scenario should run is highly dependent on your specific use case, but you’ll want to make sure you have enough data for significant comparisons.
Push to the Automation node#
This article presents the basis of building a working operationalized project that will automatically batch score, monitor, and alert. Although simple, it highlights the main components to use such as the Evaluate recipe, the model evaluation store, and scenarios controlled by metrics, checks, and/or data quality rules.
This simplified example performed both scoring and monitoring on the Design node. However, in a real-life batch use case contained within Dataiku’s universe, both scoring and monitoring should occur on an Automation node. To produce a consistent and reliable Flow, real life cases require a true production environment, separate from the development environment.
Accordingly, the next steps would be to:
Create a project bundle on the Design node.
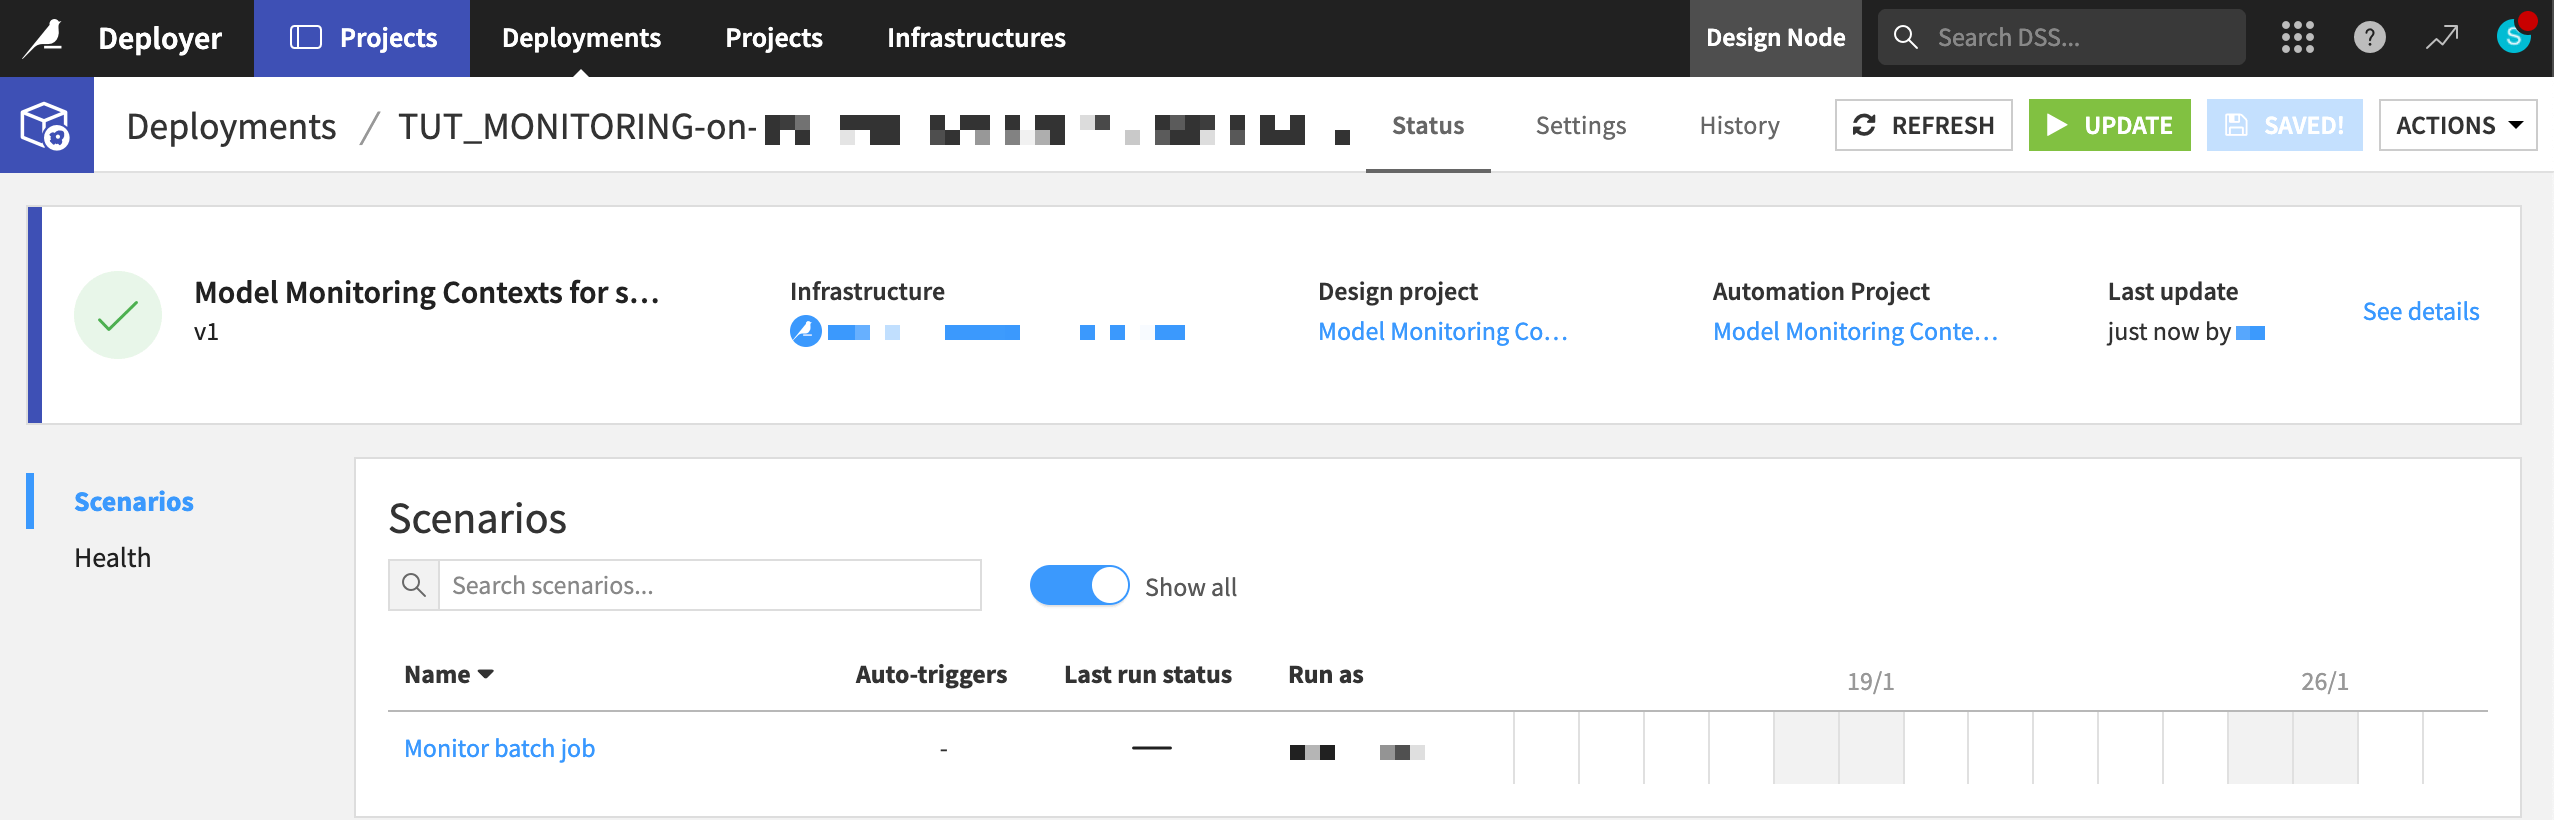
Publish the bundle to the Project Deployer (shown below).
Deploy the bundle to the Automation node.
Run scenarios on the Automation node for both the scoring and monitoring — the entire Flow zone Dataiku Monitoring (Batch).
Tip
Follow the Tutorial | Deploy a project bundle to a production environment for a walkthrough of these steps.