An API endpoint on a Dataiku API node#
Many data science workloads call for a real-time API framework. In this framework, queries sent to an API endpoint receive an immediate response.
As a means of comparison to other deployment contexts, this section presents how to monitor a model under a real-time API framework staying entirely within Dataiku.
Additional prerequisites#
In addition to the shared prerequisites, you’ll also need:
A Design node connected to the API Deployer and an API node.
Consult the documentation for setting up an API node from the Launchpad and accessing API query logs.
A Design node connected to the API Deployer and an API node.
The Event server installed and configured for audit logging.
Deploy the model as an API endpoint#
The starter project already contains the API endpoint to be monitored. The next step is pushing a version of an API service including the endpoint to the API Deployer.
From the top navigation bar, navigate to More Options (
 ) > API Designer.
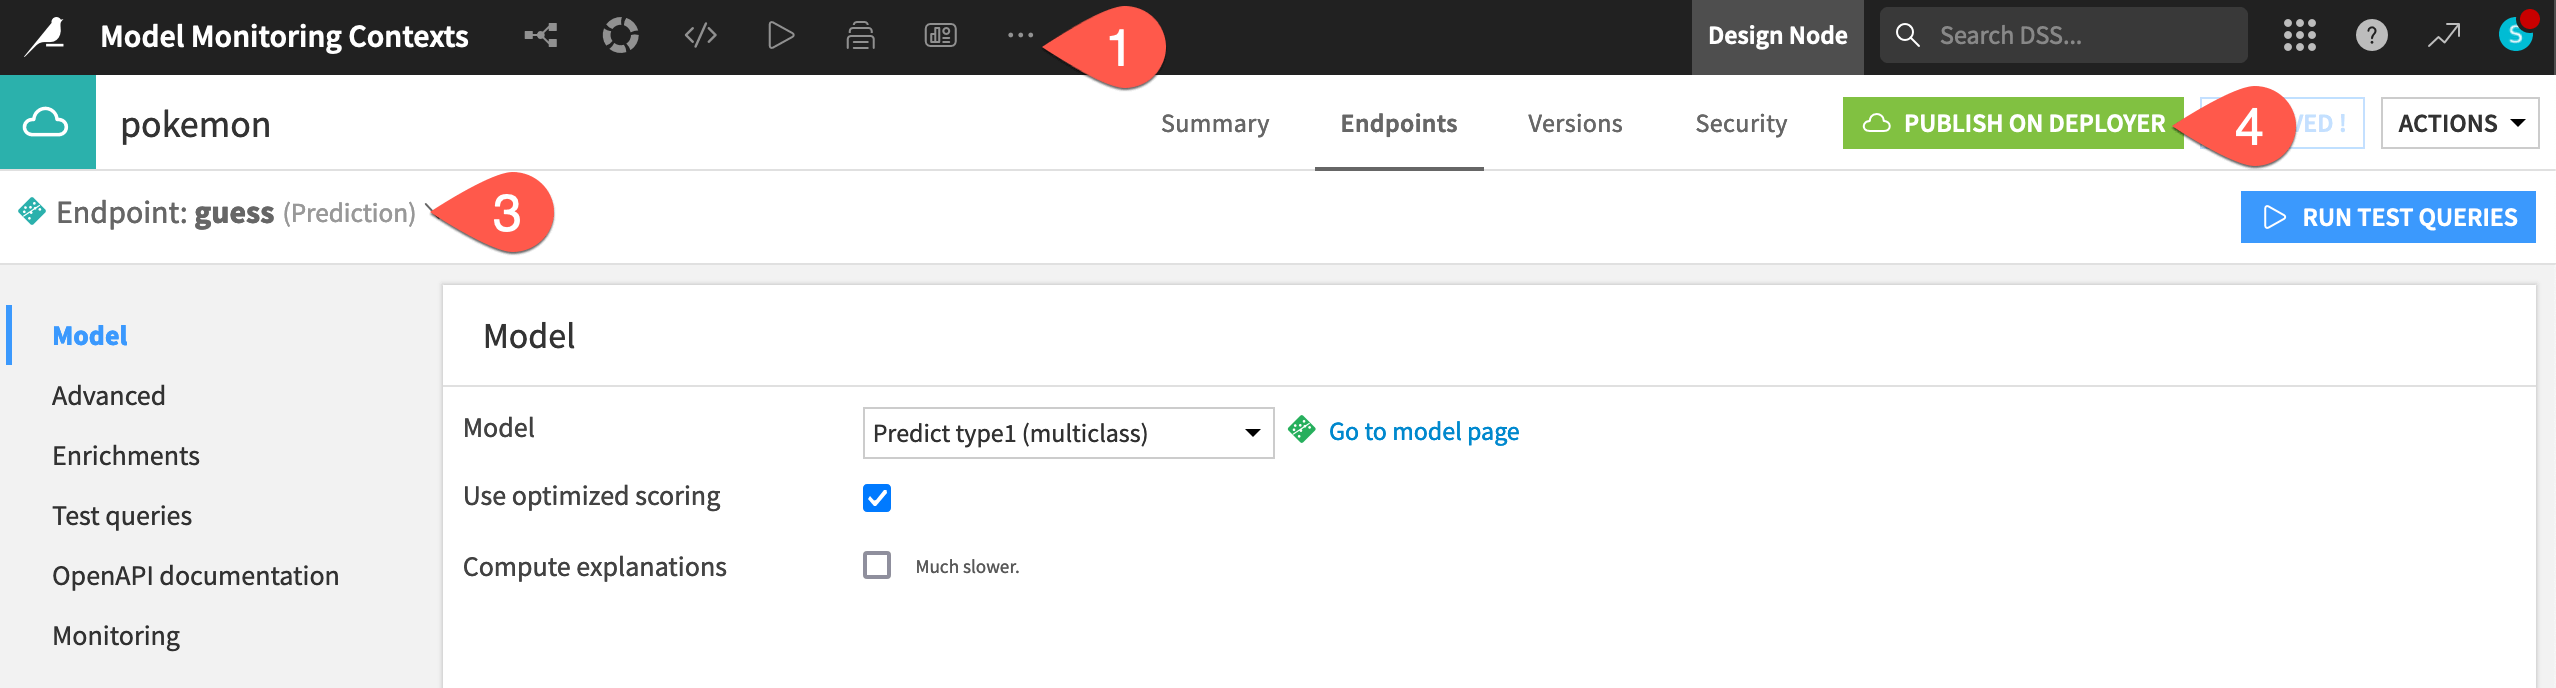
Open the pokemon API service.
Note how it includes one prediction endpoint called guess using the model found in the Flow.
Click Publish on Deployer and Publish to confirm publishing v1 of the service to the API Deployer.
Once the API service exists on the API Deployer, you can deploy the service to an infrastructure.
From the waffle (
 ) menu in the top navigation bar, click Local (or Remote) Deployer.
Click Deploying API Services.
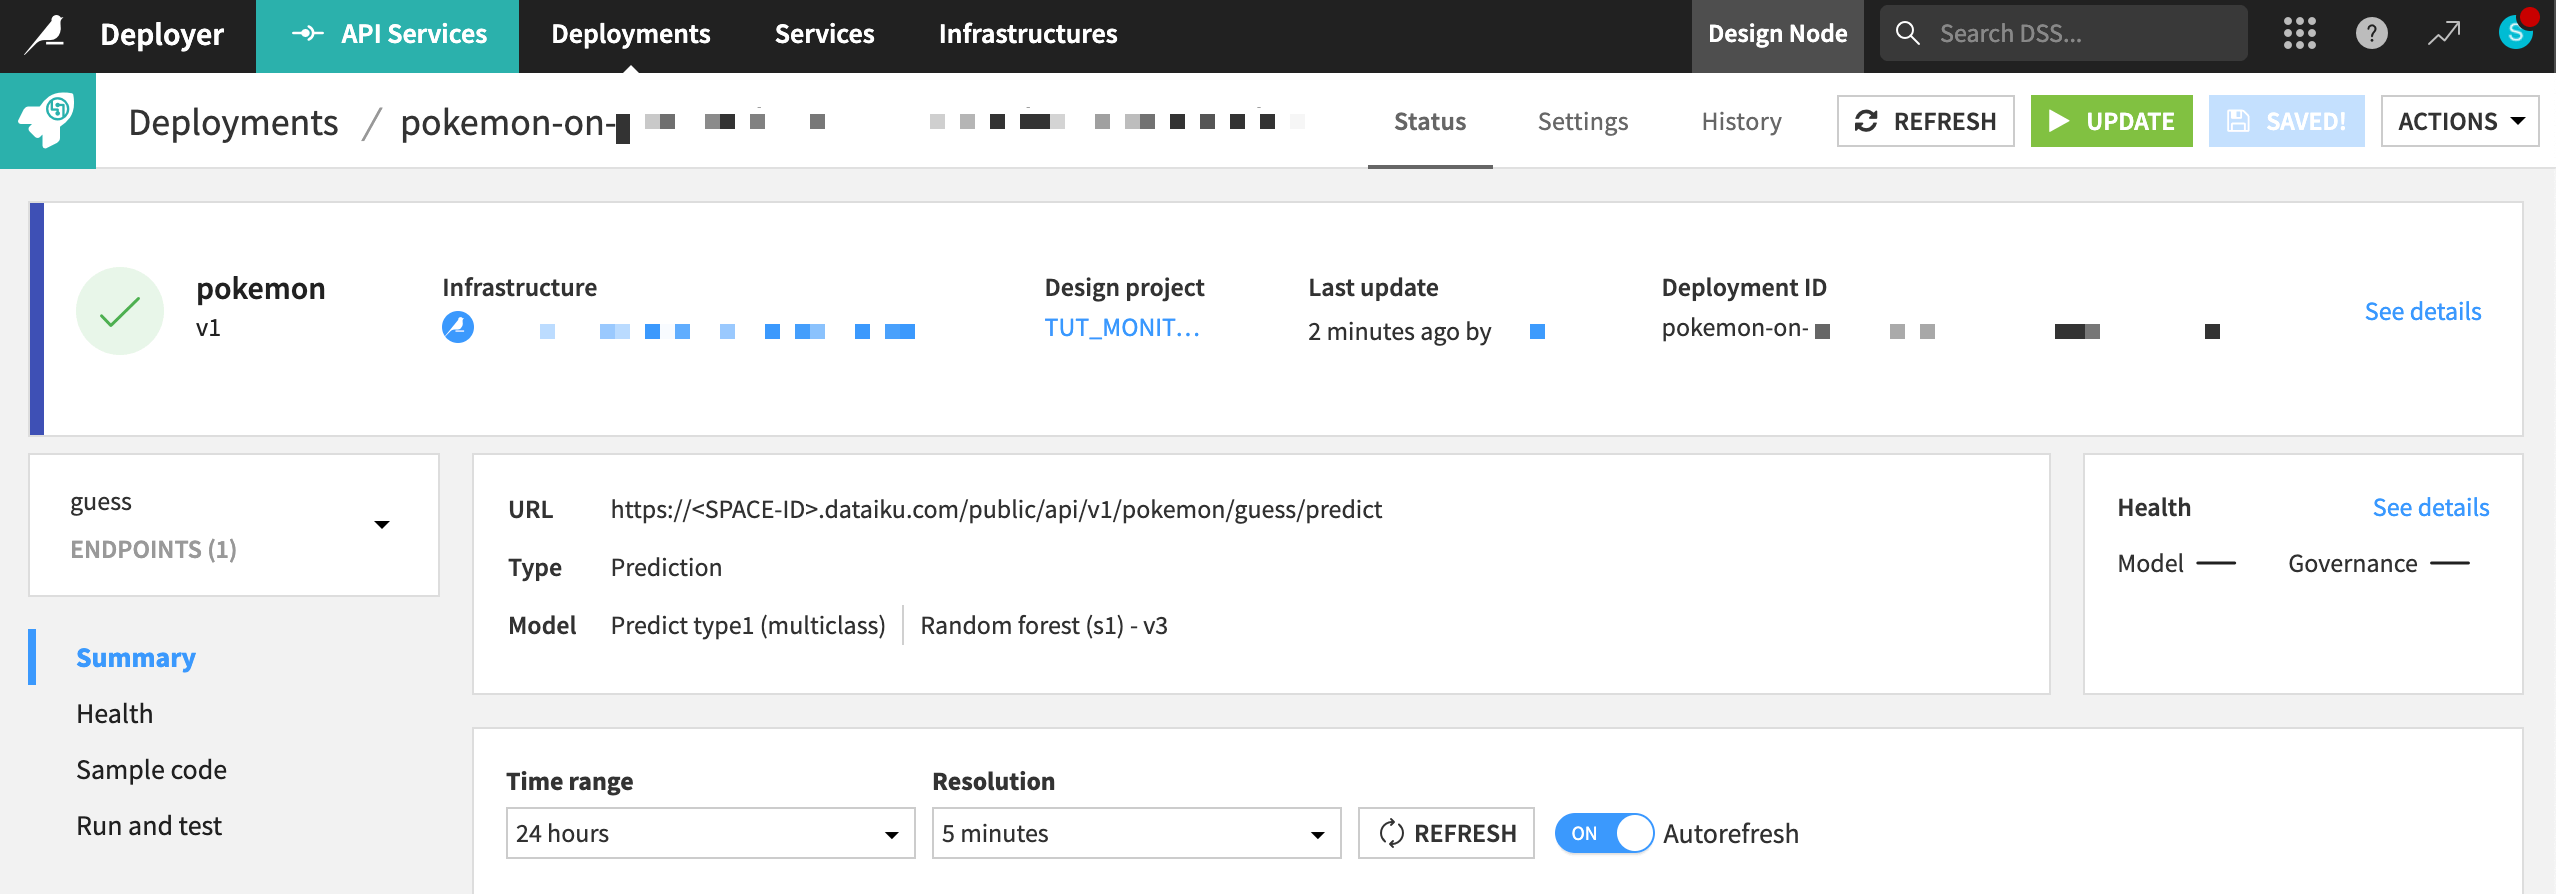
In the Deployments tab of the API Deployer, find the API version that you pushed to the API Deployer, and click Deploy.
If not already selected, choose an infrastructure.
Click Deploy and Deploy again to confirm.
See also
To review the mechanics of real-time API deployment in greater detail, please see Tutorial | Deploy an API service to a production environment.
Generate activity on the API endpoint#
Before you set up the monitoring portion of this project, you need to generate some activity on the API endpoint. That way, you have actual data on the API node to retrieve in the feedback loop.
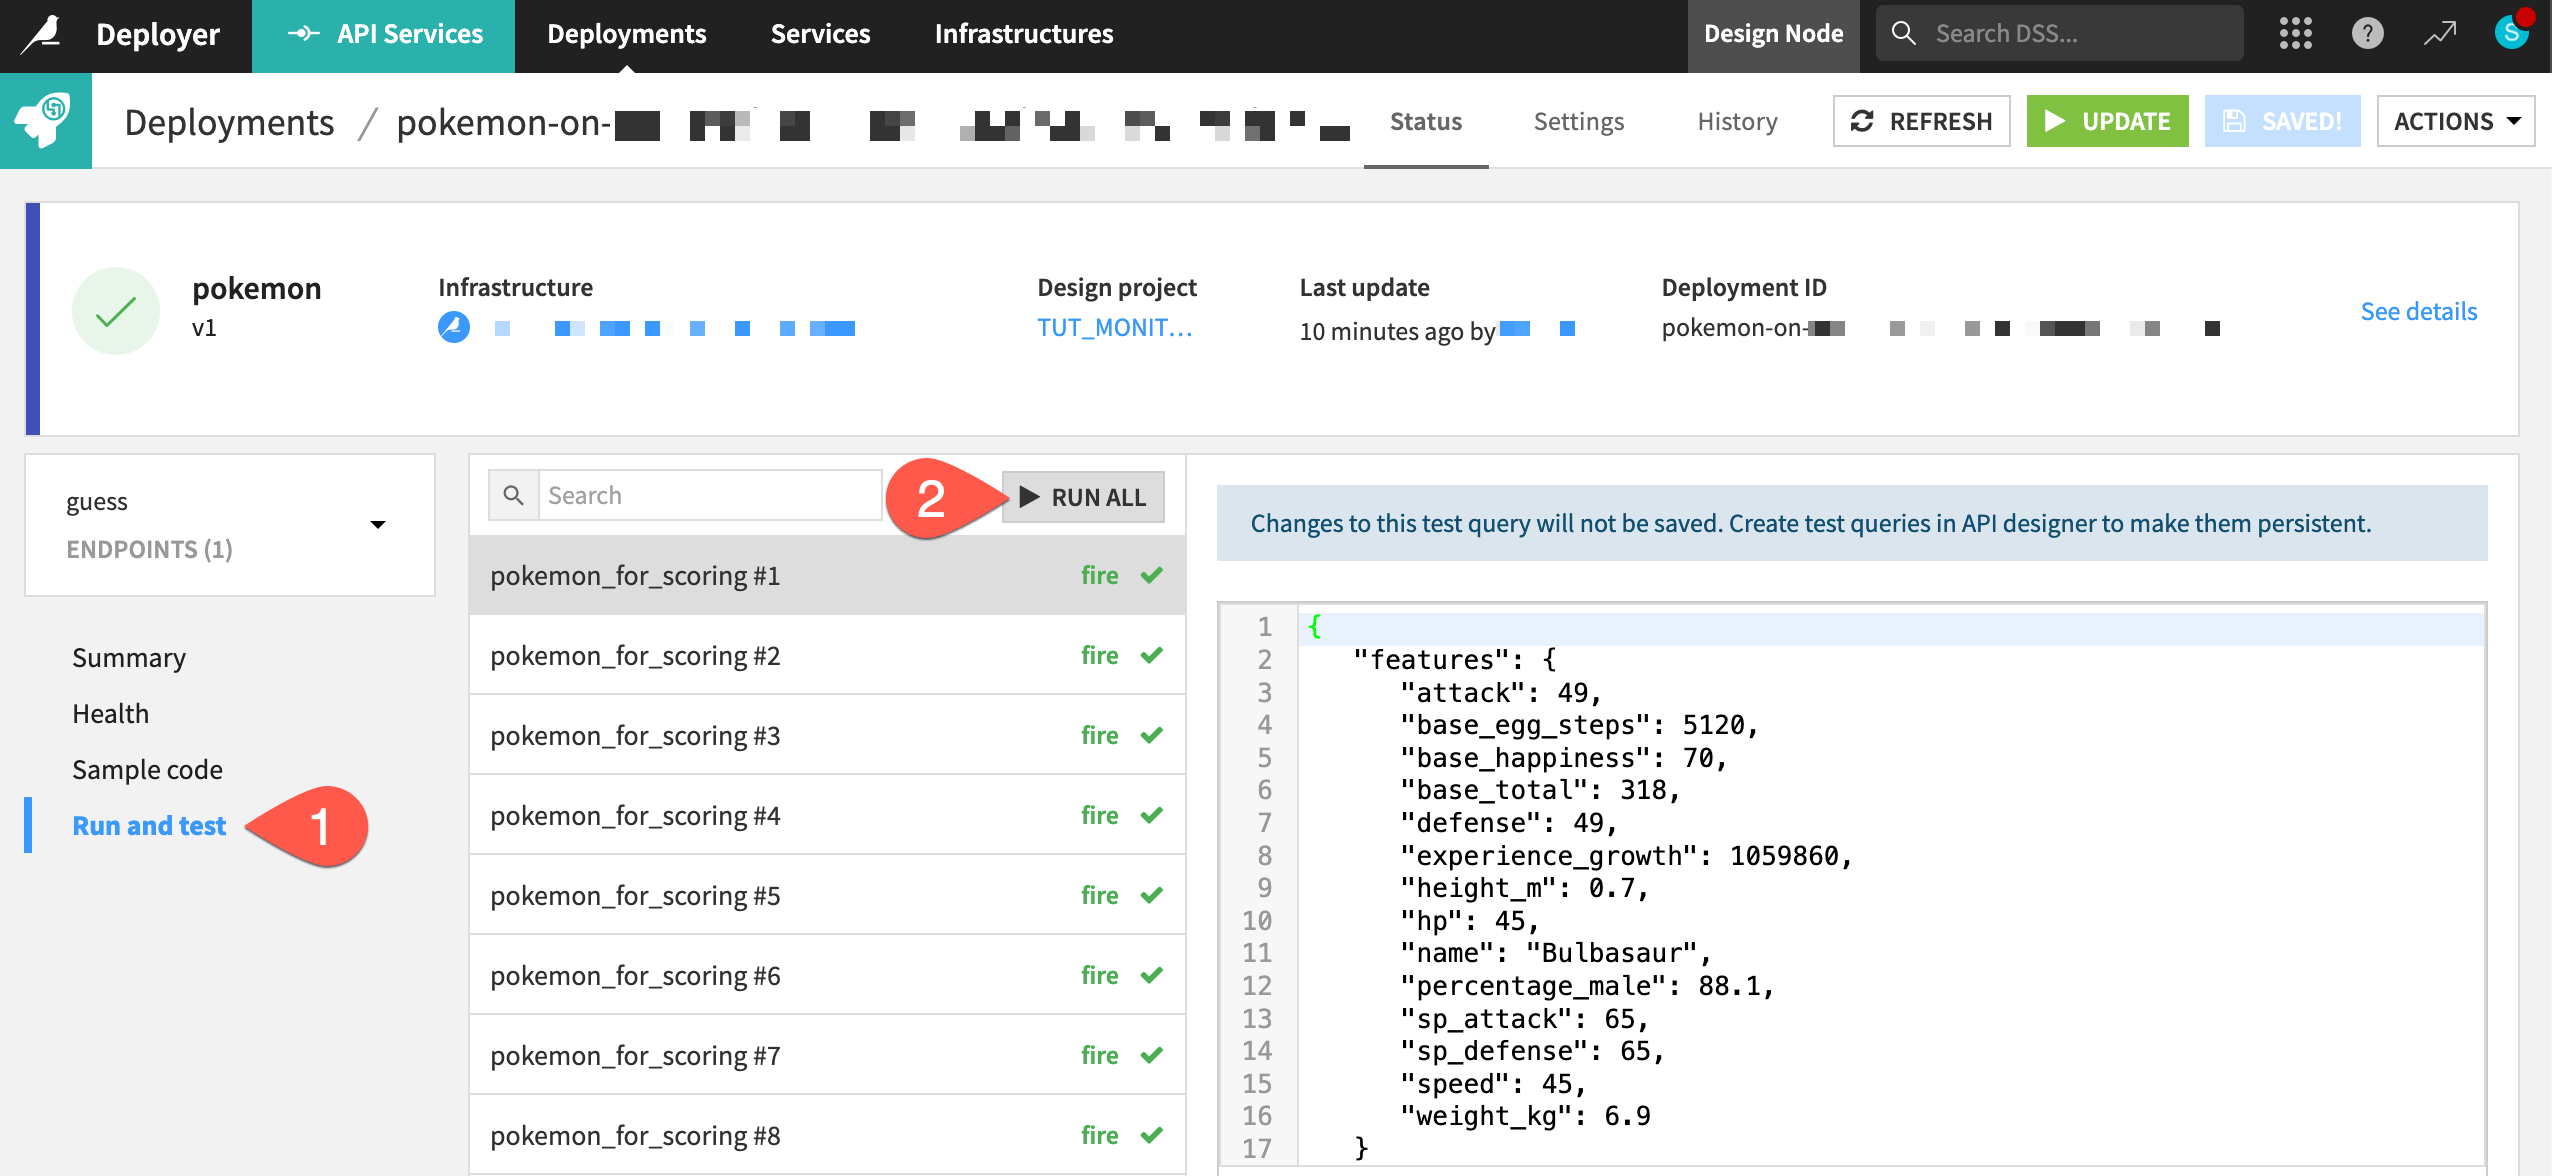
Within the Status tab of the deployment, navigate to the Run and test panel for the guess endpoint.
Click Run All to send several test queries to the API node.
Create a feedback loop on the API endpoint#
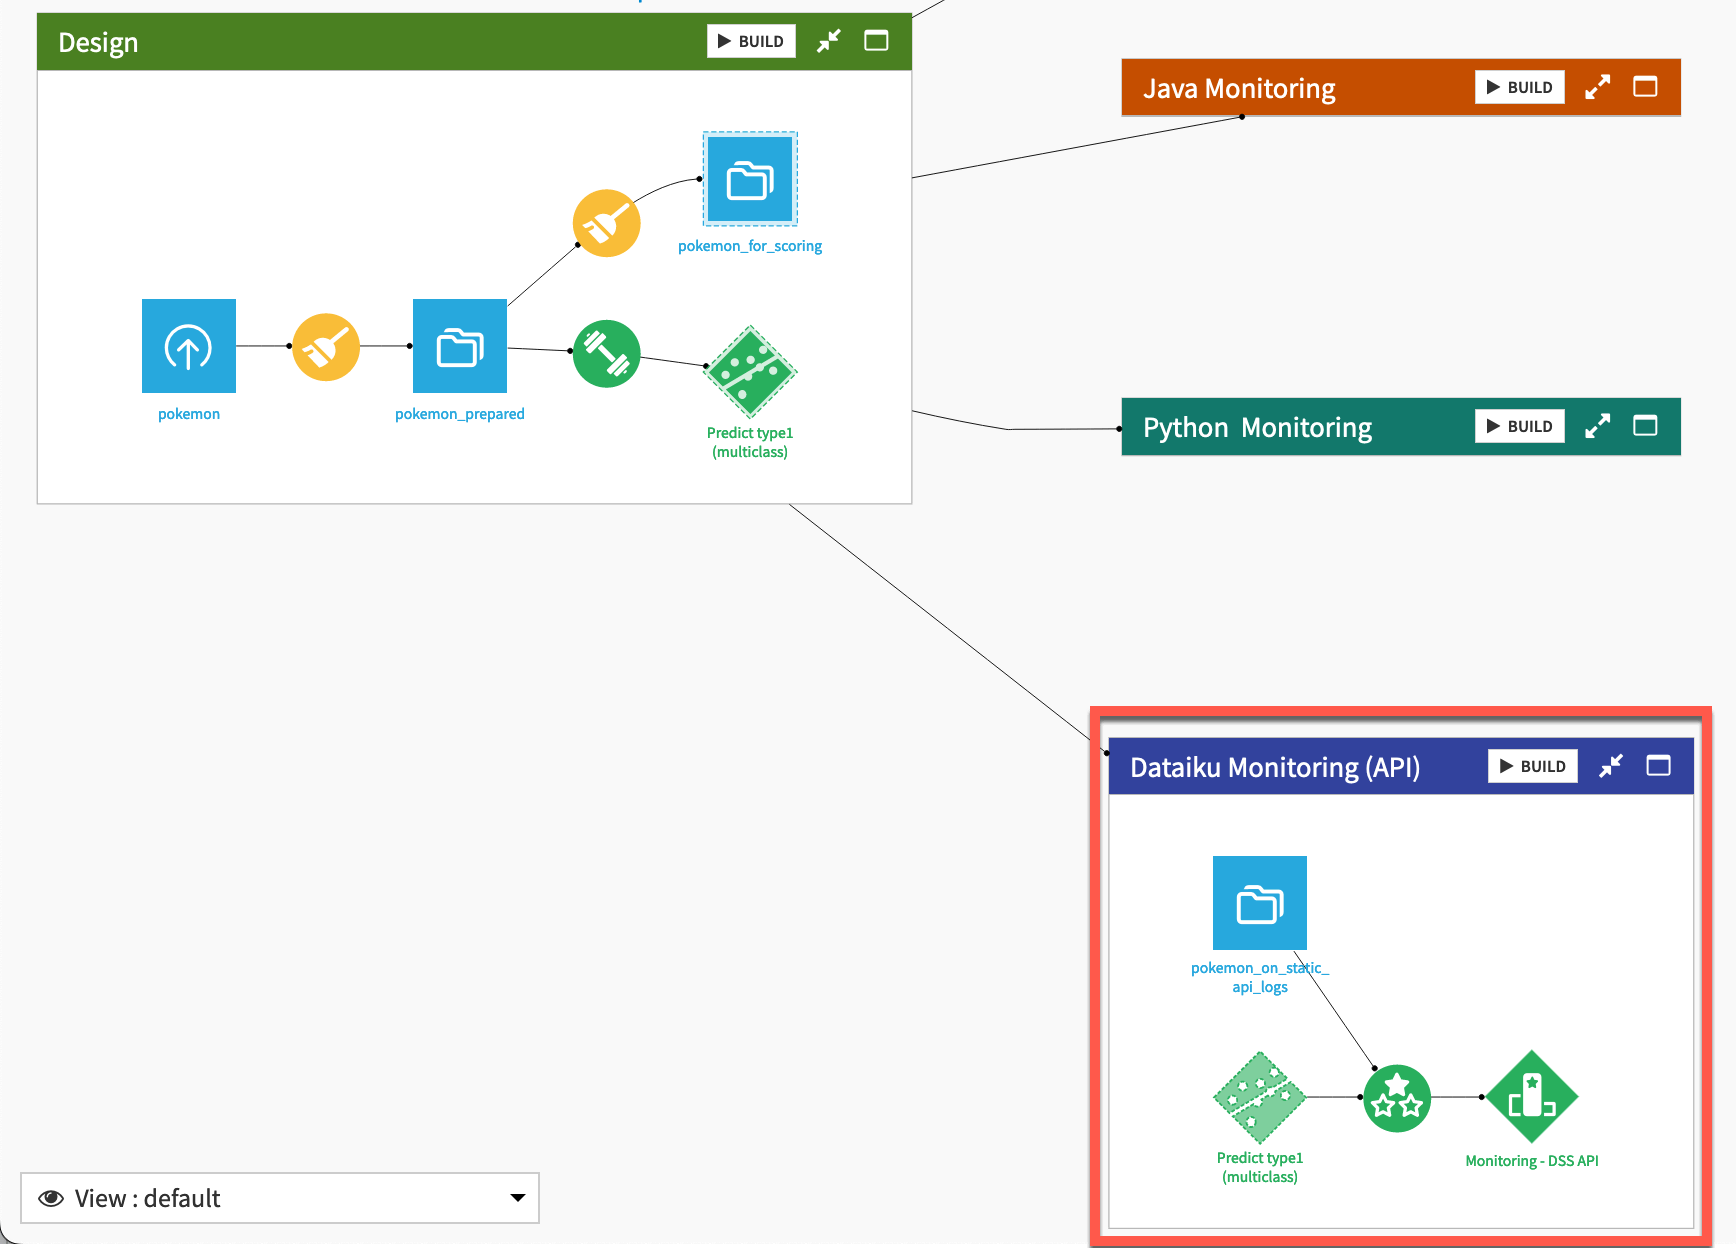
Now direct your attention to the Dataiku Monitoring (API) Flow zone. Like the batch Flow zone, this zone includes an Evaluate recipe that takes two inputs (a dataset of predictions and a saved model) and outputs a model evaluation store. However, there are two subtle differences.
API node log data#
The input data in this context comes directly from the API node. As explained in Tutorial | API endpoint monitoring, the storage location of this data differs for Dataiku Cloud and self-managed users.
Follow the steps in Audit trail on Dataiku Cloud to access API node queries.
Once you’ve imported this dataset, replace pokemon_on_static_api_logs with the apinode_audit_logs dataset as the input to the Evaluate recipe in the Dataiku Monitoring (API) Flow zone.
The pokemon_on_static_api_logs dataset must point to the storage of the API endpoint prediction logs according to the Event server’s configuration. An admin can find this information under Administration > Settings > Event Server on the Design node.
Open the pokemon_on_static_api_logs dataset. There will be an error that it doesn’t exist.
Navigate to the Settings tab.
In the Files subtab, select the Read from connection specific to the configuration of your Event server.
Click Browse to navigate the file directory, and find the Path specific to the configuration of your Event server.
Click api-node-query, and then select the name of the API deployment for this project.
Click OK, and see a path ending with your API deployment.
Click List Files to observe which logs are available, and Save when ready.
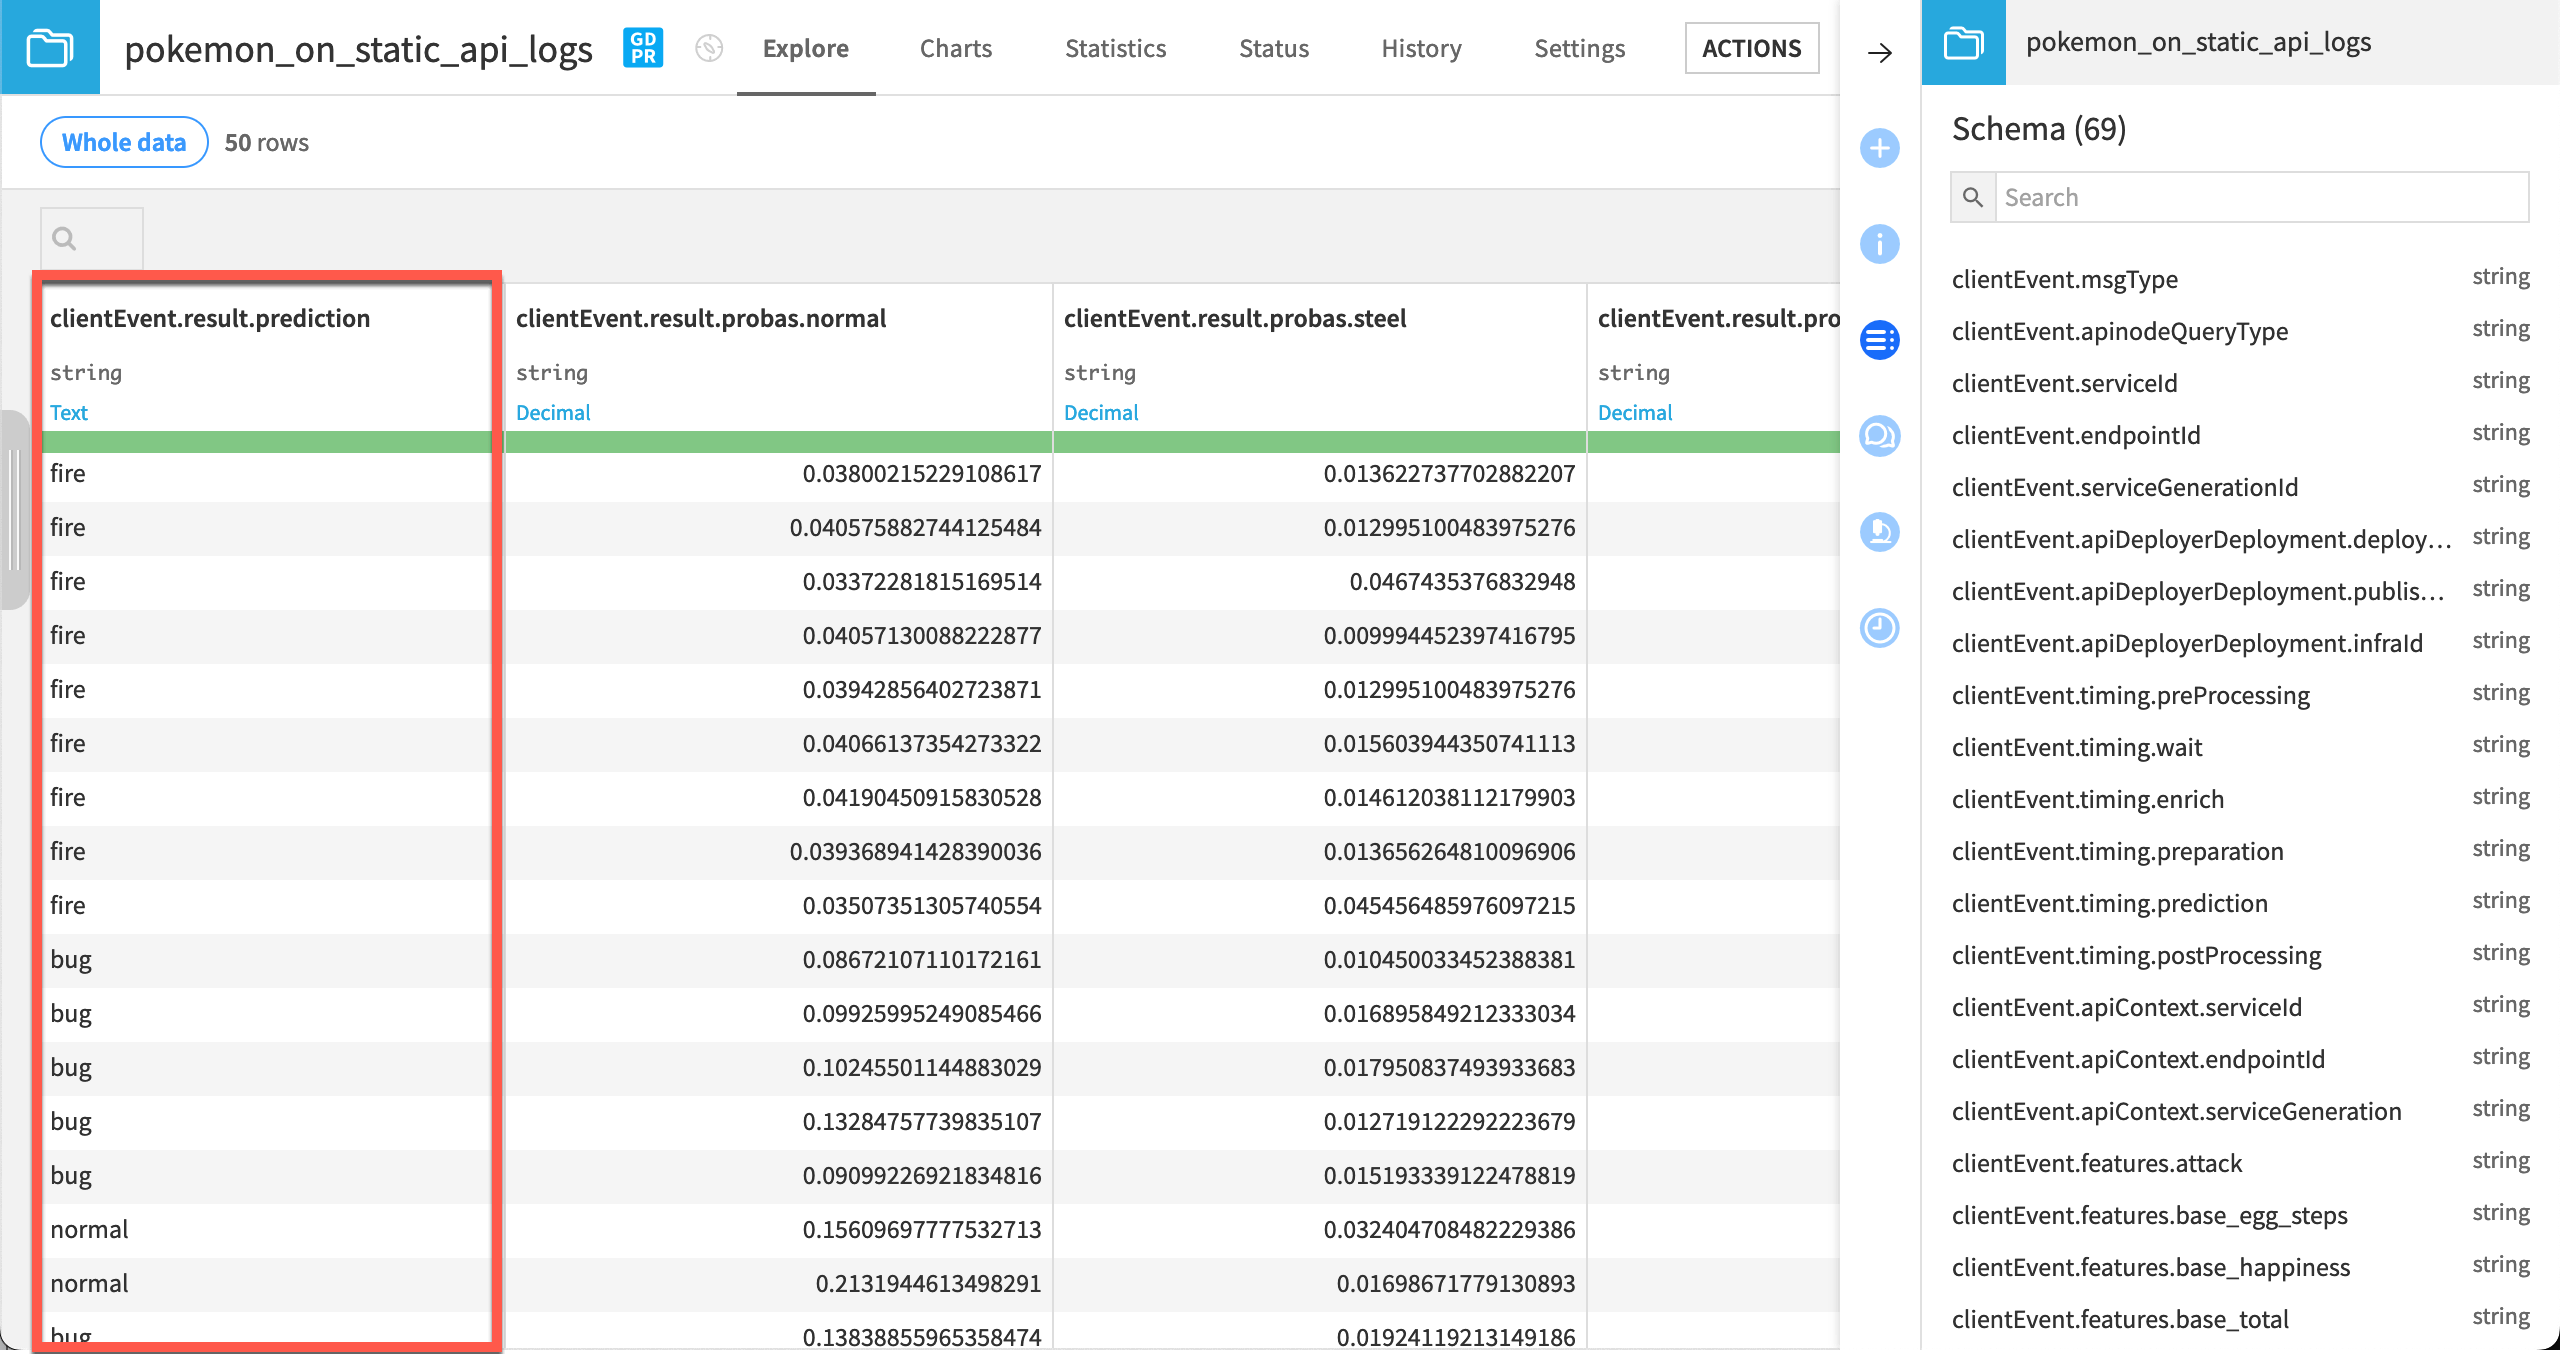
After pointing this dataset to the correct prediction logs, you can now explore it. Each row is an actual prediction request that the model answered. You can find all the features requested, the resulting prediction, with details and other technical data.
Warning
This tutorial uses a local filesystem storage for the API node logs to make the project import easier. In a real situation however, any file-based cloud storage is highly recommended. This data can grow quickly, and it won’t decrease unless explicitly truncated.
It would also be common to activate partitioning for this dataset.
The Evaluate recipe with API node logs as input#
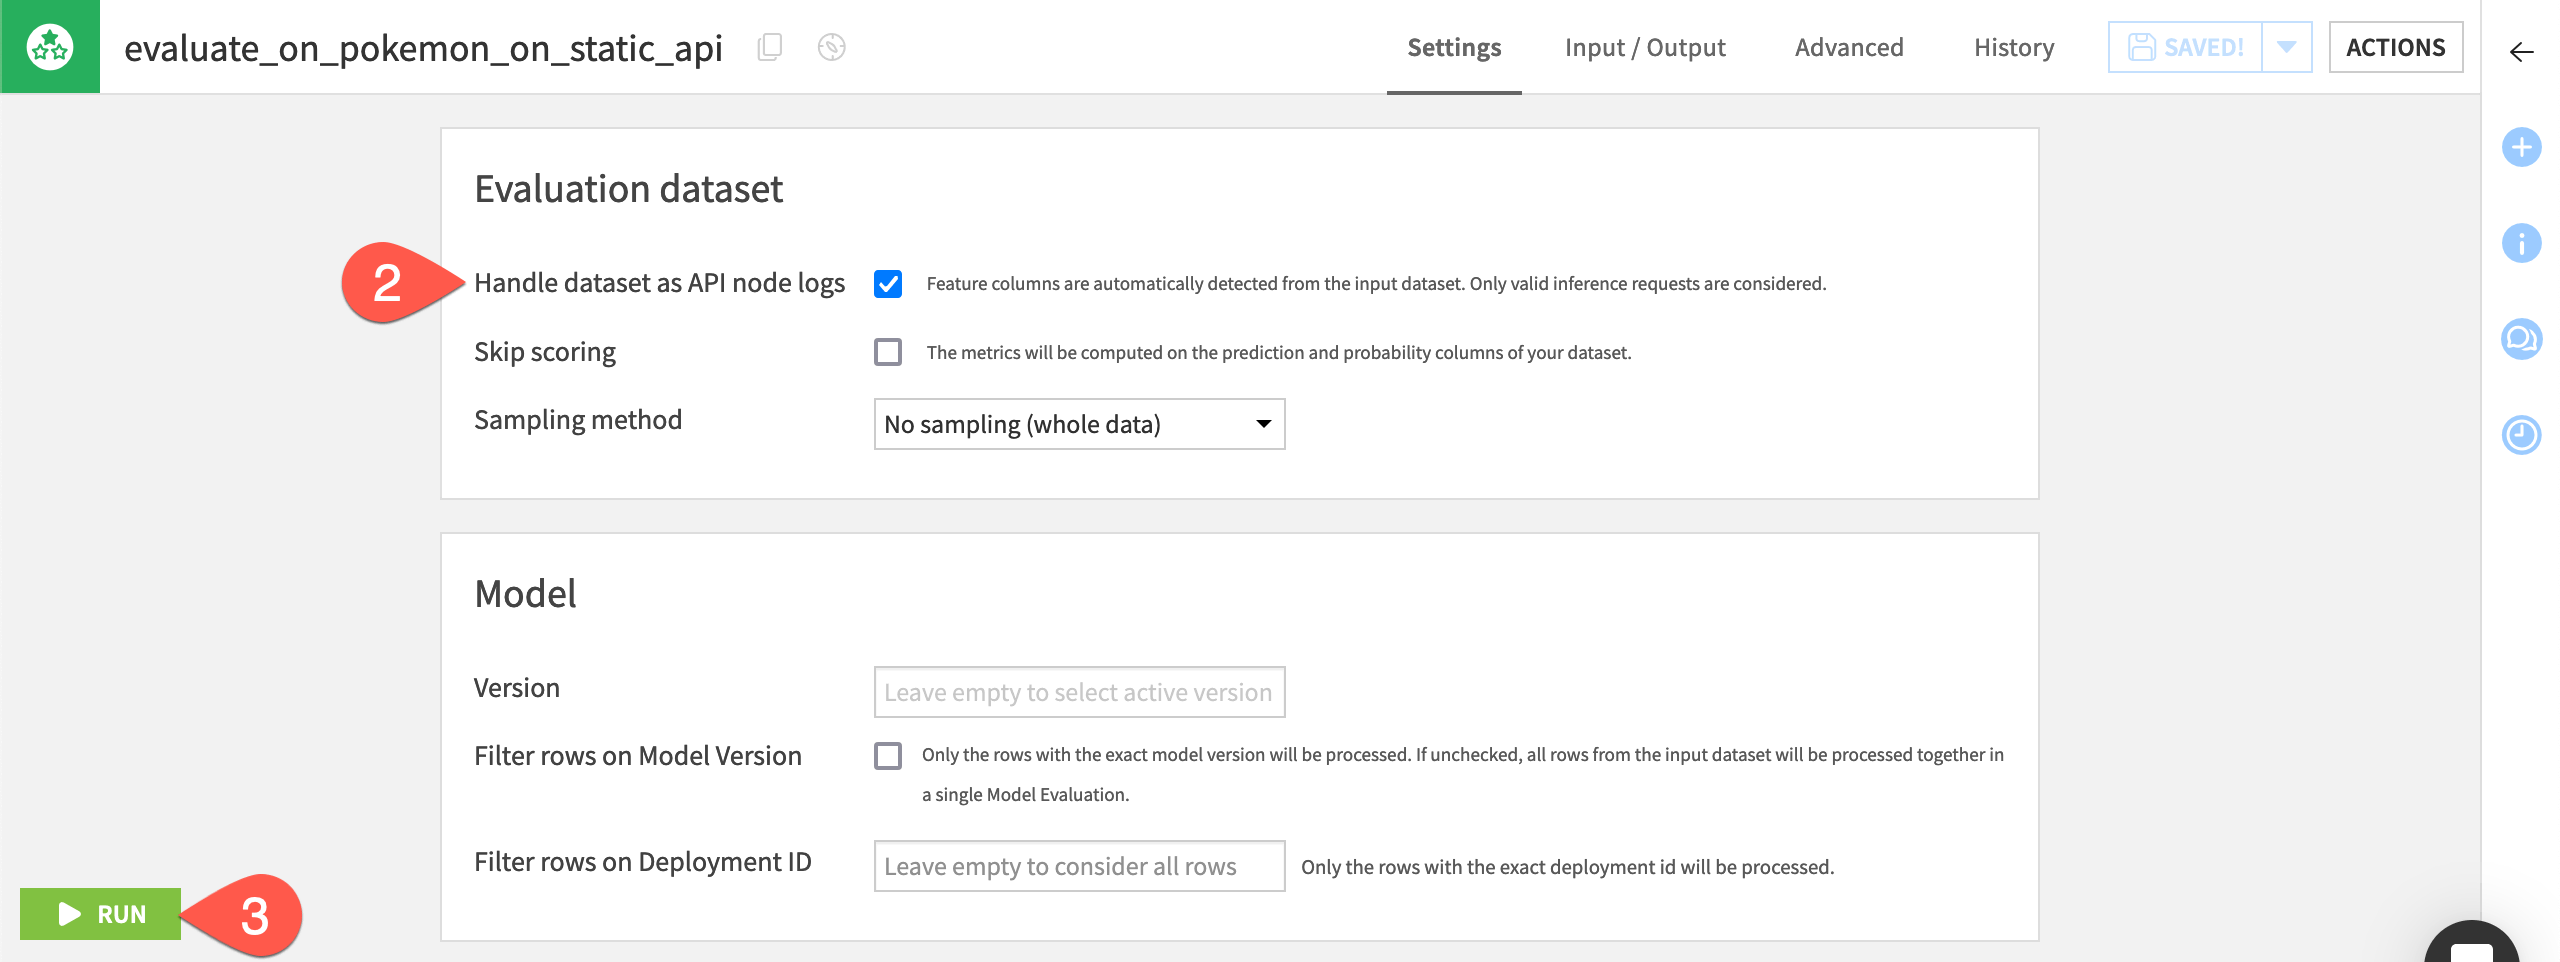
There is another subtle difference between the Evaluate recipe in the API Flow zone compared to the Batch Flow zone. In the API Flow zone, the Evaluate recipe automatically handles the input data as API node logs.
With this activated (detected by default), you don’t need to care about all the additional columns or the naming.
Open the Evaluate recipe in the Dataiku Monitoring (API) Flow zone.
Confirm that the recipe will handle the input dataset as API node logs.
Click Run to produce a model evaluation of the API node logs.
Note
If using a version of Dataiku before 11.2, you will need to add a Prepare recipe to keep only the features and prediction columns. Then, rename them to match the initial training dataset convention.
Create a one-click monitoring loop#
Since version 12, users can simplify this process by building the entire feedback loop directly from the API endpoint in the API Designer.
From the top navigation bar of the Design node, navigate to More Options (
) > API Designer.Open the pokemon API service.
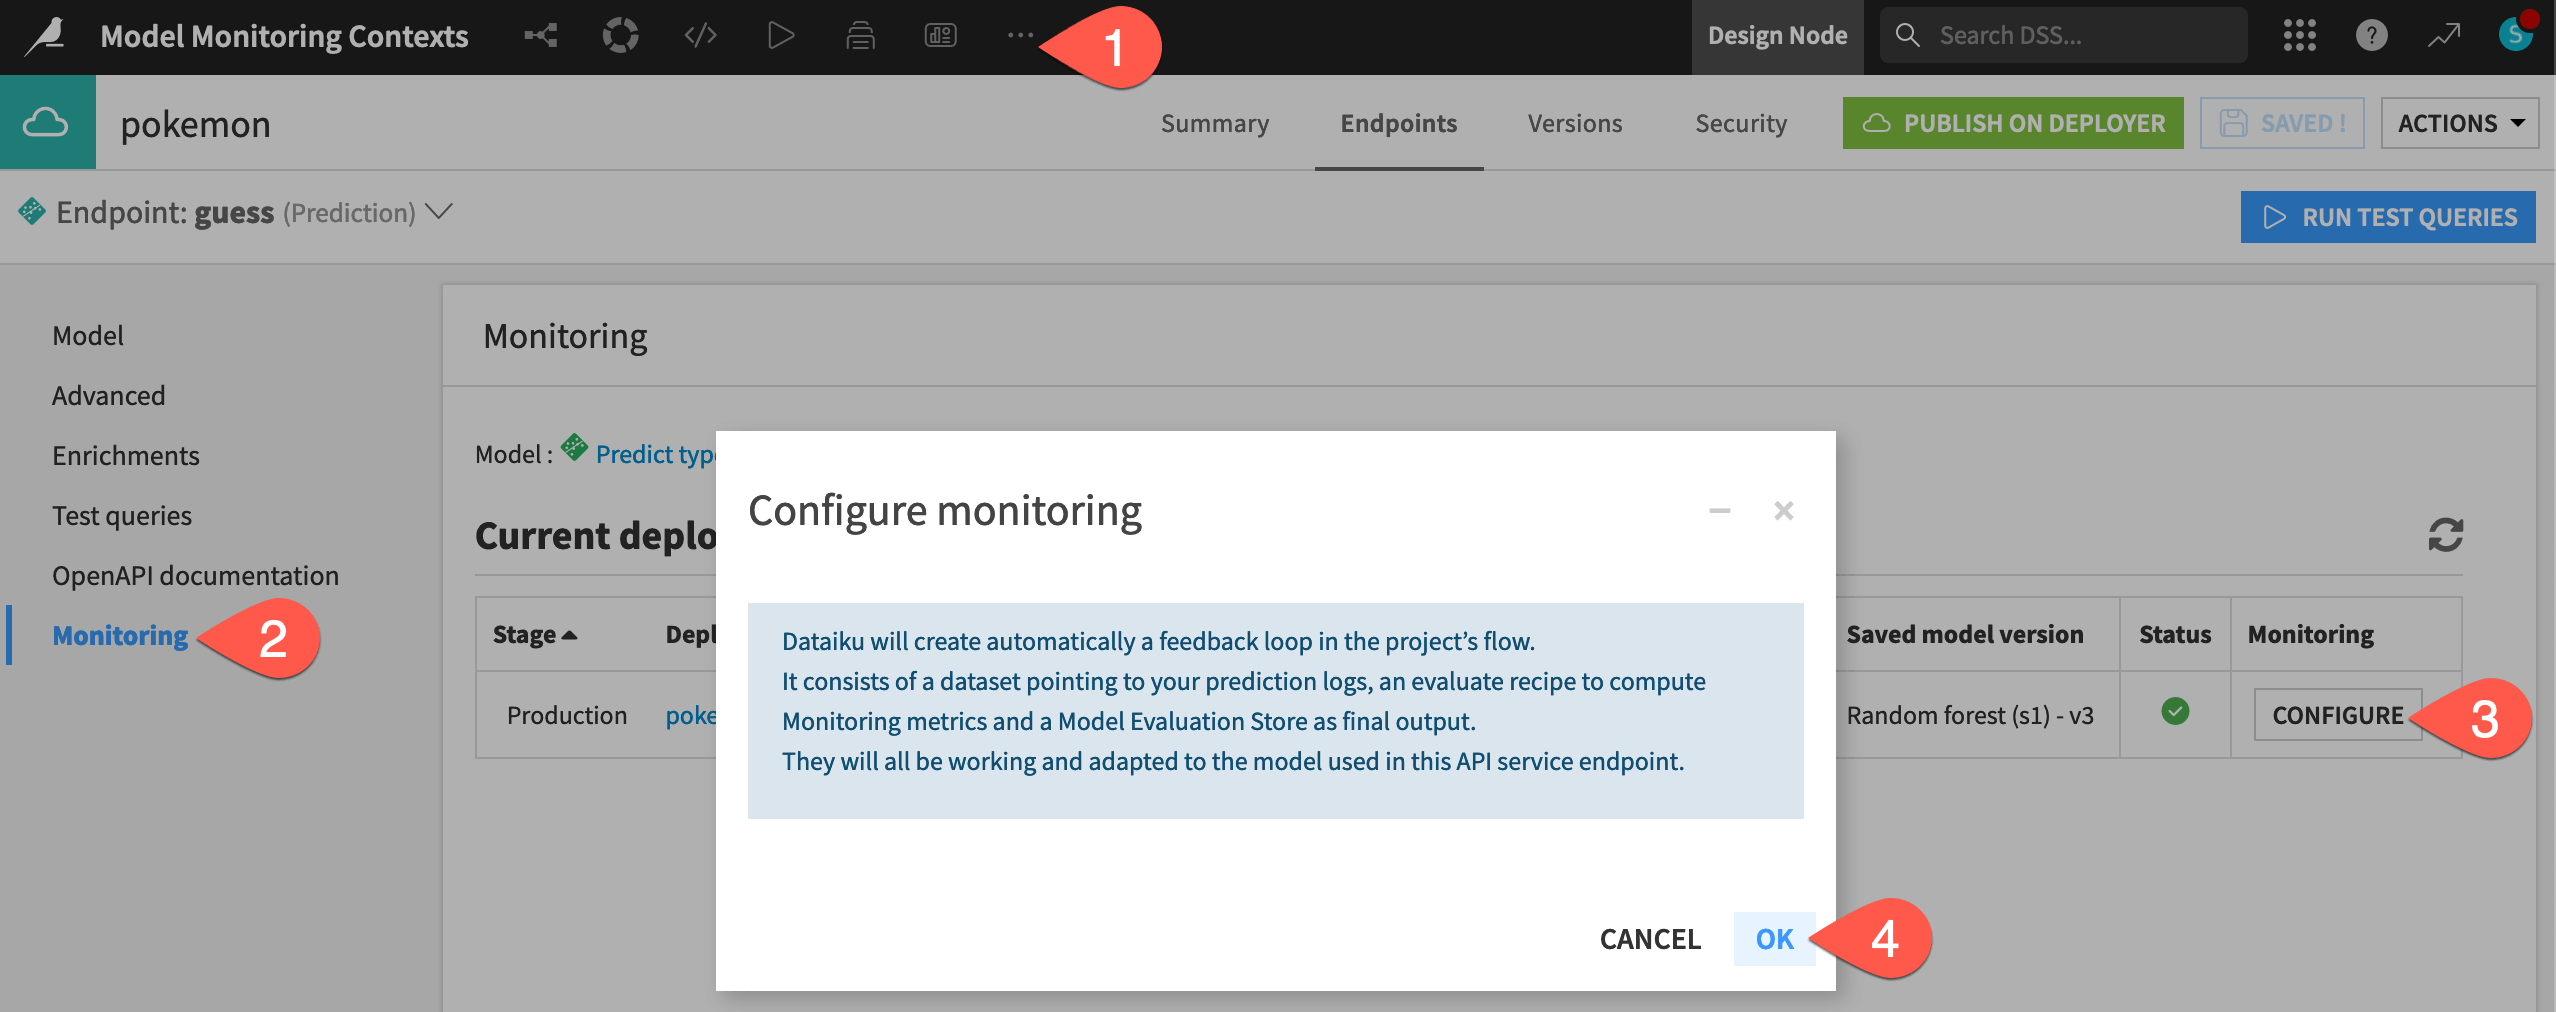
Navigate to the Monitoring panel for the guess endpoint.
Click Configure to create a monitoring loop for this endpoint.
Click OK, and then return to the Flow to see the new zone, which, in this case, duplicates the work of the existing Dataiku Monitoring (API) Flow zone.