
Understand the project#
See a screencast covering this section’s steps
Before rushing to train models, take a moment to understand the goals for this quick start and the data at hand.
Objectives#
In this quick start, you’ll:
Use a visual recipe to divide data into training and testing sets.
Train prediction models for a binary classification task.
Iterate on the design of a model training session.
Apply a chosen model to new data.
See also
This quick start introduces Dataiku’s visual tools for machine learning. If your primary interest is using code and Dataiku for machine learning projects, please see the Quickstart Tutorial in the Developer Guide.
Tip
To check your work, you can review a completed version of this entire project from data preparation through MLOps on the Dataiku gallery.
Review the Flow#
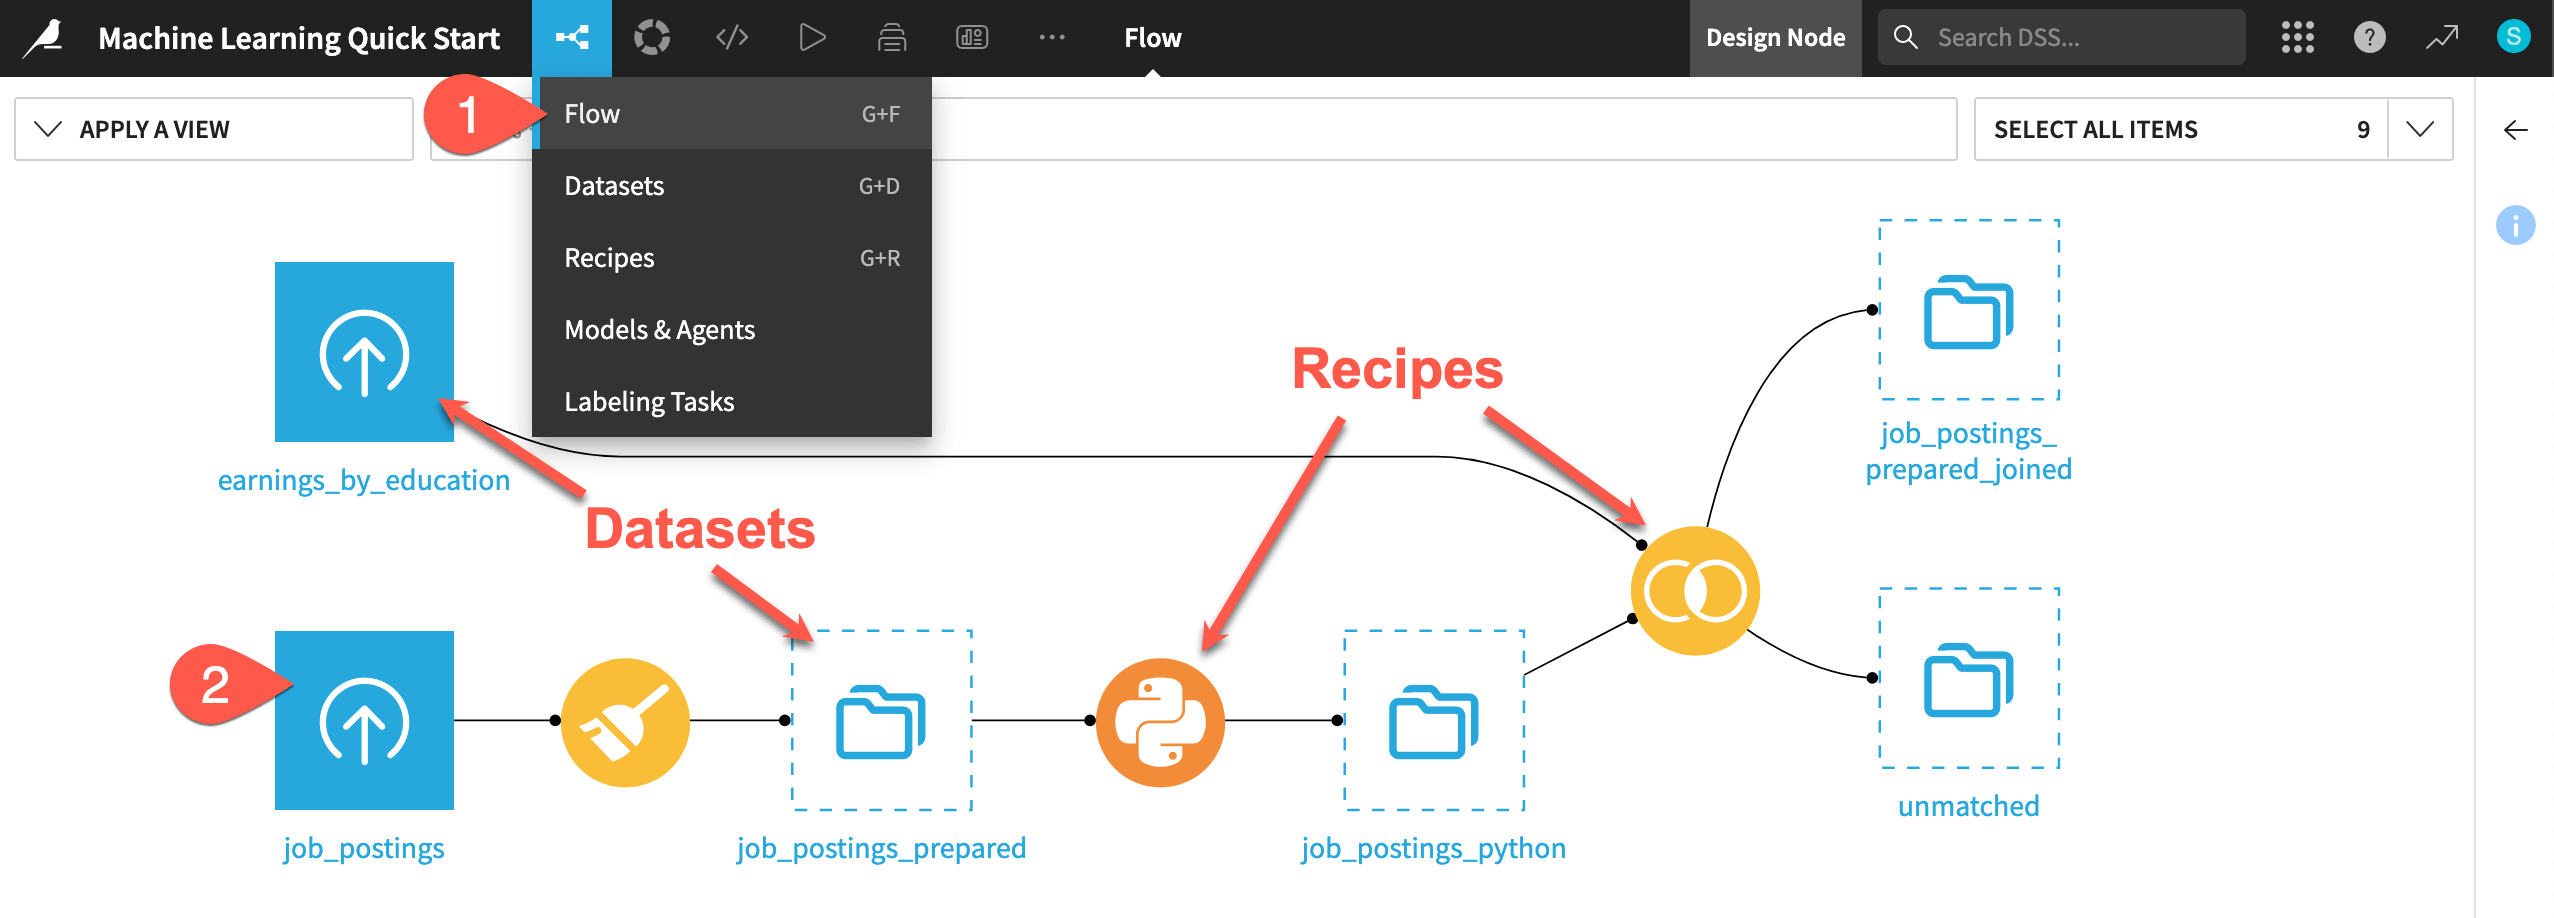
One of the first concepts a user needs to understand about Dataiku is the Flow. The Flow is the visual representation of how datasets, recipes (steps for data transformation), models, and agents work together to move data through an analytics pipeline.
Dataiku has its own visual grammar to organize AI and analytics projects in a collaborative way.
Shape |
Item |
Icon |
|---|---|---|

|
Dataset |
The icon on the square represents the dataset’s storage location, such as Amazon S3, Snowflake, PostgreSQL, etc. |

|
Recipe |
The icon on the circle represents the type of data transformation, such as a broom for a Prepare recipe or coiled snakes for a Python recipe. |

|
Model or Agent |
The icon on a diamond represents the type of modeling task (such as prediction, clustering, time series forecasting, etc.) or the type of agent (such as visual or code). |
Tip
In addition to shape, color has meaning too.
Datasets and folders are blue. Those shared from other projects are black.
Visual recipes are yellow.
Code elements are orange.
Machine learning elements are green.
Generative AI and agent elements are pink.
Plugins are often red.
Take a look now!
If not already there, from the (
 ) menu in the top navigation bar, select the Flow (or use the keyboard shortcut
 g+f).Double click on the job_postings dataset to open it.
Tip
There are many other keyboard shortcuts! Type ? to pull up a menu or see the Accessibility page in the reference documentation.
Analyze the data#
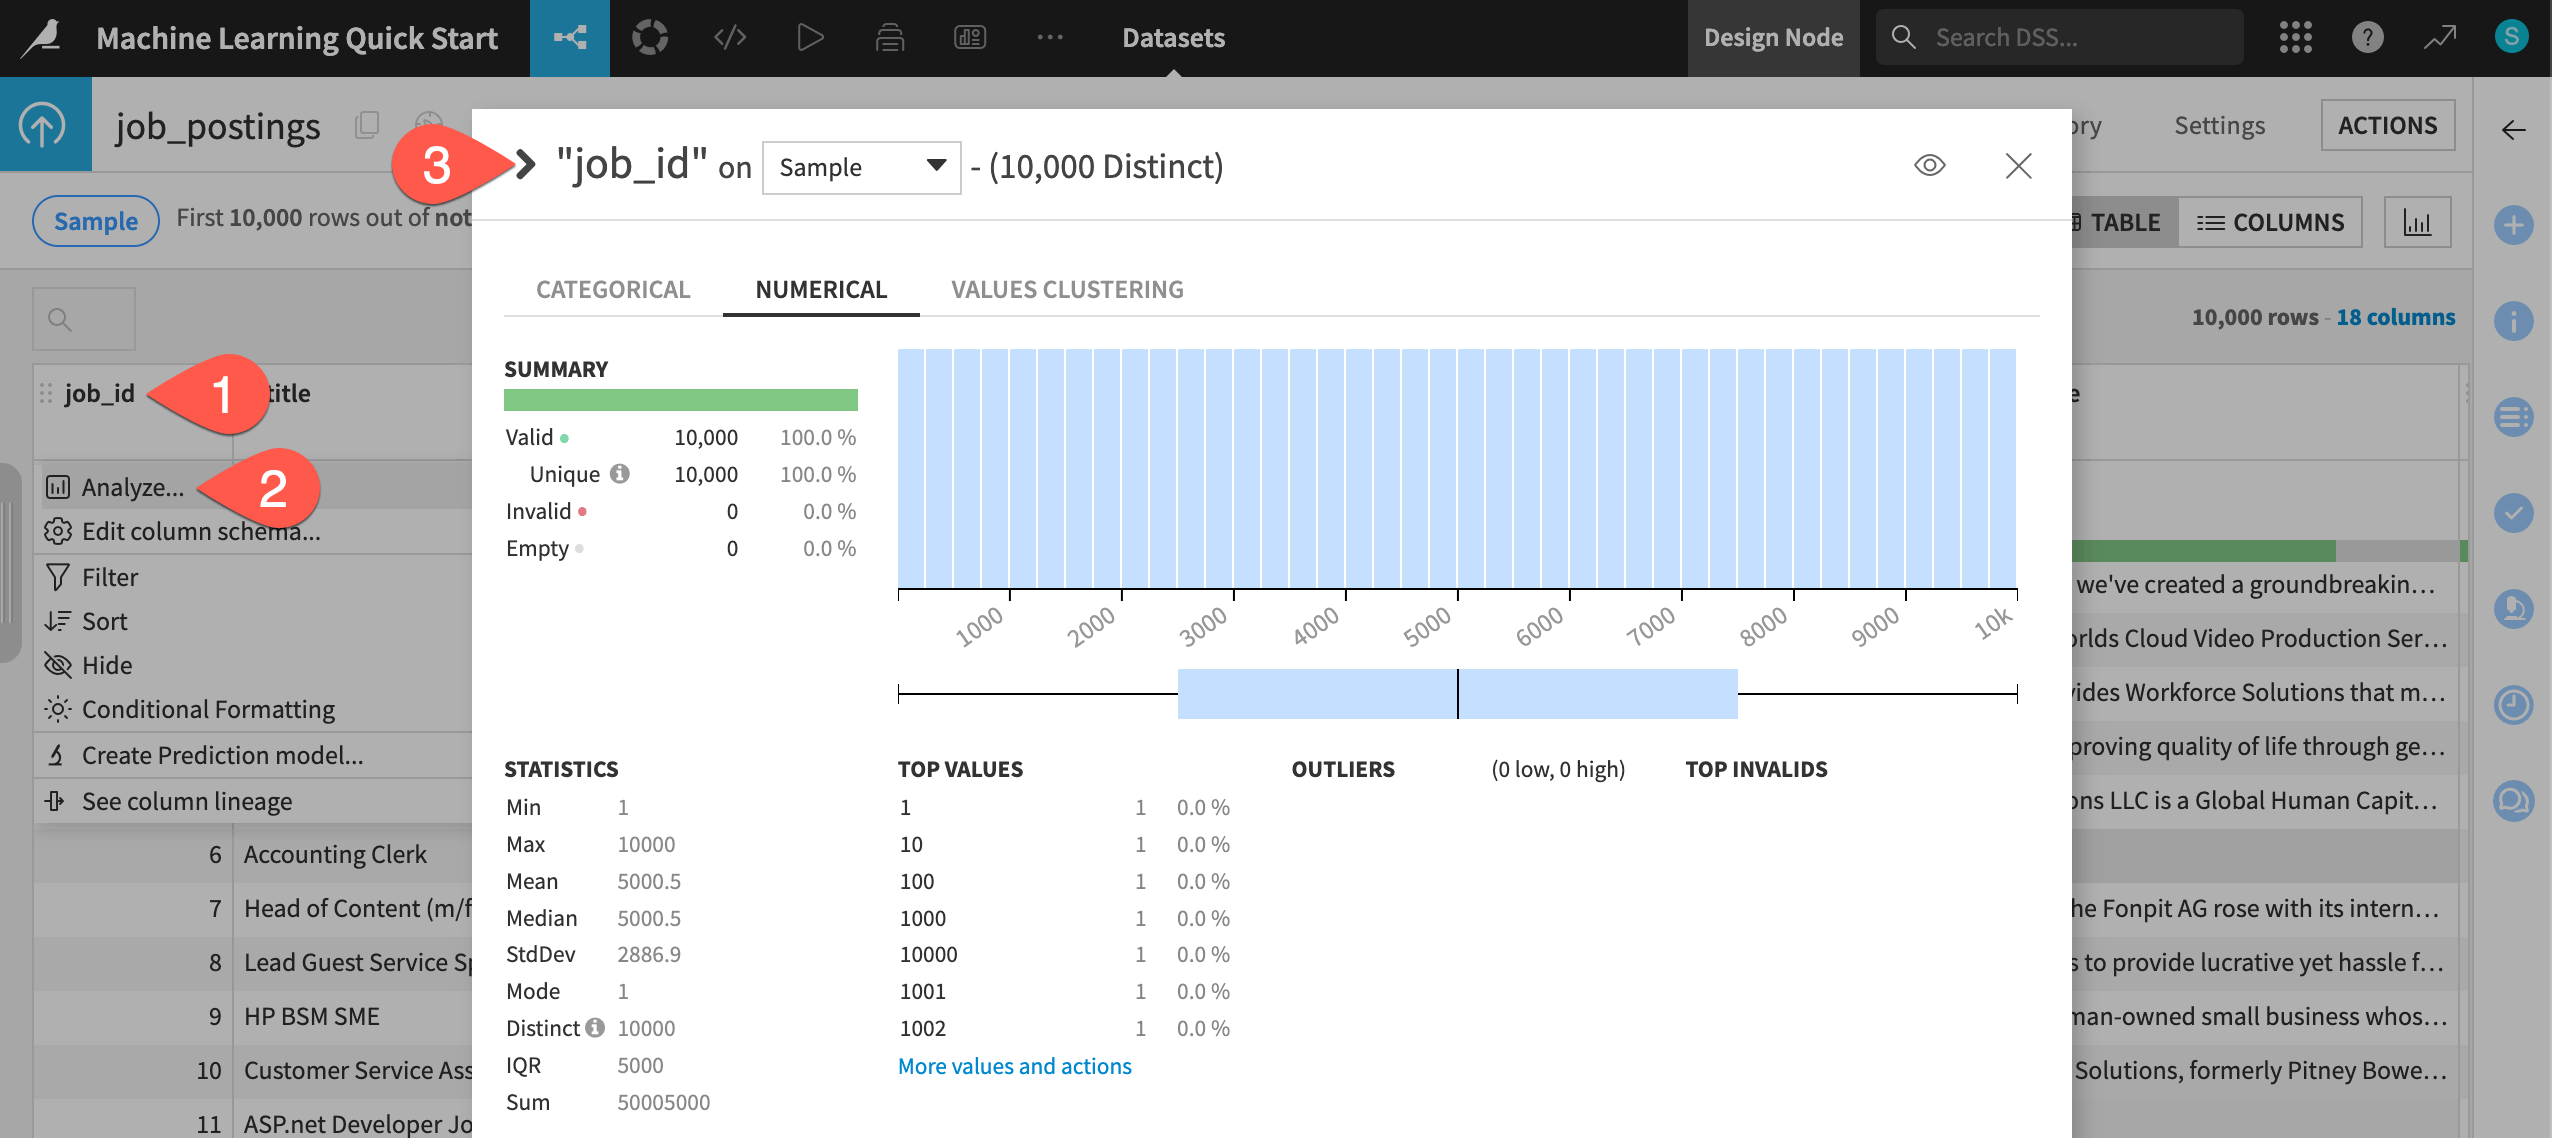
This project begins from a labeled dataset named job_postings composed of 95% real and 5% fake job postings. For the column fraudulent, values of 0 and 1 represent real and fake job postings, respectively. Your task will be to build a prediction model capable of classifying a job posting as real or fake.
Take a quick look at the data.
Click on the header of the first column job_id to open a menu of options.
Select Analyze.
Use the arrow (
 ) at the top left of the dialog to cycle through each column summary until reaching the target variable fraudulent.
Build the Flow#
Unlike the initial uploaded datasets, the downstream datasets appear as outlines. This is because you haven’t built them yet. However, this isn’t a problem because the Flow contains the recipes required to create these outputs at any time.
Navigate back to the Flow (
g+f).Open the Flow Actions menu.
Click Build all.
Click Build to run the recipes necessary to create the items furthest downstream.
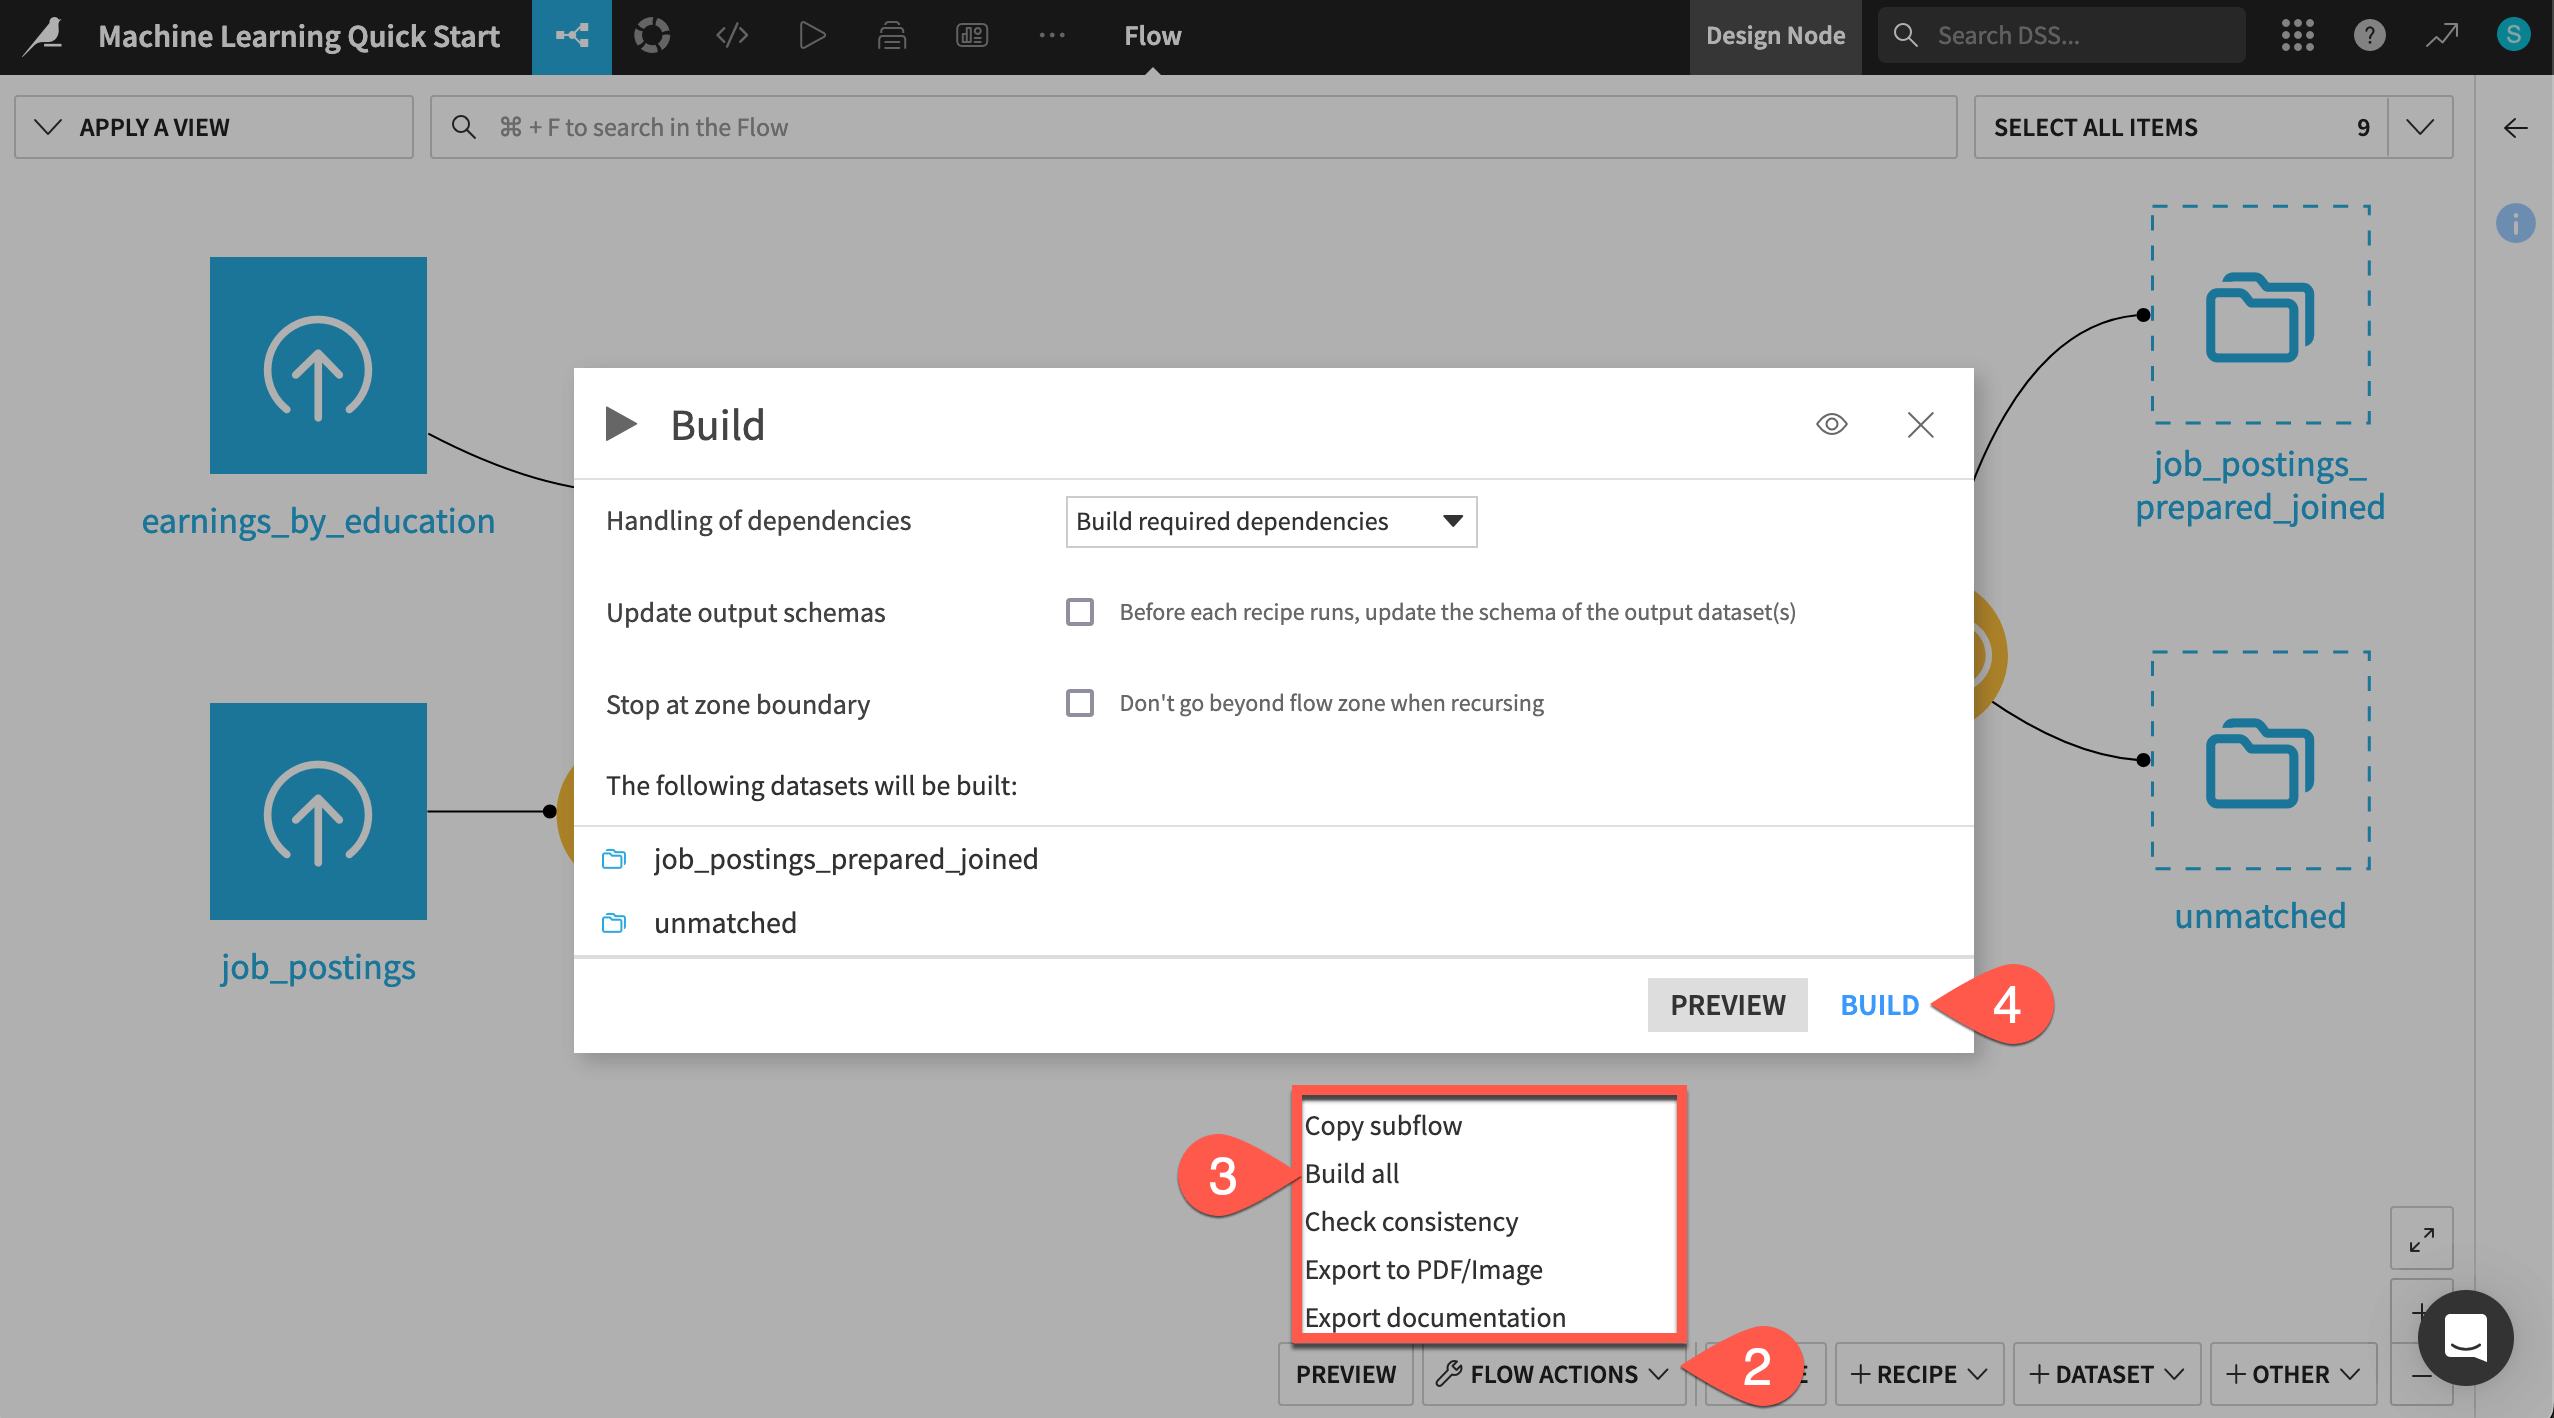
When the job completes, refresh the page to see the built Flow.
See also
To learn more about creating this Flow, see the Data Preparation Quick Start.