
Tutorial | Adapting a D3.js template in a webapp#
D3.js is a state-of-the-art library for data visualization. Check out the D3.js gallery for stunning and beautiful examples. Happily, many of these visualizations include their source code, so that you can easily duplicate them.
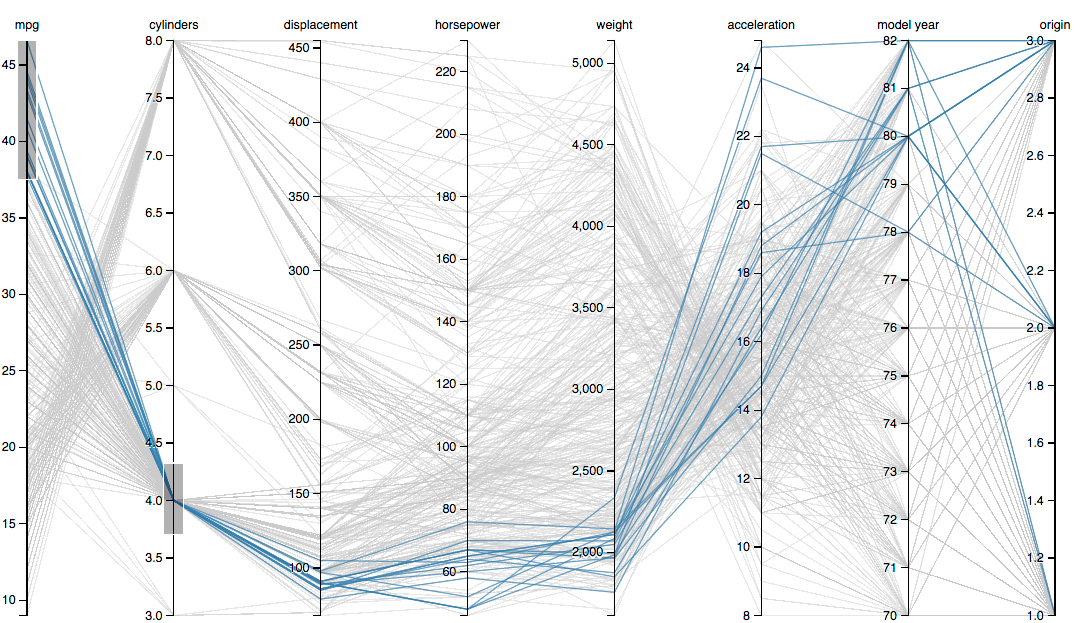
For example, the parallel coordinates chart, created by Mike Bostock, is given with the generating D3 code and data! This is a cool and useful data viz that allows you to quickly visualize a multi-dimensional (but relatively small) dataset. You can immediately spot correlations across dimensions and uncover clusters. In this interactive visualization, you can explore the data in depth by filtering values on each dimension with a brush tool.
This brief tutorial replicates the parallel coordinates chart in a Dataiku webapp.
Prerequisites#
The tutorial on the basics of standard webapps is suggested, but not required.
Upload the data and create a new webapp#
The parallel coordinates chart is illustrated on a dataset of car specifications.
In new blank project, create the cars dataset by uploading this CSV file.
From the Code menu, create a new code webapp, of the “standard” variety.
Choose a simple webapp to get started, and delete all of the sample code.
We first need access to the data and the needed libraries.
In the Settings tab, click on Configure in the Security section.
In the dataset list, find the cars dataset and allow the webapp to read it.
Import the D3.js library on the main page of the Settings tab.
Understand the overall code structure#
Many D3 code samples, given in the D3 gallery have the same overall structure.
<!DOCTYPE html>
<meta charset="utf-8">
<style>
    /* CSS  code */
</style>
<body>
    <!-- HTML code -->
    <script src="https://d3js.org/d3.v3.min.js"></script>
    <script>
        // JS code
    </script>
<body>
To replicate the D3 visualizations in your webapp, you will need to copy the CSS and HTML code in the corresponding panels of the webapp editor. For the JavaScript code, it requires a little more work, as we will see promptly.
Copying the HTML code#
In the parallel coordinates chart example, there is no HTML code written within the <body> tags, and thus the HTML panel of your webapp code editor should be blank.
Be sure to remove any sample code from the HTML tab.
Copying the CSS code#
Here is the CSS code, defined within the <style> tags, that you should copy into the CSS panel of your editor.
svg {
  font: 10px sans-serif;
}

.background path {
  fill: none;
  stroke: #ccc;
  stroke-opacity: .4;
  shape-rendering: crispEdges;
}

.foreground path {
  fill: none;
  stroke: steelblue;
  stroke-opacity: .7;
}

.brush .extent {
  fill-opacity: .3;
  stroke: #fff;
  shape-rendering: crispEdges;
}

.axis line,
.axis path {
  fill: none;
  stroke: #000;
  shape-rendering: crispEdges;
}

.axis text {
  text-shadow: 0 1px 0 #fff;
  cursor: move;
}
Adapting the JS code#
The trickiest part in adapting a D3 template is always to shape the data in the format required by the data viz.
Start by copying and pasting the JavaScript code from the example into the JS tab, beginning with the first
varand ending with the closing}.
In the parallel coordinates charts, the data in the D3 code is represented as the cars JSON array. Generally, however, your source data is not in JSON format. In many D3 templates, the data is given as a CSV file, which is converted to JSON.
In the original D3 code, the data is thus read from the cars.csv file:
// D3 code
d3.csv("cars.csv", function(error, cars) {
    // D3 code
});
// D3 code
Then the D3 code defined inside the d3.csv() function is applied on the cars JSON array.
In our webapp, you will have to connect to your dataset (which can be stored in a great variety of formats and database systems) through the Dataiku JavaScript API.
In order to do this, we need to modify the JS code in two ways:
Without touching the body of the function, replace the original
d3.csv()function name and parameters with the code below.// same D3 code function parallelCoordinatesChart(cars) { // same D3 code } // same D3 code
In other words, keep the entire D3 code unchanged, except for the call to the
d3.csv()function, which is replaced by defining theparallelCoordinatesChart()function, which takes the cars JSON array as input.Remove the parenthesis and semicolon —
);— that were at the end of thed3.csv()function; they are no longer needed (and the parenthesis will indeed cause an error).Now, we only need to connect to the cars dataset through the Dataiku JS API, in order to create the corresponding cars JSON array. Recall that, when you gave permission for your webapp to read the cars dataset, an option to add a snippet calling to the
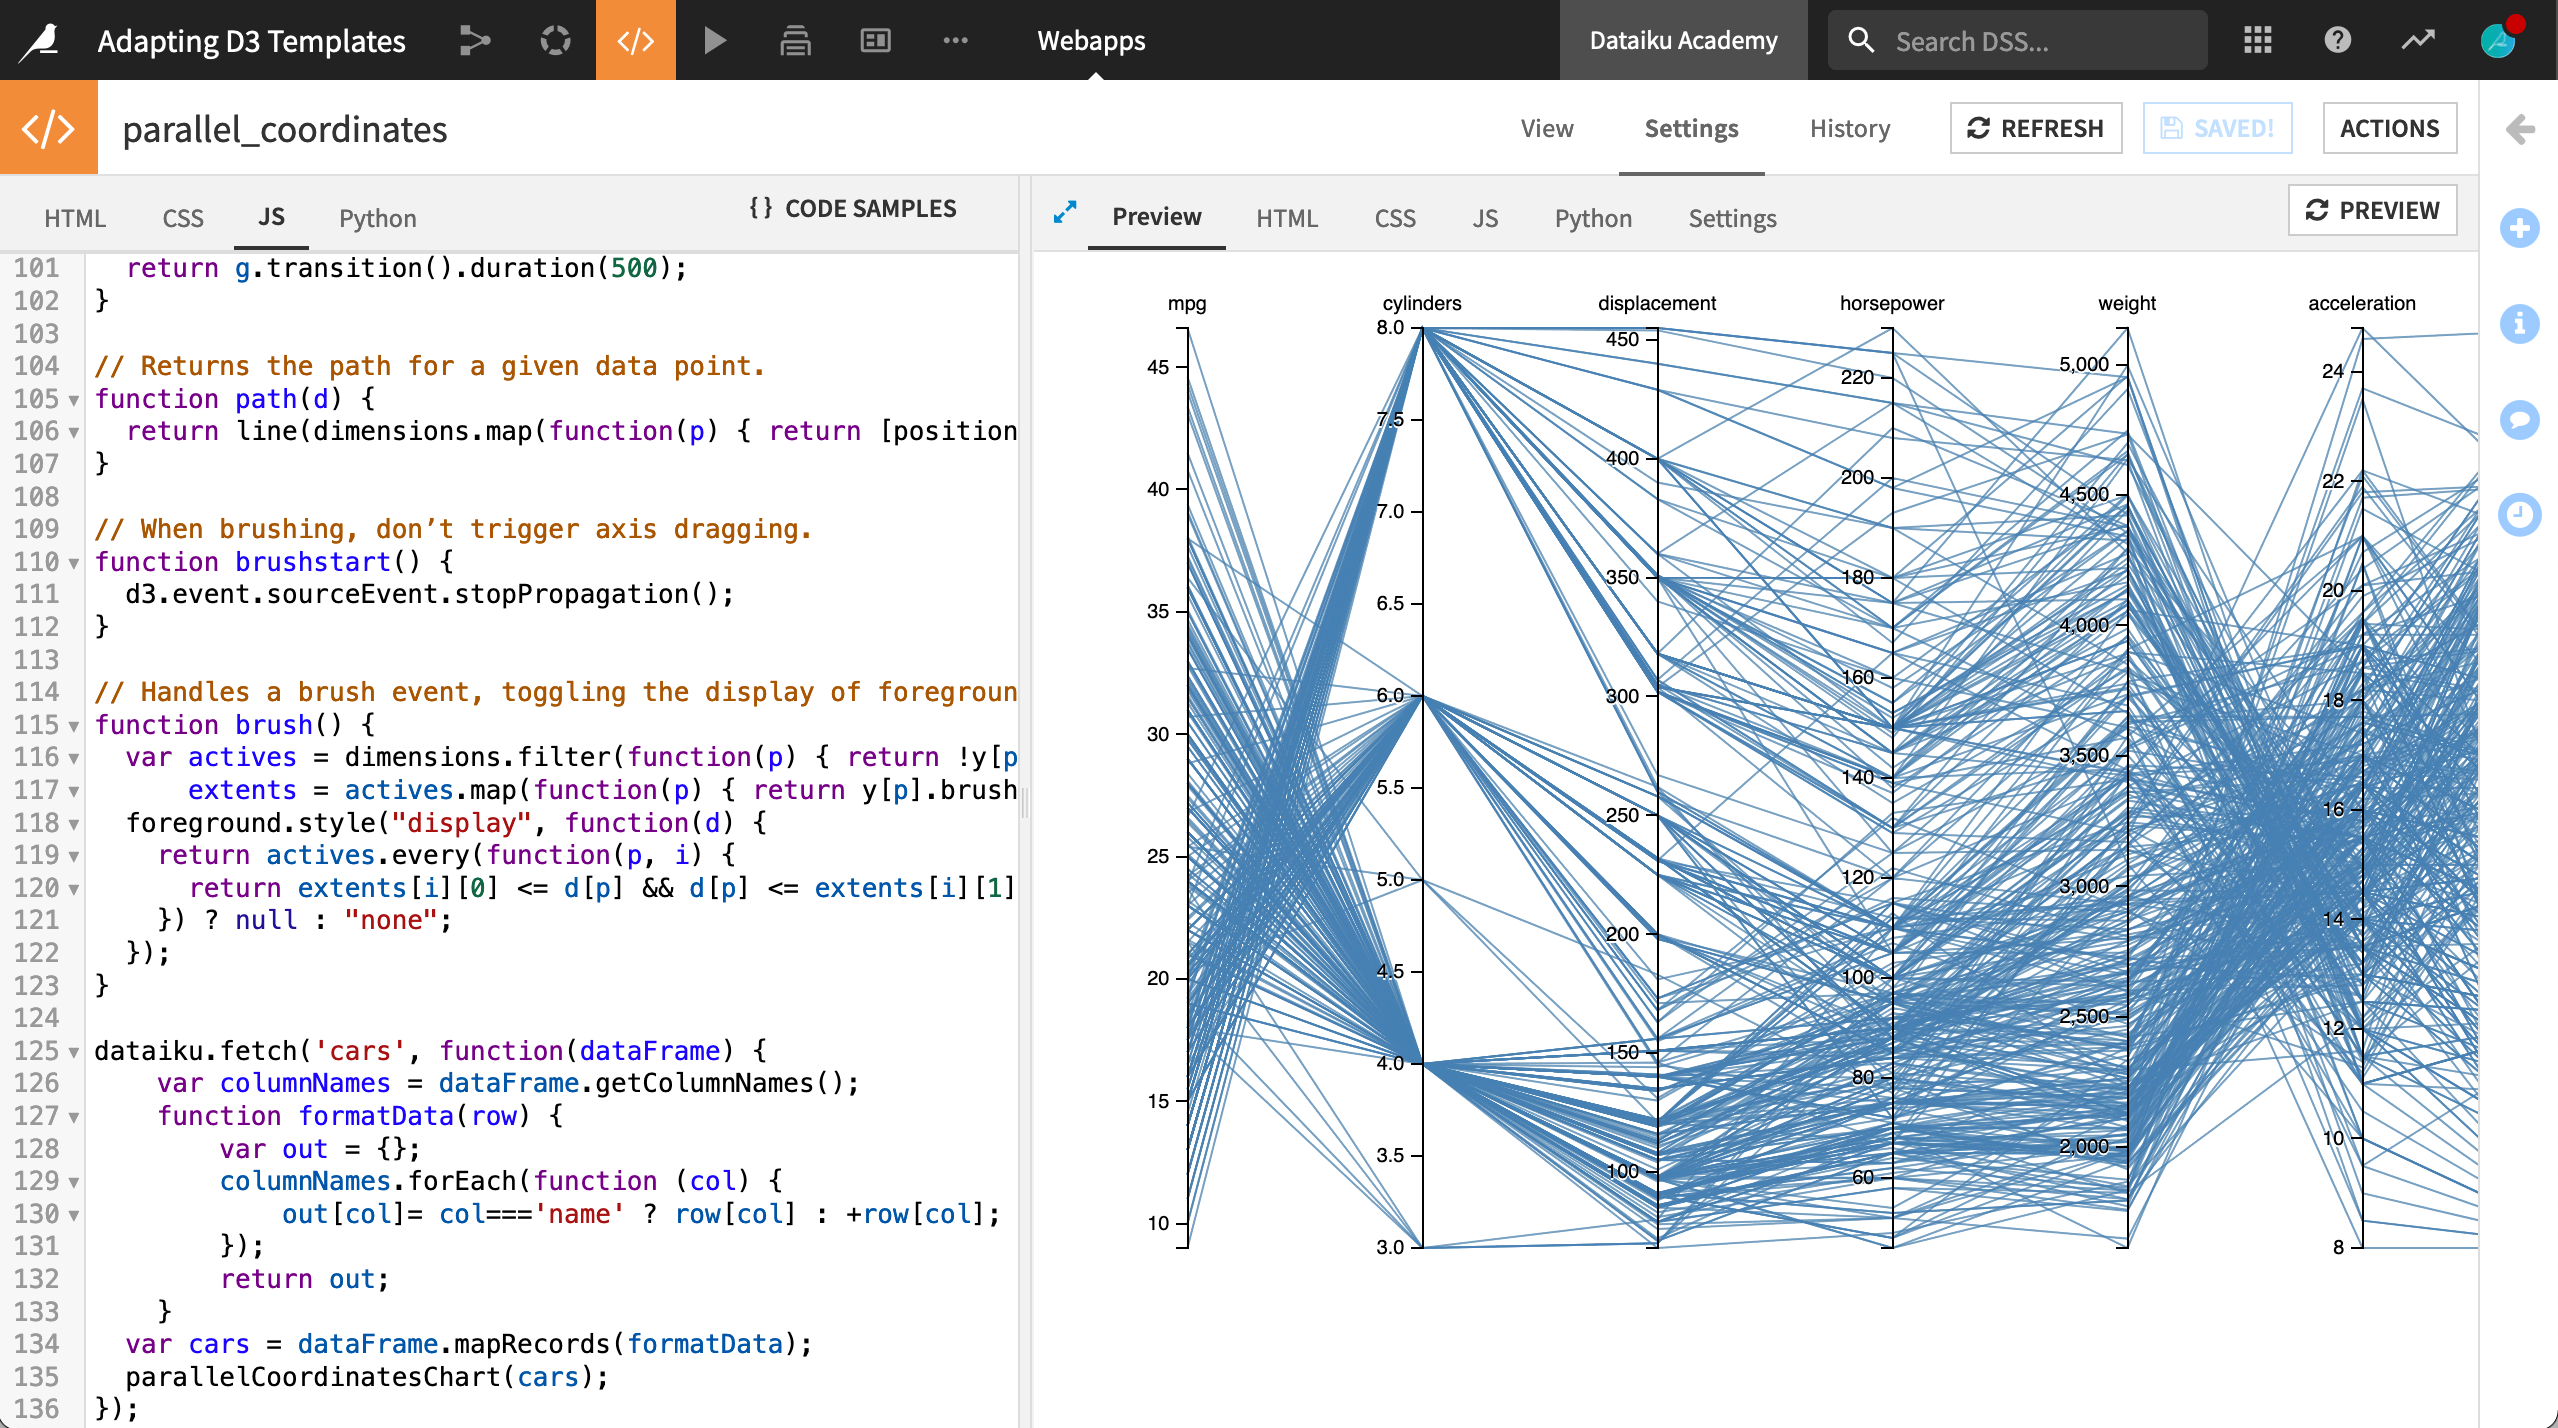
dataiku.fetch()function could have been added.Copy and paste the code below into the JS tab. This code creates the cars JSON array and calls the
parallelCoordinatesChart()function to create the chart.
dataiku.fetch('cars', function(dataFrame) {
    var columnNames = dataFrame.getColumnNames();
    function formatData(row) {
        var out = {};
        columnNames.forEach(function (col) {
            out[col]= col==='name' ? row[col] : +row[col];
        });
        return out;
    }
  var cars = dataFrame.mapRecords(formatData);
  parallelCoordinatesChart(cars);
});
That’s it, you have a running D3 data viz in your webapp!
Troubleshooting#
If you’re having trouble, be sure you have carefully followed all the steps. The best way to debug is to use the JS console in your browser with the webapp editor open.